
Understanding crime seems like a universal problem. Earlier, societies grappled with the problem of evil in the universe from a theological perspective; today, sociologists and criminologists construct theories and study society using a variety of tools and techniques. However the problem is cast, the aim is to better understand why some people violate social norms in ways that are often violent and harmful to those around them and even themselves. By better understanding this problem, ultimately we'd like to be able to create social programs and government policies that minimize the damage and create a safer and hopefully more just society for all involved.
Of course, as data scientists and programmers engaging in data analysis, we're inclined to approach this problem as a data problem. That's what we'll do in the rest of this chapter. We'll gather some crime and economic data and look for a tie between the two. In the course of our analysis, we'll explore the data, tentatively suggest a hypothesis, and test it against the data.
We'll look at crime data from the United Nations and see what relationships it has with data from the World Bank data site.
In order to get the data, perform the following steps:
- First, we need to download the data.
- For the crime data, we'll go to the website of the United Nations Office on Drugs and Crime (http://www.unodc.org/). It publishes crime data for countries around the world over a number of years. Their data page, http://www.unodc.org/unodc/en/data-and-analysis/statistics/data.html, has links to Excel files for a number of different categories of crime in the section of the page labeled Statistics on crime.
- You should download each of these and save them to the directory
unodc-data. You can extract the data from these in a minute. First, you can get the data that we want to correlate to the crime data. - We'll get this data from the World Bank's data site (http://data.worldbank.org/). Navigating the site is a little complicated, and in my experience it changes regularly. For the moment, at least, this seems to be the easiest way to get the data:
- Visit the Indicators page at http://data.worldbank.org/indicator.
- In the search box, enter
land areaand select Land area (sq. km), as shown in the following screenshot:
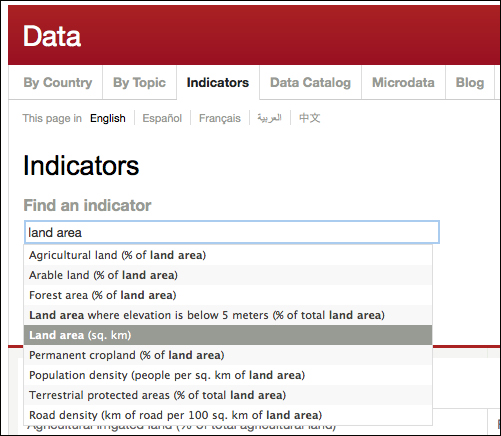
- Then hit the Go button.
- On the next page, you'll be given the option to download the dataset in a number of formats. Choose CSV.
- Download the data and unzip it into a directory named
ag.lnd, based on the indicator codes that the World Bank uses. (You can use a different directory name, but you'll need to modify the directions that follow.)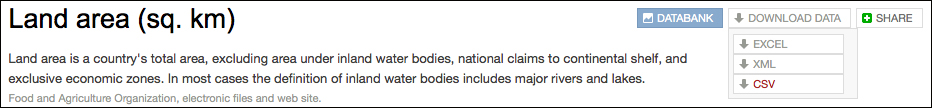
We'll also want some economic data. To get that, perform the following steps:
- Go back to the Indicators page.
- Search for GNI per capita (it's the default selection for the search box).
- From the filtered results, select GNI per capita, Atlas method (current US$).
- Click on Go.
- Download the data as CSV again.
- Unzip the data into a directory named
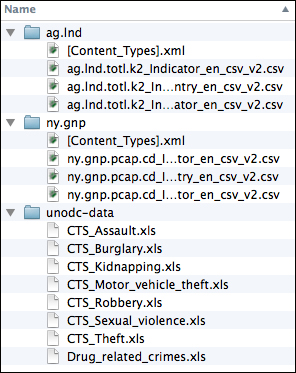
ny.gnp.
At this point, you should have a directory with several subdirectories containing data files. The structure should look something like the following screenshot:
Some of the data is ready to go, but before we use it, we need to extract the data from the Excel files. Let's turn our attention there.
Before we can extract the data from the Excel files, we need to find out what our input for this will be. If we open up one of the Excel files, in this case CTS_Assault.xls, we'll see something similar to the following screenshot:
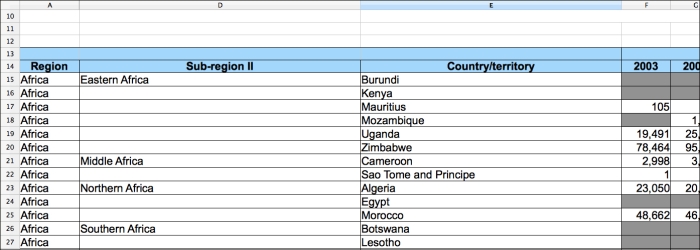
Let's list out some of the features of the sheets that we'll need to take into account:
- There are about thirteen rows of headers, most of which are hidden in the preceding screenshot.
- Again, not shown in the preceding screenshot, but some of the files have more than one tab of data.
- There are some hidden columns between columns A and D.
- The subregion isn't listed on each row, so we'll need some way to carry this over.
- All the years for each crime and country combination are listed on one row. We'll probably want to pivot that so that there's a column for the crime, one for the country, one for the year, and one for the data value.
- There is a lot of missing data. We can filter that out.
To get into the Excel files, we'll use the Apache POI project (http://poi.apache.org/). This library provides access to file formats of Microsoft Office's suites.
We'll use this library to extract the data from the Excel files in several stages, as follows:
- Pull raw data rows out of the Excel files
- Populate a tree of data that groups the data hierarchically by region, subregion, and country
- Flatten the hierarchically arranged data back into a sequence of maps containing all the data for each row
- Wrap all of this in one easy-to-use function
Let's follow the preceding steps for the rest of this section, and in the end we'll add a controller function that pulls it all together.
We'll keep all of this code in a single module. The following namespace declaration for this will include all the dependencies that we'll need. For the fully specified project.clj file that includes all of these, refer to the code download for this chapter. I named the project nullh, so the file that I'm working with here is named src/nullh/unodc.clj.
(ns nullh.unodc
  (:require [clojure.java.io :as io]
            [clojure.string :as str]
            [me.raynes.fs :as fs]
            [clojure.data.json :as json]
            [nullh.utils :as u])
  (:import
    [java.io FileInputStream]
    [org.apache.poi.ss.usermodel
     Cell CellStyle DataFormat Font RichTextString Row Sheet]
    [org.apache.poi.hssf.usermodel HSSFWorkbook]))
Now we can start populating this namespace.
For the first stage of the process, in which we read the data into a series of raw data rows, we'll use a couple of record types, as shown in the following code. The first, sheet-data, associates the title of the worksheet with the data in it. The second, xl-row, simply stores the data in each row's cells into named fields.
(defrecord sheet-data [sheet-name sheet-rows])
(defrecord xl-row
  [sheet region sub-region country
   count-2003 count-2004 count-2005 count-2006 count-2007
   count-2008 count-2009 count-2010 count-2011
   rate-2003 rate-2004 rate-2005 rate-2006 rate-2007
   rate-2008 rate-2009 rate-2010 rate-2011])
As we interact with the worksheet's data and API, we'll use a number of utilities that makes access to the worksheet objects more like working with native Clojure objects. The following are some of those utilities:
(defn sheets [workbook]
  (->> workbook
    (.getNumberOfSheets)
    (range)
    (map #(.getSheetAt workbook %))))
(defn rows [sheet]
  (->> sheet
    (.getPhysicalNumberOfRows)
    (range)
    (map #(.getRow sheet %))
    (remove nil?)))
(defn cells [row]
  (->> row
    (.getPhysicalNumberOfRows)
    (range)
    (map #(.getCell row %))))
We'll spend a lot of time accessing cells' values. We'll want to make a simpler, more Clojure-like wrapper around the Java library's API for accessing them. How we do this will depend on the cell's type, and we can use multimethods to handle dispatching for it, as shown in the following code:
(defn cell-type [cell]
  (if (nil? cell)
    nil
    (let [cell-types {Cell/CELL_TYPE_BLANK   :blank
                      Cell/CELL_TYPE_BOOLEAN :boolean
                      Cell/CELL_TYPE_ERROR   :error
                      Cell/CELL_TYPE_FORMULA :formula
                      Cell/CELL_TYPE_NUMERIC :numeric
                      Cell/CELL_TYPE_STRING  :string}]
      (cell-types (.getCellType cell)))))
(defmulti cell-value cell-type)
(defmethod cell-value :blank   [_] nil)
(defmethod cell-value :boolean [c] (.getBooleanCellValue c))
(defmethod cell-value :error   [c] (.getErrorCellValue   c))
(defmethod cell-value :formula [c] (.getErrorCellValue   c))
(defmethod cell-value :numeric [c] (.getNumericCellValue c))
(defmethod cell-value :string  [c] (.getStringCellValue  c))
(defmethod cell-value :default [c] nil)
Now, with these methods in place, we can easily read the data into a sequence of data rows. First, we'll need to open the workbook file with the following code:
(defn open-file [filename]
  (with-open [s (io/input-stream filename)]
    (HSSFWorkbook. s)))
And we can take each sheet and read it into a sheet-data record with the following code:
(defn get-sheet-data [sheet]
  (->sheet-data (.getSheetName sheet) (rows sheet)))
The rows themselves will need to go through a number of transformations, all without touching the sheet name field. To facilitate this, we'll define a higher order function that maps a function over the rows field, as follows:
(defn on-rows [sheet f]
  (assoc sheet :sheet-rows (f (:sheet-rows sheet))))
The first row transformation will involve skipping the header rows for each sheet, as shown in the following code:
(defn first-cell-empty? [cells]
  (empty? (cell-value (first cells))))
(defn skip-headers [sheet]
  (on-rows sheet (fn [r]
                   (->> r
                     (drop-while #(first-cell-empty? (cells %)))
                     (drop 1)
                     (take-while #(not (first-cell-empty? %)))))))
Now we can take the sequence of sheet-data records and flatten them by adding the sheet name onto the row data as follows:
(defn row-values [sheet-name row]
  (conj (mapv cell-value (cells row)) sheet-name))
(defn sheet-data->seq [sheet]
  (map #(row-values (:sheet-name sheet) %) (:sheet-rows sheet)))
We do need to take each row and clean it up by rearranging the field order, making sure it has exactly the right number of fields with the help of the following code:
(defn clean-row [row]
  (u/pad-vec 22
             (concat (list (last row) (first row))
                     (take 11 (drop 3 row))
                     (drop 15 row))))
Now that we've hardened our data a little, we can take the Clojure vectors and populate the xl-row records with them as follows:
(defn seq->xl-row [coll] (apply ->xl-row coll))
Finally, we have a fairly clean sequence of row data.
Unfortunately, we haven't yet dealt with some problems, such as the subregion not being populated in every row. Let's take care of that now.
We'll tackle that problem by changing the sequence of records into a hierarchical tree of data. The tree is represented by a number of record types as shown in the following code:
(defrecord region [region-name sub-regions])
(defrecord sub-region [sub-region-name countries])
(defrecord country [country-name counts rates sheet])
(defrecord yearly-data
   [year-2003 year-2004 year-2005 year-2006 year-2007 year-2008
    year-2009 year-2010 year-2011])
To build the tree, we'll have a number of functions. Each takes a group of data that will go into one tree or subtree. It populates that part of the tree and returns it.
The first of these functions is xl-rows->regions. It takes a sequence of xl-rows, groups them by region, and constructs a tree of region records for it as shown in the following code:
(defn xl-rows->regions [coll]
  (->> coll
    (group-by :region)
    (map #(->region
            (first %) (xl-rows->sub-regions (second %))))))
The most complicated part of building this tree is dealing with the missing subregions. We'll use three functions to deal with that. The first, conj-into, conjugates onto a value in a map, or adds a new vector containing the data if there's no data for that key. The second, fold-sub-region, folds each row into a map based on either the subregion referred to in the row, or the last specified subregion. Finally, xl-rows->sub-regions takes a sequence of rows from one region, divides them into subregions, and creates the sub-region records for them, as shown in the following code:
(defn conj-into [m k v]

  (if (contains? m k)
    (assoc m k (conj (get m k) v))
    (assoc m k [v])))
(defn fold-sub-region [state row]
  (let [[current accum] state]
    (if (str/blank? (:sub-region row))
      [current
       (conj-into accum current (assoc row :sub-region current))]
      (let [new-sub-region (:sub-region row)]
        [new-sub-region
         (conj-into accum new-sub-region row)]))))
(defn xl-rows->sub-regions [coll]
  (->> coll
    (reduce fold-sub-region [nil {}])
    second
    (map #(->sub-region
            (first %) (xl-rows->countries (second %))))))
Now that we have the subregions identified, we can build a tree for each country. For that, we'll pull the count data and the rate data into their own structures and put it all together into a country record with the following code:
(defn xl-rows->countries [coll]
  (->> coll
    (group-by :country)
    (map #(let [[country-name [row & _]] %]
            (->country country-name
                       (xl-row->counts row)
                       (xl-row->rates row)
                       (:sheet row))))))
The counts and rates are represented by the same record type, so we'll use a shared function to pull the fields from the row that populate the fields in the type as shown in the following code:
(defn xl-row->yearly [coll fields]
  (apply ->yearly-data (map #(get coll %) fields)))
(defn xl-row->counts [coll]
  (xl-row->yearly
    coll
    [:count-2003 :count-2004 :count-2005 :count-2006 :count-2007
     :count-2008 :count-2009 :count-2010 :count-2011]))
(defn xl-row->rates [coll]
  (xl-row->yearly
    coll
    [:rate-2003 :rate-2004 :rate-2005 :rate-2006 :rate-2007
     :rate-2008 :rate-2009 :rate-2010 :rate-2011]))
These functions all build the hierarchy of data that's stored in the worksheets.
We reverse the process to flatten the data again. In the process, this implicitly populates the missing subregions into all of the rows. Let's see how this works.
To begin with, we take a sequence of regions and convert each one into a sequence of xl-row records, as shown in the following code:
(defn region->xl-rows [tree nil-row]
  (let [region-row (assoc nil-row :region (:region-name tree))]
    (mapcat #(sub-regions->xl-rows % region-row)
            (:sub-regions tree))))
(defn regions->xl-rows [region-coll]
  (let [nil-row (seq->xl-row (repeat 22 nil))]
    (mapcat #(region->xl-rows % nil-row) region-coll)))
Just as before, this work will be delegated to other functions; in this case, sub-regions->xl-rows, which again delegates to country->xl-rows. The second function in the following code is a little long (and so I've omitted some lines from it), but both are conceptually simple:
(defn country->xl-rows [tree sub-region-row]
  (let [counts (:counts tree), rates (:rates tree)]
    (assoc sub-region-row
           :sheet (:sheet tree)
           :country (:country-name tree)
           :count-2003 (:year-2003 counts)
           :count-2004 (:year-2004 counts)
           ;; ...
           :rate-2003 (:year-2003 rates)
           :rate-2004 (:year-2004 rates)
           ;; ...
           )))
(defn sub-regions->xl-rows [tree region-row]
  (let [sub-region-row (assoc region-row :sub-region
                              (:sub-region-name tree))]
    (map #(country->xl-rows % sub-region-row) (:countries tree))))
At this point, we have a sequence of data rows with the missing subregions supplied. But we're still not done.
We'll provide several levels of function to make this easier. First, one that ties together everything that we've seen so far. It takes a filename and returns a sequence of xl-row records as follows:
(defn read-sheets [filename]
  (->> filename
    (open-file)
    (sheets)
    (map get-sheet-data)
    (map skip-headers)
    (map (fn [s] (on-rows s #(remove empty? %))))
    (mapcat sheet-data->seq)
    (map clean-row)
    (map seq->xl-row)
    (xl-rows->regions)
    (regions->xl-rows)))
That's it. We have our data read in. It's been processed a little, but it's still pretty raw. The following is an example row:
{:sheet "CTS 2012 Domestic Burglary",
 :region "Africa",
 :sub-region "Middle Africa",
 :country "Sao Tome and Principe",
 :count-2003 nil,
 :count-2004 nil,
 :count-2005 nil,
 :count-2006 2.0,
 :count-2007 0.0,
 :count-2008 2.0,
 :count-2009 5.0,
 :count-2010 16.0,
 :count-2011 20.0,
 :rate-2003 nil,
 :rate-2004 nil,
 :rate-2005 nil,
 :rate-2006 1.290572368845583,
 :rate-2007 0.0,
 :rate-2008 1.2511573205214825,
 :rate-2009 3.0766390794695875,
 :rate-2010 9.673694202434143,
 :rate-2011 11.867604998635224}
We still need to clean it up a little and pivot the data to put each data value into its own row. Instead of having one row with :count-2003, :count-2004, and so on, we'll have many rows, each with :count and :year.
Let's turn our attention there next.
So far, we've only lightly cleaned part of our data. We haven't even looked at the data that we want to correlate the crime data with. Also, the shape of the data is awkward for the analyses that we want to conduct, so we'll need to pivot it the way we described earlier. We'll see more about this in a minute.
For this stage of processing, we want to put all of the code into a new file. We'll name this file src/nullh/data.clj, and the namespace declaration for it looks as follows:
(ns nullh.data
  (:require [incanter.core :as i]
            [incanter.io :as iio]
            [clojure.set :as set]
            [clojure.string :as str]
            [clojure.data.csv :as csv]
            [clojure.data.json :as json]
            [clojure.java.io :as io]
            [me.raynes.fs :as fs]
            [nullh.unodc :as unodc]
            [nullh.utils :as u]))
We'll now start working with Incanter datasets. We haven't used Incanter much so far in this book, and that's a little unusual, because Incanter is one of the go-to libraries for working with numbers and statistics in Clojure. It's powerful and flexible, and it makes working with data easy.
Let's take the data that we read from the Excel files and import it into an Incanter dataset. We need to read the data into one long sequence, pull out the keys for the data fields, and then create the dataset as follows:
(defn read-cts-data [dirname]
  (let [input (mapcat unodc/read-sheets (u/ls dirname))
        cols (keys (first input))]
    (i/dataset cols (doall (map #(map second %) input)))))
Now we can read the data that we downloaded from the World Bank into another dataset. Both data files have roughly the same fields, so we can use the same function for both. Unfortunately, we need to load the CSV ourselves, because Incanter's introspection doesn't quite give us the results that we want. Because of this, we'll also include a few functions for converting the data into doubles as we read it in, and we'll define those columns that the data contains, as follows:
(def headers [:country-name :country-code :indicator-name
              :indicator-code :1961 :1962 :1963 :1964 :1965 :1966
              :1967 :1968 :1969 :1970 :1971 :1972 :1973 :1974
              :1975 :1976 :1977 :1978 :1979 :1980 :1981 :1982
              :1983 :1984 :1985 :1986 :1987 :1988 :1989 :1990
              :1991 :1992 :1993 :1994 :1995 :1996 :1997 :1998
              :1999 :2000 :2001 :2002 :2003 :2004 :2005 :2006
              :2007 :2008 :2009 :2010 :2011 :2012 :2013])
(defn ->double [x] (if (str/blank? x) nil (Double/parseDouble x)))
(defn coerce-row [row]
  (let [[x y] (split-at 4 row)]
    (concat x (map ->double y))))
(defn read-indicator-data [filename]
  (with-open [f (io/reader filename)]
    (->> f
      csv/read-csv
      (drop 3)
      (map coerce-row)
      doall
      (i/dataset headers))))
We can use the read-indicator-data function to load data from the two World Bank indicators that we downloaded earlier.
Now we want to put all the data from UNODC together with either of the World Bank datasets. As we do that, we'll also pivot the data tables so that instead of one column for each year, there's one column containing the year and one containing the value for that year. At the same time, we'll remove rows with missing data and aggregate the counts for all of the crimes for a country for each year.
Bringing the two data sources together is relatively simple and can be done with the following code:
(defn join-all [indicator cts]
  (i/$join [:country-name :country] indicator cts))
Basically, we just let Incanter join the two data structures on the fields by matching the World Bank data's :country-name field with the UNODC data's :country field.
Now that the data has been joined, we can pivot it. In the end, we want to have the following fields on every row:
regionsubregioncountrycountry-codeindicatorindicator-codecrimeyearcountrateindicator-value
As you can see, some of these fields are from the UNODC data and some are from the World Bank data.
We'll do this translation on a sequence of maps instead of the dataset. We'll get started with the following code:
(defn pivot-map [m]
  (let [years [2003 2004 2005 2006 2007 2008 2009 2010 2011]]
    (map #(pivot-year m %) years)))
(defn pivot-data [map-seq] (mapcat pivot-map map-seq))
First, we use ->maps to convert the dataset to a sequence of maps. Then, pass the processing off to pivot-map. This function pivots the data for each year.
We pivot the data for each year separately. We do this by repeatedly transforming the data map for a row. This is a great example of how Clojure's immutability makes things easier. We don't have to worry about copying the map or clobbering any data. We can just modify the original data multiple times, saving the result of each transformation process as a separate, new data row.
The process itself is fairly simple. First, we use the year to create keywords for the fields that we are interested in. Next, we select the rows that we want to keep from the original data map. Then we rename a few to make them clearer. And finally, we add the year to the output map as follows:
(defn pivot-year [m year]
  (let [count-key (keyword (str "count-" year))
        rate-key (keyword (str "rate-" year))
        year-key (keyword (str year))]
    (-> m
      (select-keys [:region :sub-region :country :country-code
                    :indicator :indicator-code
                    :sheet count-key rate-key year-key])
      (set/rename-keys {:sheet :crime,
                        count-key :count,
                        rate-key :rate,
                        year-key :indicator-value})
      (assoc :year year))))
That's it. This should make the data easier to work with. We can do some more transformations on the data and clean it up a bit further.
First, there are a lot of holes in the data, and we don't want to have to worry about that. So if a row is missing any of the three data fields (:count, :rate,or :indicator-value), let's get rid of it with the following code:
(defn remove-missing [coll]
  (let [fields [:count :rate :indicator-value]
        has-missing (fn [r] (some nil? (map r fields)))]
    (remove has-missing coll)))
We just check whether any of these fields has a nil value. If any of them do, we remove that row.
Let's make a wrapper function around this process. That'll help us stay consistent and make the library easier to use. This loads the data from UNODC and one of the World Bank datasets. It joins, pivots, and removes the missing rows before returning an Incanter dataset, as shown in the following code:
(defn ->maps [dset]
  (let [col-names (i/col-names dset)]
    (map #(zipmap col-names %) (i/to-list dset))))
(defn load-join-pivot [cts-dir data-file]
  (let [cts (read-cts-data cts-dir)
        indicator-data (read-indicator-data data-file)]
    (->> (join-all indicator-data cts)
      ->maps
      pivot-data
      remove-missing
      i/to-dataset)))
Let's use these functions to load up one of the datasets as follows:
(def d (d/load-join-pivot
         "unodc-data"
         "ag.lnd/ag.lnd.totl.k2_Indicator_en_csv_v2.csv"))
At this point, the data is in decent shape—actually, as good as this data is probably going to get (more about that near the end of this chapter). So let's see what's in the data and what it has to tell us.