
In creating an A/B test, we need to decide several things, and then we need to put our plan into action. We'll walk through those decisions here and create a simple set of web pages that will test the aspects of design that we are interested in changing, based upon the behavior of the user.
Before we start building stuff, though, we need to think through our experiment and what we'll need to build.
For this chapter, we're going to pretend that we have a website to sell widgets (or rather, looking at the Widgets! website).
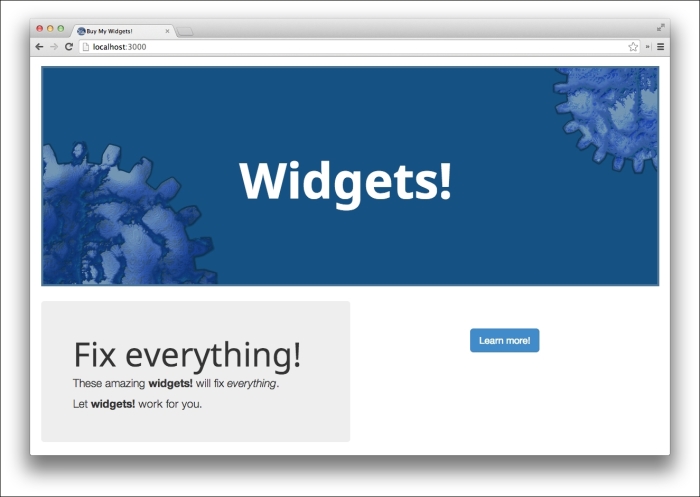
The web page in this screenshot is the control page. Currently, we're getting 24 percent click-through on it from the Learn more! button.
We're interested in the text of the button. If it read Order now! instead of Learn more!, it might generate more click-through. (Of course, actually explaining what the product is and what problems it solves might be more effective, but one can't have everything.) This will be the test page, and we're hoping that we can increase the click-through rate to 29 percent (a five percent absolute increase).
Now that we have two versions of the page to experiment with, we can frame the experiment statistically and figure out how many subjects we'll need for each version of the page in order to achieve a statistically meaningful increase in the click-through rate on that button.
First, we need to frame our experiment in terms of the null-hypothesis test. In this case, the null hypothesis would look something like this:
Changing the button copy from Learn more! to Order now! Would not improve the click-through rate.
Remember, this is the statement that we're hoping to disprove (or fail to disprove) in the course of this experiment.
Now we need to think about the sample size. This needs to be fixed in advance. To find the sample size, we'll use the standard error formula, which will be solved to get the number of observations to make for about a 95 percent confidence interval in order to get us in the ballpark of how large our sample should be:
In this, δ is the minimum effect to detect and σ² is the sample variance. If we are testing for something like a percent increase in the click-through, the variance is σ² = p(1 – p), where p is the initial click-through rate with the control page.
So for this experiment, the variance will be 0.24(1-0.24) or 0.1824. This would make the sample size for each variable 16(0.1824 / 0.05²) or almost 1170.
The code to compute this in Clojure is fairly simple:
(defn get-target-sample [rate min-effect]
  (let [v (* rate (- 1.0 rate))]
    (* 16.0 (/ v (* min-effect min-effect)))))
Running the code from the prompt gives us the response that we expect:
user=> (get-target-sample 0.24 0.05)
1167.36
Part of the reason to calculate the number of participants needed is that monitoring the progress of the experiment and stopping it prematurely can invalidate the results of the test because it increases the risk of false positives where the experiment says it has disproved the null hypothesis when it really hasn't.
This seems counterintuitive, doesn't it? Once we have significant results, we should be able to stop the test. Let's work through it.
Let's say that in actuality, there's no difference between the control page and the test page. That is, both sets of copy for the button get approximately the same click-through rate. If we're attempting to get p ≤ 0.05, then it means that the test will return a false positive five percent of the time. It will incorrectly say that there is a significant difference between the click-through rates of the two buttons five percent of the time.
Let's say that we're running the test and planning to get 3,000 subjects. We end up checking the results of every 1,000 participants. Let's break down what might happen:
|
Run |
A |
B |
C |
D |
E |
F |
G |
H |
|---|---|---|---|---|---|---|---|---|
|
1000 |
No |
No |
No |
No |
Yes |
Yes |
Yes |
Yes |
|
2000 |
No |
No |
Yes |
Yes |
No |
Yes |
No |
Yes |
|
3000 |
No |
Yes |
No |
Yes |
No |
No |
Yes |
Yes |
|
Final |
No |
Yes |
No |
Yes |
No |
No |
Yes |
Yes |
|
Stopped |
No |
Yes |
Yes |
Yes |
Yes |
Yes |
Yes |
Yes |
Let's read this table. Each lettered column represents a scenario for how the significance of the results may change over the run of the test. The rows represent the number of observations that have been made. The row labeled Final represents the experiment's true finishing result, and the row labeled Stopped represents the result if the experiment is stopped as soon as a significant result is seen.
The final results show us that out of eight different scenarios, the final result would be significant in four cases (B, D, G, and H). However, if the experiment is stopped prematurely, then it will be significant in seven cases (all but A). The test could drastically over-generate false positives.
In fact, most statistical tests assume that the sample size is fixed before the test is run.
It's exciting to get good results, so we'll design our system so that we can't easily stop it prematurely. We'll just take that temptation away.
With this in mind, let's consider how we can implement this test.
There are several options to actually implement the A/B test. We'll consider several of them and weigh their pros and cons. Ultimately, the option that works best for you really depends on your circumstances. However, we'll pick one for this chapter and use it to implement the test for it.
The first way to implement A/B testing is to use a server-side implementation. In this case, all of the processing and tracking is handled on the server, and visitors' actions would be tracked using GET or POST parameters on the URL for the resource that the experiment is attempting to drive traffic towards.
The steps for this process would go something like the following ones:
- A new user visits the site and requests for the page that contains the button or copy that is being tested.
- The server recognizes that this is a new user and assigns the user a tracking number.
- It assigns the user to one of the test groups.
- It adds a row in a database that contains the tracking number and the test group that the user is part of.
- It returns the page to the user with the copy, image, or design that is reflective of the control or test group.
- The user views the returned page and decides whether to click on the button or link or not.
- If the server receives a request for the button's or link's target, it updates the user's row in the tracking table to show us that the interaction was a success, that is, that the user did a click-through or made a purchase.
This way of handling it keeps everything on the server, so it allows more control and configuration over exactly how you want to conduct your experiment.
A second way of implementing this would be to do everything using JavaScript (or ClojureScript, https://github.com/clojure/clojurescript). In this scenario, the code on the page itself would randomly decide whether the user belonged to the control or the test group, and it would notify the server that a new observation in the experiment was beginning. It would then update the page with the appropriate copy or image. Most of the rest of this interaction is the same as the one in previous scenario. However, the complete steps are as follows:
- A new user visits the site and requests for the page that contains the button or copy being tested.
- The server inserts some JavaScript to handle the A/B test into the page.
- As the page is being rendered, the JavaScript library generates a new tracking number for the user.
- It assigns the user to one of the test groups.
- It renders that page for the group that the user belongs to, which is either the control group or the test group.
- It notifies the server of the user's tracking number and the group.
- The server takes this notification and adds a row for the observation in the database.
- The JavaScript in the browser tracks the user's next move either by directly notifying the server using an AJAX call or indirectly using a GET parameter in the URL for the next page.
- The server receives the notification whichever way it's sent and updates the row in the database.
The downside of this is that having JavaScript take care of rendering the experiment might take slightly longer and may throw off the experiment. It's also slightly more complicated, because there are more parts that have to communicate. However, the benefit is that you can create a JavaScript library, easily throw a small script tag into the page, and immediately have a new A/B experiment running.
In reality, though, you'll probably just use a service that handles this and more for you. However, it still makes sense to understand what they're providing for you, and that's what this chapter tries to do by helping you understand how to perform an A/B test so that you can be make better use of these A/B testing vendors and services.
For the purposes of this chapter, we'll implement the A/B test on the server.
First, we'll create a new project using Leiningen 2 (http://leiningen.org/) and the Luminus web framework (http://www.luminusweb.net/). We'll include some options to include the H2 embedded database (http://www.h2database.com/) and ClojureScript support (https://github.com/clojure/clojurescript). We do this with the following command line:
lein new luminus web-ab +h2 +cljs
This command creates the scaffolding for a website. We'll first get familiar with what the scaffolding provides, and then we'll fill in the parts of the site with the core site. Next, we'll add the A/B testing, and finally, we'll add a couple of pages to view the results.
Luminus is a web framework that is built by combining other libraries and tying them together. For database access and models, it uses Korma (http://sqlkorma.com/). For HTML templates, it uses Selmer (https://github.com/yogthos/Selmer), which is a port of Django-style templates. For routing, controllers, sessions, and everything else, it uses lib-noir (http://yogthos.github.io/lib-noir/) and Compojure (https://github.com/weavejester/compojure/).
Everything in the directory that contains a Luminus project will be a consistent set of subdirectories named after the project. For instance, in the project that we just created for this (web-ab), the primary directories would be as follows:
resourcesis the directory of static resources. It contains the CSS, JavaScript, and image files for the site.srcis the directory of Clojure files. Several of the subdirectories in this directory tree are important too, so I'll list them separately.src/web_ab/models/is the directory that contain the Clojure files that define the model and interact with the database.src/web_ab/routes/is the directory that lists the routes in a web application. Each module under this defines the routes and handlers for a particular subsection of the site.src/web_ab/views/templates/is the directory that contains the Selmer templates.test/web_ab/test/is the directory that contains theclojure.testtests for the site's handlers.
We'll primarily deal with the directories under src/web-ab/. We'll define the models, define the routes and handlers, and fill in the templates.
As we work, we can view the site as we're developing it by using the development server. You can start this using the following Leiningen command:
lein ring server
Once this server is executed, we can view the site by pointing our browser to http://localhost:3000/.
First, we need to add in the content for the main page. The file that we'll want to change will be in src/web_ab/views/templates/home.html. We'll add the following HTML content to that page. (There are a lot more CSS and images involved in creating the site that we saw in the screenshot earlier. All this is listed in the code download for this chapter.) Take a look at the following code:
{% extends "web_ab/views/templates/base.html" %}
{% block content %}
<header id="banner" class="row">
  <div class="col-md-12">
    <h1 style="width: 4.5em;" class="center-block">Widgets!</h1>
  </div>
</header>
<div id="content" class="row">
  <div id="left-panel" class="col-md-6 jumbotron">
    <h1>Fix everything!</h1>
    <p>These amazing <strong>widgets!</strong> will fix
      <em>everything</em>.</p>
    <p>Let <strong>widgets!</strong> work for you.</p>
  </div>
  <div id="right-panel" class="col-md-6 jumbotron">
    <a href="/purchase/" id="btn-more"
       class="btn btn-primary btn-lg center-block">
      Learn more!
    </a>
  </div>
</div>
{% endblock %}
When the time comes to add in the A/B testing features, we'll change this a little, but most of this is good as it is.
We'll also need a page to direct the users to if they want to buy a widget. We'll first define a route for this page in the src/web_ab/routes/home.clj file. The following is the route and the controller:
(defn purchase-page []
  (layout/render "purchase.html" {}))
(defroutes home-routes
  (GET "/" [] (home-page))
  (GET "/purchase/" [] (purchase-page)))
The view is defined in the src/web_ab/views/templates/purchase.html file. This file is very similar to the preceding template file, except that it's considerably simpler. It just contains a thank you message for the left panel, and there's no button or link on the right-hand side. For more details about this page, see the code download.

In fact, this is enough to define the base, control site in this project. Now let's look at what we need to do to define the A/B testing features.
Adding A/B testing into the site that we have so far will be pretty straightforward web development. We'll need to define a model and functions that implement the test framework's basic functionality. We can then incorporate them into the site's existing controllers and views:
- The code that defines the data and the database settings will go into the
src/web_ab/models/schema.cljfile. It will start with the following namespace declaration:(ns web-ab.models.schema (:require [clojure.java.jdbc :as sql] [noir.io :as io])) - The first facet of this section of the site that we'll define is the model. We'll add a table to the database schema that defines a table to track the A/B participants:
(defn create-abtracking-table [] (sql/with-connection db-spec (sql/create-table :abtracking [:id "INTEGER IDENTITY"] [:testgroup "INT NOT NULL"] [:startat "TIMESTAMP NOT NULL DEFAULT NOW()"] [:succeed "TIMESTAMP DEFAULT NULL"]))) - Now, in the
src/web_ab/models/db.cljfile, we'll define some low-level functions to work with the rows in this table. For this file, we'll use the following namespace declaration:(ns web-ab.models.db (:use korma.core [korma.db :only (defdb)]) (:require [web-ab.models.schema :as schema] [taoensso.timbre :as timbre])) - The first function in this namespace will take a group keyword (
:controlor:test) and insert a row into the database with a code that represents that group and the default values for the starting time (the current time) and the time in which the interaction succeeds (NULL):(defn create-abtracking [group] (get (insert abtracking (values [{:testgroup (group-code group)}])) (keyword "scope_identity()"))) - Next, we'll create a function that sets an
abtrackingobject's succeed field to the current time. This will mark the interaction as a success:(defn mark-succeed [id] (update abtracking (set-fields {:succeed (sqlfn :now)}) (where {:id id})))
These, along with a few other functions that you can find in the code download for this chapter, will form a low-level interface with this data table. Most of the time, however, we'll deal with A/B testing using a slightly higher-level interface.
This interface will live in the src/web_ab/ab_testing.clj file. It will contain the following namespace declaration:
(ns web-ab.ab-testing
  (:require [noir.cookies :as c]
            [taoensso.timbre :as timbre]
            [web-ab.models.db :as db]
            [incanter.stats :as s]
            [clojure.set :as set]
            [web-ab.util :as util])
  (:import [java.lang Math]))
To understand the code in this module, we need to first talk about how the A/B testing system will work. We have the following number of requirements that we need to make sure are implemented:
- If the users have visited the site before the A/B test, they should see the control version of the site. We assume that there's a tracking cookie already being used for this. In this case, the cookie will be named visits, and it will simply track the number of times a user has visited the home page of the site.
- If this is the users' first visit to the site, they will be randomly assigned to the control group or the test group, and they'll be shown the appropriate page for that group. Also, they'll receive a tracking cookie for the observation that they are, and we'll insert the tracking information for them into the database.
- If the users have visited the site earlier and are participants in the A/B test, they should see the same version of the site that they saw previously.
- Finally, when a user who is a participant in the experiment visits the purchase page, that observation in the experiment will be marked as a success.
We'll write functions for most of these cases as well as a function to route the user to the right branch whenever one visits the front page. We'll write another function to handle item number four.
For the first function, we'll implement what's necessary to start a new observation in the experiment. We'll enter the functions into the database and insert the tracking cookie into the session:
(defn new-test [test-cases]
  (let [[group text] (rand-nth (seq test-cases))
        ab-tracking (db/get-abtracking
                      (db/create-abtracking group))]
    (c/put! :abcode (:id ab-tracking))
    text))
The functions in the db namespace (aliased from web-ab.models.db) are from the low-level model interface that we just defined. In fact, the implementation for create-abtracking is listed on the preceding page.
The c/put! function is from the noir.cookies namespace. It inserts the cookie value into the session. In this case, it inserts the tracking instance's database ID under the abcode key.
Finally, new-test returns the text that should be used on the page.
The next function for this level of abstraction is get-previous-copy. This is used whenever a user who is already a participant in the experiment visits the page again. It takes a database ID and the different versions of the site that are being used in the current test, and it retrieves the row from the database and looks up the right copy text to be used on the page, given whether the observation is in the control group or the test group:
(defn get-previous-copy [ab-code test-cases]
  (-> ab-code
    db/get-abtracking
    :testgroup
    db/code->group
    test-cases))
This function simply runs the input through a number of conversions. First, this function converts it to a full data row tuple based on the database ID. Next, it selects the testgroup field, and it translates it into a group keyword. This is finally translated into the appropriate text for the page, based on the group keyword.
The next function that we're going to look at ties the two previous functions together with item number one from the preceding list (where the returning visitors are shown the control page without being entered into the experiment):
(defn start-test [counter default test-cases]
  (let [c (Long/parseLong (c/get counter "0"))
        ab-code (get-abcode-cookie)]
    (c/put! counter (inc c))
    (cond
      (and (>= ab-code 0) (> c 0))
      (get-previous-copy ab-code test-cases)

      (and (< ab-code 0) (> c 0)) default

      :else (new-test test-cases))))
First, this function expects three parameters: the cookie name for the counter, the default text for the control page, and a map from the group keywords to page text. This function looks at the value of the counter cookie and the abtest cookie, both of which will be -1 or 0 if they're not set, and it decides what should be displayed for the user as well as inserts whatever needs to be inserted into the database.
In the preceding code snippet, we can see that the calls to the two functions that we've just looked at are highlighted in the code listing.
Also, here we define a function that looks for the abtest cookie and, if it's found, we mark it as having succeeded, shown as follows:
(defn mark-succeed []
  (let [ab-code (get-abcode-cookie)]
    (when (> ab-code -1)
      (db/mark-succeed ab-code))))
Finally, once the experiment is over, we need to perform the analysis that determines whether the control page performed better or the test page:
(defn perform-test
  ([ab-testing] (perform-test ab-testing 0.05))
  ([ab-testing p]
   (let [groups (group-by-group ab-testing)
         t (-> (s/t-test (to-flags (:test groups))
                         :y (to-flags (:control groups))
                         :alternative :less)
             (select-keys [:p-value :t-stat
                           :x-mean :y-mean :n1 :n2])
             (set/rename-keys {:x-mean :test-p,
                               :y-mean :control-p,
                               :n1 :test-n,
                               :n2 :control-n}))]
     (assoc t
            :p-target p
            :significant (<= (:p-value t) p)))))
To perform the actual analysis, we use the t-test function from incanter.stats in the Incanter library (http://incanter.org/). We'll get into this analysis in more detail later in the chapter. For now, let's just pay attention to how the data flows through this function. The t-test function returns a map that contains a lot of numbers. For the output, we need to select some of this information and rename the keys for some of the data that we will use. We use the core select-keys function to select only the information that we need, and we use clojure.set/rename-keys to give the rest of the names that will fit our current domain in a better manner.
To the results of the analysis, we'll also add a couple of other pieces of data. One will be the alpha value, that is, the target value for p that we're trying to improve upon. The other depends on whether the results are significant or not. This is found by testing the value of p against the significance level that we're trying for.
With the low-level and high-level interfaces to the A/B testing process in place, we can turn our attention to actually using it. First, we need to update the view template for the home page from what we listed in the preceding snippet.
Remember, the file is in src/web_ab/views/templates/home.html. We want to simply change the name of the link to go to the purchase page. It needs to be a parameter that we can use to insert a value into the template. For instance, the following snippet contains the updated version of the right-hand panel, including the highlighted line that we can use to insert the text into the page:
  <div id="right-panel" class="col-md-6 jumbotron">
    <a href="/purchase/" id="btn-more"
       class="btn btn-primary btn-lg center-block">
      {{button}}
    </a>
  </div>
The controllers will also need to change. They need to trigger the appropriate stages in the test participant's lifecycle, and they need to pass the button text into the template.
The controller for the home page does this as part of one form. It calls start-test, and builds the template parameters using its output directly. This addition to the controller is highlighted as follows:
(defn home-page []
  (layout/render
    "home.html"
    {:button (ab/start-test :visits default-button test-cases)}))
The controller for the purchase page just incorporates a call to mark-succeed in its normal flow:
(defn purchase-page []
  (ab/mark-succeed)
  (layout/render "purchase.html" {}))
At this point, everything is in place to actually conduct the test; however, we cannot tell when it's over or look at the results. We can add this section of the website in the next stage.
We'll add the A/B test result's views as separate pages in a separate section of the site. It will use the same abtracking model as the rest of the A/B testing, but we'll define more controllers and views.
One of the primary features of this part of the site is that we don't want to display some information before the test is complete. In order to decide this, we'll first define a map that specifies how many observations from each group we need:
(def target-counts {:control 1200, :test 1200})We can use these values to define a predicate that tests whether enough participants have been registered in order to call the experiment complete. It reads the participants from the database and categorizes them by the experiment group. It compares the counts of these groups to the target counts:
(defn is-over?
  ([] (is-over? (ab/get-ab-tracking)))
  ([ab-tracking]
   (let [{:keys [control test]} (ab/group-by-group ab-tracking)]
     (and (>= (count control) (:control target-counts))
          (>= (count test) (:test target-counts))))))
We can use this to go a step further. We'll define a function that takes the list of rows from the abtracking table and a function that renders a page. It tests whether the experiment has been performed. If it is complete, it passes the on processing to that function. If it's not, it displays a standard page that informs the user that the experiment has not been completed yet:
(defn when-is-over [ab-tracking f]
  (if (is-over? ab-tracking)
    (f ab-tracking)
    (let [{:keys [control test]} (ab/group-by-group ab-tracking)]
      (layout/render
        "ab-testing-not-done.html"
        {:counts {:control (count control)
                  :test (count test)}
         :targets target-counts
         :complete {:control (ab/pct (count control)
                                     (:control target-counts))
                    :test (ab/pct (count test)
                                  (:test target-counts))}}))))
Now, with these utilities in place, we can define a couple of pages. The first one will list the participants from the abtracking table. You can find the controller function and the view template in the code download. Both are relatively straightforward.
The other is slightly more interesting for a couple of reasons. First, it uses the when-is-over function that we just saw, and second, it performs the statistical test to determine whether the control page performed better or the test page:
(defn grid []
  (when-is-over
    (ab/get-ab-tracking)
    (fn [ab-tracking]
      (let [by-group-outcome (ab/assoc-grid-totals
                               (ab/get-results-grid ab-tracking))
            stats (ab/perform-test ab-tracking 0.05)]
        (layout/render "ab-testing-grid.html"
                       {:grid by-group-outcome,
                        :stats (sort (seq stats))
                        :significant (:significant stats)})))))
As mentioned, this function uses the when-is-over function that we just defined in order to bypass this page and display a standard page that just says that the experiment has not been finished yet.
The statistical test, which is highlighted, calls the perform-test function that we talked about earlier.
The template for these primarily displays the results in a grid. It also has a colored alert at the top of the page, which indicates whether the control performed better or the test groups.
Now that all the parts are together, let's walk through the user's interaction with the site. Most people who visit your site won't know that there are two different versions of the site, so they should interact with your site as they normally would.
When they first visit your site, users should see the following screen. The text on the button in the lower-right section might be different, but the rest should be the same for everyone.
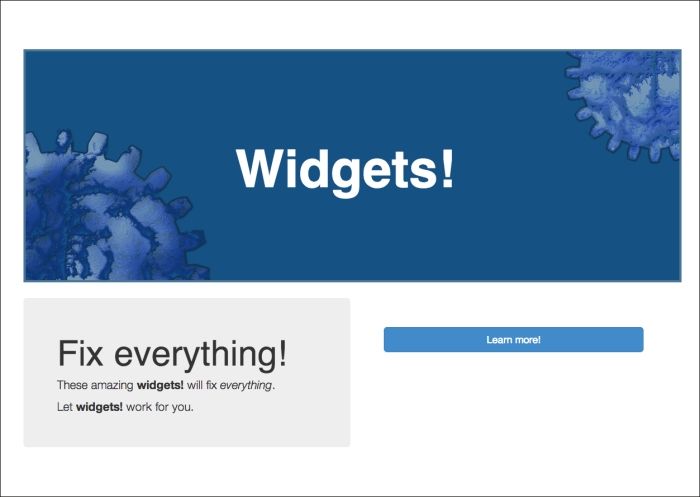
Once the user clicks on Learn more! (in this case), they complete the purchase, and all the users should see the following page:

However, the more interesting part of this isn't what happens with the user but what happens afterwards when we can look at and analyze the results. We'll see some details about this in the next section.
Obviously, we're not going to be able to get a few thousand people to visit our website and purchase the widgets. In place of actual participants, I've populated the database with random data. This should allow us to see how the analysis section of the website works and what it means.
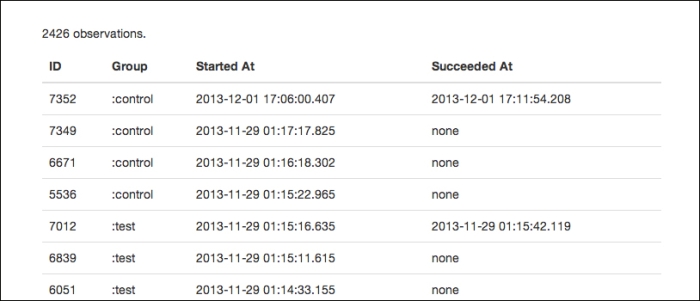
Throughout the experiment, we can get a list of the participants by visiting http://localhost:3000/ab-testing/ on the local development server. This allows us to track the experiment's progress without really getting into the results and without having direct access to the counts.
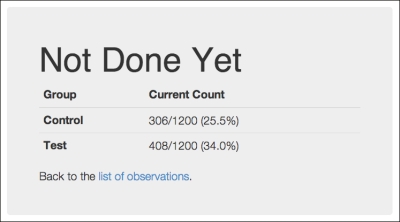
While the experiment is running, we don't really want to get more information than this page displays. This is where the when-is-over function, which we previously saw, comes into play. When we visited the page earlier, we had sufficient participants in the experiment, and then we got a page that explained that the experiment was not done and gave some indication as to how much longer it has to go on for.
For example, the following screenshot has about all the information we want to provide at this point in the experiment:
Of course, once the experiment is complete, we'd like to be able to see the final results, including whether the results allow us to reject the null hypothesis, that is, whether the test group performed better than the control group in a statistically significant way or not.
So when the experiment is complete, we get the following page:
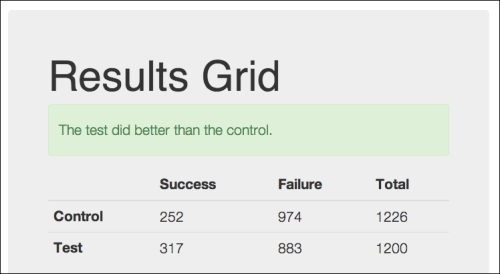
There's more information included on this page. The following is a table that contains the rest of the data and a short explanation of what they are. We'll go into more detail on them in the next section, where we talk about the t-test.
|
Name |
Value |
Explanation |
|---|---|---|
|
:control-mean |
252 |
The average of the control group. |
|
:control-n |
1226 |
The number of observations in the control group. |
|
:control-p |
0.20555 |
The conversion rate of the control group. |
|
:control-variance |
200.20228 |
The variance for the control group. |
|
:df |
2401.10865 |
The degrees of freedom. |
|
:p-target |
0.05 |
The alpha value for the test: the maximum p-value for the test. |
|
:p-value |
0.00000 |
The actual p value for the t-test. |
|
:se |
0.59806 |
The standard error. |
|
:significant |
TRUE |
Checking whether the results statistically significant |
|
:t-value |
108.68414 |
The results of the t-test. |
|
:test-mean |
317.00000 |
The mean of the test group. |
|
:test-n |
1200 |
The number of observations in the test group. |
|
:test-p |
0.26417 |
The conversion rate of the test group. |
|
:test-variance |
233.25917 |
The variance for the test group. |
These values are given in another table further down the page in the preceding screenshot. To understand the statistical values in a better manner, let's dig more into exactly what test we used.
First, we need to understand the statistical nature of the test that we're performing.
Fundamentally, the experiment is pretty simple; each observation has one of two outcomes. In many ways, this is a series of coin flips. Each flip can be heads or tails. Each site interaction can succeed or fail.
This kind of value is known as a binomial random variable. It can take one of two values, which vary according to a set probability. Binomial random variables have a number of assumptions that must be met:
- There are a fixed number of observations (n).
- Each observation will have one of the two possible outcomes.
- The n observations are independent, that is, the outcome of one observation does not in any way influence the probability of any other observation.
- The probability of the outcomes stays constant over time, that is, the probability of the outcome X (P(X)) will always be, say, 0.5. You can easily violate that in the design of the experiment by running the control page and the test page consecutively instead of running them simultaneously. If they're not run together, one page could be used during a busier time to get better results.
A common example of a binomial random variable is testing coin tosses. Let's use this as a first example, and then we'll apply what we've learned to our A/B test.
Specifically, we'll have a coin that we know is fair and we'll test another coin that we suspect is biased against it. The null hypothesis is that there is no difference between the two coins and that both are true.
The following steps show us how this experiment will fulfill the assumptions of a binomial test:
- We'll flip each coin 100 times.
- Each coin toss (each observation) can be heads or tails.
- Each coin toss is independent. Its probability isn't influenced by the probability of any other coin toss.
- The probability of heads or tails won't change over time. The probability of heads (P(heads)) and the probability of tails (P(tails)) will be 0.5 during the entire test, or for the true coin, at least.
First, let's think about what will happen when we flip the true coin. We know that P(heads) = 0.5. Theoretically, every time we flip the coin for 100 times, we expect to get 50 heads and 50 tails. Of course, that isn't what happens in real life. Sometimes, we'll get 57 heads and 43 tails. Sometimes, we may get 44 heads and 56 tails. In extremely rare cases, we may get 100 heads and no tails. The distribution of coin tosses will form a binomial distribution, which is the number of successes in a series of yes/no experiments; however, as the number of coin tosses approaches infinity, the probability of all of these cases can be approximated by a normal distribution around the theoretical, expected probability of 50 heads and 50 tails.
For this experiment, let's say that we flipped a true coin 100 times, and we get heads 53 times.
Now, let's think about what will happen when we flip the other coin. It may be true, or it may be biased. If it is biased, we don't know it's biased by how much. So, when we flip it 100 times, and we get heads 58 times, we don't know if it's because P(heads) = 0.58 or because P(heads) = 0.5, P(heads) = 0.6, or something else, and we're slightly off this result on a normal distribution.
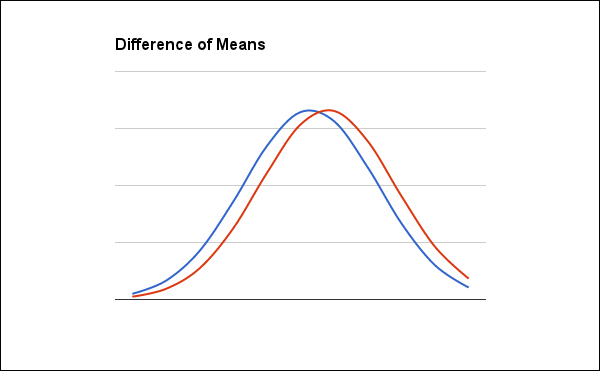
So we're interested in two things here. Primarily, we're interested in the difference between the two probabilities. Or, to express it in terms of the experiment, we're interested in the difference of means. We want to know whether the difference between 0.53 and 0.58 (0.05) is significant. The following graph illustrates the relationship that we're looking at in a continuous form. The actual data here is discrete, of course, but the continuous graph makes the relationship a little more clear.
The expected number of successes of a binomial random variable is given by the following formula:
The Clojure code for the sample mean of a binomial variable is similarly straightforward:
(defn binomial-mean [coll] (reduce + 0.0 coll))
So, for the control group (the known true coins), the mean is 53, and for the test group (the possibly biased coins), it's 58.
In order to answer whether the difference is significant, we also have to be interested in something else: the possibility that we're wrong. We can assume that the actual means are somewhat different than the actual numbers we're dealing with, but how far off are they?
To answer this, we need to be able to calculate the standard error for our figures. Given a normal distribution, what's the probability that the figures are so far off that they'd give us the wrong result? To be able to answer this, we need to know something about how much variance the distribution has, that is, how wide the curve of the distribution's graph is.
Like the mean, the variance for a binomial random variable is pretty simple.
The Clojure function for this is a little more complicated, but it's still clear:
(defn binomial-variance [coll]
  (let [n (count coll),
        p (/ (count (remove zero? coll)) n)]
    (* n p (- 1.0 p))))
This gives us variances of 24.91 and 24.36.
With the variance, we can calculate the standard error of the difference. This is an estimate of the standard deviation of all sample means, and it gives us some idea of how far off our means might be, given how variable the data is and how much data we're looking at. The following is the formula for that:
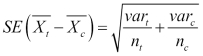
The standard error function in Clojure is as follows:
(defn binomial-se [coll-t coll-c]
  (Math/sqrt (+ (/ (binomial-variance coll-t) (count coll-t))
                (/ (binomial-variance coll-c) (count coll-c)))))
For the coin flipping experiment, our standard error is 0.702.
We finally get to the t-value. This measures the difference between the means, scaled by how variable the groups are.

Like the formula, the Clojure function for this builds upon all of the functions that we've just defined:
(defn binomial-t-test [coll-t coll-c]
  (/ (- (binomial-mean coll-t) (binomial-mean coll-c))
     (binomial-se coll-t coll-c)))
So the t-value of our coin flipping experiment is 7.123.
The output values of this formula follow a t distribution. This is very similar to a normal distribution, but the peak is smaller and the tails are heavier. However, as the degrees of freedom grow, it comes closer to a normal distribution. You can use the cumulative density function for the t-distribution or look in a table for the p value of this number.
We'll use Incanter's cumulative distribution functions to look up the probabilities of the particular t-values. In order to calculate this, we need to calculate the degrees of freedom for the test. When the variances of both the groups are equal, the formula is simple. However, for this, that will rarely be the case. For unequal variances, we'll use the Welch-Satterthwaite equation. It's a bit complicated, but it's what we have to work with.
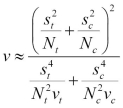
In this equation, s² is the variation, N is the sample size, and v is N-1.
The Clojure code for this is only slightly less complicated:
(defn degrees-of-freedom [coll-t coll-c]
  (let [var-t (binomial-variance coll-t), n-t (count coll-t),
        var-c (binomial-variance coll-c), n-c (count coll-c)]
    (/ (Math/pow (+ (/ var-t n-t) (/ var-c n-c)) 2)
       (+ (/ (* var-t var-t) (* n-t n-t (dec n-t)))
          (/ (* var-c var-c) (* n-c n-c (dec n-c)))))))
Now, from REPL, we can test to see whether the coin toss test can reject the null hypothesis, that is, whether the second coin is biased:
user=> (require '[web-ab.ab-testing :as ab])
nil
user=> (require '[incanter.stats :as s])
nil
user=> (def group-c (take 100 (concat (repeat 53 1) (repeat 0))))
#'user/group-c
user=> (def group-t (take 100 (concat (repeat 58 1) (repeat 0))))
#'user/group-t
user=> (s/cdf-t (ab/binomial-t-test group-t group-c)
                :df (ab/degrees-of-freedom t c))
9.553337936305223E-12
So we can see that in the case of the coin flips, the coin is in fact biased and significantly so.
Let's take this same process and apply it again to the A/B test that we just conducted. This will help us see where the statistics in the preceding table came from:
- First, we'll create the data sets by taking the number of observations and successes from each group:
user=> (def c (take 1226 (concat (repeat 252 1.0)
                                 (repeat 0.0))))
#'user/c
user=> (def t (take 1200 (concat (repeat 317 1.0)
                                 (repeat 0.0))))
#'user/t
- Now, we can compute the mean and variance for each group:
user=> (ab/binomial-mean t)
317.0
user=> (ab/binomial-variance t)
233.25916666666666
user=> (ab/binomial-mean c)
252.0
user=> (ab/binomial-variance c)
200.20228384991844
- This allows us to find the standard error:
user=> (ab/binomial-se t c)
0.5980633502426848
- Finally, we can get the t-value, degrees of freedom, and the p-value.
user=> (ab/binomial-t-test t c)
108.68413851747313
user=> (ab/degrees-of-freedom t c)
2401.108650831878
user=> (s/cdf-t *2 :df *1)
1.0
This gives us the probability that the test results did not occur randomly. We're looking for them to be over 0.95, and they clearly are.
If this data occurred naturally, the very high p value makes us suspect that we may have a type one error or a false positive. However, in this case, the data wasn't generated completely randomly. In the code download, I've combined all of these into one function that gets called to perform the statistical test. This is what is used to generate the data for the table on the results page.