
Now that we can capture sensor data and get it remotely, how about generating graphs over the time to identify patterns and trends in sensor data? As BeagleBone is complete Linux system and has many database alternatives, sensor data can be stored locally and can be analyzed. But this needs a database and some other software set up. There are many free cloud services that provide this service for free for small data, for example Xively, ThingSpeak, Carriots, GroveStreams, and so on. These services collect, store, analyze, visualize, and allow you to share sensor data. Often they allow us to automate action based on data. All we need to do is store data on these severs periodically and view the graph on their website.
Let's use a popular IoT service, ThingSpeak, to visualize temperature data collected by our BeagleBone. ThingSpeak provides REST APIs. It collects sensor data sent through HTTP queries and graphs them in real time. This needs a ThingSpeak account. Visit the website https://thingspeak.com/users/sign_up and create a new account. ThingSpeak calls a data stream from one sensor as a field. Multiple fields form one channel. Each channel has a read and write API key. These keys provide access to get/set data on a channel. You need a write key to update data. Create a new channel with any name and description. Go to the API Keys tab and note down the Write API Key for that channel.
Attach TMP36 like we did in Chapter 5, Reading from Analog Sensors. Create a new file with the name thingspeak_temperature.py inside the Cloud9 IDE and write the following code in it. Change the API key in the program with the write API key you noted down earlier and run the program. The code for thingspeak_temperature.py is as follows:
#!/bin/env python
import Adafruit_BBIO.ADC as ADC
import httplib, urllib
import time
tmp36 = 'P9_40'
update_interval = 20
my_key = 'XXXXXXXXXXXXXXXX' ##Put your api key here
ADC.setup()
while True:
volts = ADC.read(tmp36)* 1.8
temperature = (volts * 100) - 50
print " Current Temperature is " + str(temperature)
params = urllib.urlencode({'field1' : temperature,'key': my_key})
headers = {"Content-type" : "application/x-www-form-urlencoded","Accept" : "text/plain"}
conn = httplib.HTTPConnection("api.thingspeak.com:80")
conn.request("POST", "/update", params, headers)
response = conn.getresponse()
print response.status, response.reason
conn.close()
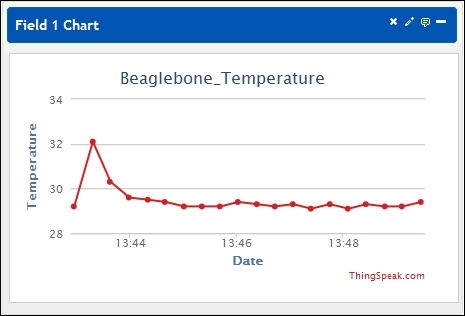
time.sleep(update_interval)Visit the link https://thingspeak.com/channels OR click on the button Channels | My Channels in the website to see your channels. Select the channel whose API key you used in the program. You should be able to see chart like this. This chart is customizable. You can do so by clicking the button on the upper-right side of the chart. You can set the minimum/maximum value to be considered. You can specify how many values it should show in the chart and so on:
You can post this chart on your blog/website embedding code provided when you click on one of the upper-right buttons of the chart. You can share this chart by making your channel public. You can also link your Twitter account to send tweets based on data. ThingSpeak has an integrated MATLAB engine. You can do further mathematical analysis of data using MATLAB code.
If you look at the total code, you can guess easily that this code is making an HTTP request. We are making a POST request to RESTful api.thingspeak.com:80/update with the content inside being api key and temperature data. ThingSpeak also allows you to import/export data in Comma Separated Values (CSV) format.
We included httplib and urllib modules to create a custom HTTP request. We did our temperature reading first like we did in Chapter 8, Physical computing in Python to print temperature. Then we created a custom HTTP header and parameter. We called a
POST request on api.thingspeak.com:80/update with the header and parameters we just created. Then we collected response status code and status information. If everything gets executed correctly, the server sends the response 200 OK. If there is an error, the server will send the error status.