
Geographic data tends to be heterogeneous. Just to cite a few factors that contribute to this heterogeneity, it may come from different sources, have been produced at different times, or even have different languages. Given this fact, writing programs that can combine multiple sources of data is a fundamental topic in geoprocessing.
Data sources may come in different formats, such as shapefiles, text files, Google KML files, GPX files from GPS, and so on. They may also vary in their contents; for example, they may have different types of geometries, coordinate systems, and attributes.
In this chapter, we will enhance our application by adding the capability to combine multiple sources of data from both different sites and different file formats. In order to achieve this, we will write code capable of identifying the type of data, and depending on this, we will make transformations to obtain a homogeneous set of data.
By extending OGR capabilities and including our own functions, we can represent the data in Python classes and add some smart capabilities to them that would make the process of combining many sources very easy for this application and others.
In order to achieve these objectives, we will cover the following topics in this chapter:
- The structure of geographic data files
- How geometries are represented
- How to transform data into Python objects
- How to combine multiple sources of data
- Using class inheritance in Python to write better code
Most file formats that contain geographic data are made of a common simple structure consisting of a number of features, each containing a geometry and innumerous named properties.
Here, you can take a look at a sample of the contents of a GeoJSON file. This type of geographic file has the advantage of being human readable, allowing us to see exactly the structure that is being described. You don't need to type this example; just take a good look at it.
Its structure is very similar to a Python dictionary. At the uppermost level, there is FeatureCollection, which contains a list of features. Each feature has a geometry, whose type may vary, and a dictionary of properties that may contain any arbitrary property defined by the user. In brief, it follows exactly the described schema of data representation as shown in the following code:
{"type": "FeatureCollection",
 "features": [
    {"type": "Feature",
      "geometry": {
        "type": "Point",
        "coordinates": [102.0, 0.5]},
      "properties": {"prop0": "value0"}
    },
    {"type": "Feature",
      "geometry": {
        "type": "LineString",
        "coordinates": [[102.0, 0.0], [103.0, 1.0], [104.0, 0.0]]
      },
      "properties": {
        "prop0": "value0",
        "prop1": 0.0
      }
    },
    {"type": "Feature",
      "geometry": {
        "type": "Polygon",
        "coordinates": [
          [ [100.0, 0.0], [101.0, 0.0], [101.0, 1.0],
            [100.0, 1.0], [100.0, 0.0] ]
        ]
      },
      "properties": {
        "prop0": "value0",
        "prop1": {"this": "that"}
      }
    }
  ]
}
JSON stands for JavaScript Object Notation and is a format that can be easily read and written in a number of programming languages. Specifically in Python, a JSON object can be transformed into a dictionary and vice versa.
There a number of other formats that implement the same structure; some of them add extra functionality and some have characteristics that are very specific for a given purpose.
For example, the ESRI shapefile has indexing capabilities, the GPX format is made to work with GPS devices to store waypoints and tracks, and SpatiLite is a single file spatial database at the top of SQLite that allows objects to have relations with each other.
In the following table, there are some common file formats and a brief description of each:
|
Format |
Description |
|---|---|
|
Cartesian coordinate system |
This is a simple point cloud. |
|
Digital Line Graph (DLG) |
This is a USGS format for vector data. |
|
Geography Markup Language |
This is an XML-based open standard (by OpenGIS) for GIS data exchange. |
|
GeoJSON |
This is a lightweight format based on JSON and is used by many open source GIS packages. |
|
Spatialite |
This is a spatial extension to SQLite that provides vector geodatabase functionality. It is similar to PostGIS, Oracle Spatial, and SQL Server with spatial extensions. |
|
Shapefile |
This is a popular vector data GIS format developed by Esri. |
As we saw before, in geographic data, each feature contains a geometry. A geometry is the spatial representation of a given object. For example, a point can represent a tree, a place of interest, or, as in our case, a geocache. A line can be a road, a river, and so on. Countries, cities, states, or any other type of areas can be represented by polygons.
In this book, we will follow the geometry representation described by the simple features specifications standardized in ISO 19125. It consists of two-dimensional geographic data made of points, lines, polygons, and aggregations or collections of them, as shown in the following image:
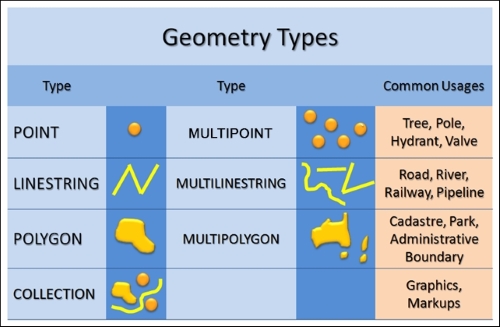
Any geometry in this format is represented by points and a linear interpolation between them. An example of this would be two points that form a line.
This type of geometry is simple, very common, and easy to use. Nevertheless, there are noticeable flaws, and the most important one is the lack of topological representation.
For example, we may have two features representing two neighbor countries—for example, Canada and USA. For each feature (that is, each country) there is a polygon representing the whole limit of the country. By consequence, the borders shared by the two countries will overlap.
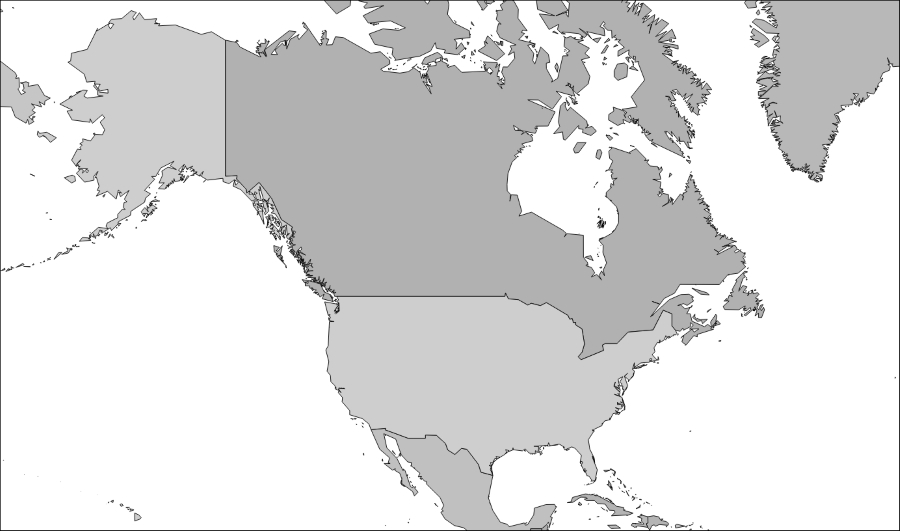
Now, think about the states in the USA and the provinces of Canada; each will be a polygon, their borders will also overlap, and they will, in turn, overlap the countries' borders. So, we will end up with the following:
- States/provinces
- Country border
- Other country border
- Other states/provinces
This makes four overlapping lines; if we want to represent cities, districts, and so on, the number of overlapping geometries would increase. With this, we would have a higher probability of errors and require more space for storage.
This is why this type of geometry representation is also called spaghetti data; it ends with a juxtaposition of a lot of lines (similar to spaghetti).
This flaw can be solved through the topological representation of the geometries. The big difference is that, in this example, it wouldn't store polygons; it would store the relationships between objects. You have a set of boundaries that relate to each other and represent an area, and two areas can have the same boundary. OpenStreetMap is a good example of a topological representation of geographic features.
Although topological representation is more advanced, it is much harder to work with, and the vast majority of geographic analysis can be done with a simple representation.