
In this chapter, we will start a new application and use it to produce nice maps from vector data.
In order to produce these maps, we will use Mapnik, one of the world's most used mapping packages. The objective is to understand how it works and adapt it to make an easy-to-use mapping application.
In the previous chapters, we produced some very functional classes that abstract geographic data; we will make this app capable of consuming this type of data.
We will cover the following topics:
- Getting to know Mapnik and see how it works
- Seeing the differences between pure Python and XML when defining a map
- Experimenting with different styles
- Using Python objects as a source of data for Mapnik
- Abstracting Mapnik into a high-level application
Mapnik is the tool that we will use to produce our maps. It's a very powerful mapping library used by many websites.
In this first topic, we will go through some experiments to get to know Mapnik's features.
Now we will perform a few experiments with Mapnik in order to know how it works. First, let's organize the code for this chapter:
- Inside your
geopyproject, copy theChapter4folder and rename it toChapter5. - Inside the
Chapter5folder, create a new folder namedmapnik_experiments. To do that, right-click in yourChapter5folder and choose New | Directory. - Still in
Chapter5, create another folder namedoutput; we will place the maps and images we create into that folder.
Mapnik has two ways to define a map; one uses pure Python code, the other an XML file.
Mapnik's Python API is very extensive and wraps almost all of the package's functionalities. In the next steps we will experiment with making a map with Python code only.
- Inside
mapnik_experiments,mapnik_python.py. - Type the following code into
mapnik_python.py:# coding=utf-8 import mapnik # Create a Map map = mapnik.Map(800, 600) # Set the background color of the map. map.background = mapnik.Color('white') # Create a Style and a Rule. style = mapnik.Style() rule = mapnik.Rule() # Create a PolygonSymbolizer to fill the polygons and # add it to the rule. polygon_symbolizer = mapnik.PolygonSymbolizer( mapnik.Color('#f2eff9')) rule.symbols.append(polygon_symbolizer) # Create a LineSymbolizer to style the polygons borders and # add it to the rule. line_symbolizer = mapnik.LineSymbolizer( mapnik.Color('rgb(50%,50%,50%)'), 0.1) rule.symbols.append(line_symbolizer) # Add the rule to the style. style.rules.append(rule) # Add the Style to the Map. map.append_style('My Style', style) # Create a data source from a shapefile. data = mapnik.Shapefile(file='../../data/world_borders_simple.shp') # Create a layer giving it the name 'world'. layer = mapnik.Layer('world') # Set the layer data source and add the style to the layer. layer.datasource = data layer.styles.append('My Style') # Add the layer to the map. map.layers.append(layer) # Zoom the map to the extent of all layers. map.zoom_all() # Write the map to a image. mapnik.render_to_file(map,'../output/world.png', 'png') - Now run the code; press Alt + Shift + F10 and select
mapnik_python. - There should be a new file named
world.pnginside youroutputfolder. You can view this image in PyCharm; just double-click it. You should see this: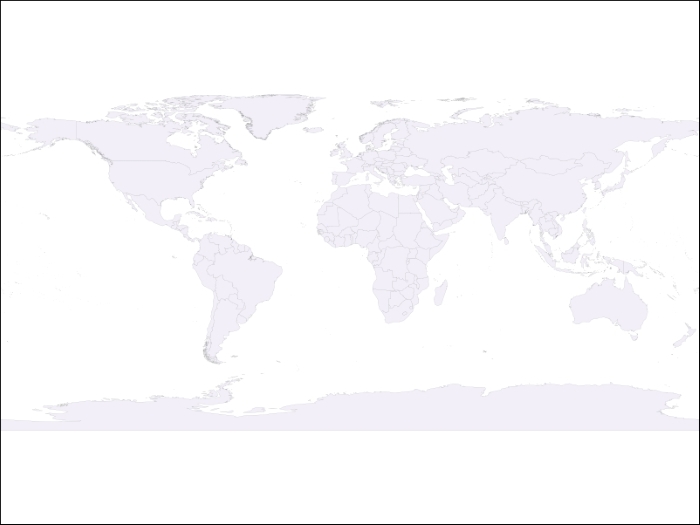
Congratulations on creating this first beautiful map; note the superior quality of this rendering and how quickly Mapnik does its job.
Instead of using only Python code, the map styles, layers, and other definitions can be put inside an XML file. Let's try this:
- Inside the
mapnik_experimentsfolder, create a new file namedmap_style.xml. - Type the following code:
<Map background-color="white">
  <Style name="My Style">
    <Rule>
      <PolygonSymbolizer fill="#f2eff9" />
      <LineSymbolizer stroke="rgb(50%,50%,50%)" stroke-width="0.1" />
    </Rule>
  </Style>

  <Layer name="world">
      <StyleName>My Style</StyleName>
      <Datasource>
          <Parameter name="file">
                ../../data/world_borders_simple.shp
            </Parameter>
          <Parameter name="type">shape</Parameter>
      </Datasource>
  </Layer>
</Map>
This is the style definition of your map. Although PyCharm is a Python IDE, it's also capable of recognizing a lot of file types including XML; it should help you with the tags and should apply a nice coloring to the code.
Now you need the Python code to generate this map:
- Create a Python file named
mapnik_xml.pyinside themapnik_experimentsfolder and type this code:# coding=utf-8 import mapnik map = mapnik.Map(800, 600) mapnik.load_map(map, 'map_style.xml') map.zoom_all() mapnik.render_to_file(map, '../output/world2.png')
- Run this file. Remember that, to run a different file from the previous one, you need to press Alt + Shift + F10 and select it.
- Open the generated image (
world2.png) that is inside theoutputfolder; you should see exactly the same result as before.
Styling maps in Python and XML has almost the same features. Except for a few very specific situations, you can obtain exactly the same results using either of them.
In those simple examples, there are two things to be noticed while using Python or XML: code readability and organization. Looking at the XML code, you should see that the map, styles, and rules have a tree-like organization; this is very clear here but in the pure Python definition this get confusing and can lead to mistakes.
This is a very simple map but, as you add more rules and symbolizers, things starts to get very confusing and hard to understand using pure Python.
Another important point is that it's a good idea to separate the map creation logic from the style. We will see how that helps to keep your code very clean and reusable in the next topic.