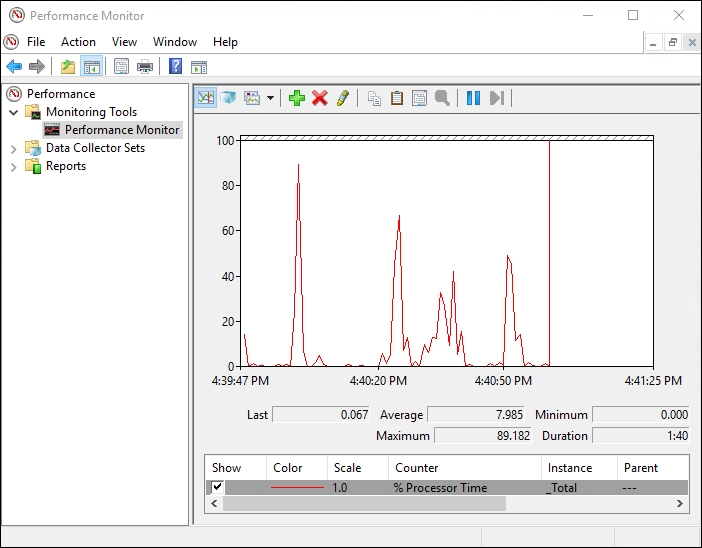
While good old Task Manager and the new Resource Monitor are great utilities for monitoring system performance in real time, for any more extensive monitoring needs I tend to prefer Performance Monitor. Perfmon, as it is often nicknamed, is an excellent tool that can be used for collecting specific data over a predefined period of time.
We have all had cases where a report comes across our desk that a certain server is misbehaving or running slowly. By the time we get logged in, everything looks normal. Other than Event Viewer, we don't have a whole lot of options for investigating what was happening during the time of the problem. But it might happen again, and if we plan ahead with the Performance Monitor tool, we might be able to catch the server in the act, even if we don't see the data until after the event has finished.
We will be monitoring a Windows Server 2016 server in our environment for this recipe. Nothing needs to be installed, as Performance Monitor is part of Windows by default.
In order to collect server performance data using Performance Monitor, follow these steps:
- Open up a command prompt or your Run box and type
perfmon. This will launch the Performance Monitor tool.
- From the left window pane, navigate to Monitoring Tools | Performance Monitor. You can see that it shows some real-time data about the processor by default.

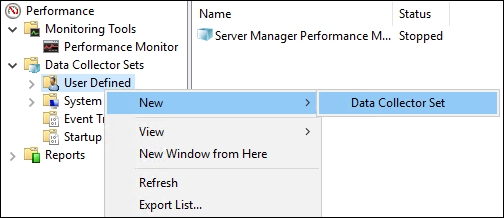
- Browse to Data Collector Sets | User Defined. Right-click on this folder and choose New | Data Collector Set.

- For my evaluation on this server, I am going to add the following counters:
- Click the Add… button in order to add some performance counters that we want to keep track of on this server.
- Check the box for Performance counter and click Next.
- Name your new Data Collector Set and choose the bottom radio button entitled Create manually (Advanced). Then click Next.
- Processor | % Processor Time: This will tell us how busy the CPU is.
- Memory | Available MBytes: This will tell us how much RAM is available.
- Memory | Page Writes/sec: This will tell us how often Windows looks to the paging file in order to create virtual memory, which helps to indicate whether or not the system is running out of physical memory.
- As you can see, there are so many different counters that you can add. We are only interested in these three, and so we can click on the OK button.

- Back in our wizard for setting up the new Data Collector set, we should see our three counters now listed. Go ahead and click Next.
- Change where you would like the data saved, if necessary. Then click Next.
- On the last screen of the wizard, choose the radio button for Open properties for this data collector set. Then click the Finish button.
- Navigate over to the Schedule tab and click the Add button to set your preferred time in the Start time field for these performance counters to be collected.
- Once you have set a start time, you can either plan to stop the data collection manually, or you can use the Stop Condition tab in order to stop the collection after a predetermined amount of time. Using a combination of the Schedule and Stop Condition tabs is a great way to collect data for a specific time range, such as one day.

- Now that we have some data that has been collected, head down to Reports | User Defined in order to see the data that was stored during the time period that we specified.

Performance Monitor is a great tool for collecting hardware and server performance data. The ability to be very granular in identifying which resources you want to monitor is extremely helpful. Combine that with scheduling capabilities for collection times and you have a recipe for successful server monitoring. It can also be useful to run a Performance Monitor data set as a baseline after installing a new server. This way you can hold onto that report and compare it against later similar reports when the user load increases, to look back and find out what kind of an impact certain services or users have on a system.
