
In this more advanced trading strategy, we are going to create a long signal when the price reaches the highest price for the last window_size days (in this example, we will choose 50):
- We will create a short signal when the price reaches its lowest point. We will get out of a position by having the price crossing the moving average of the last window_size days. This code starts the turtle_trading function by creating a column to store the highs, the lows, and the average with a rolling window window_size:
def turtle_trading(financial_data, window_size):
     signals = pd.DataFrame(index=financial_data.index)
     signals['orders'] = 0
     # window_size-days high
     signals['high'] = financial_data['Adj Close'].shift(1).
         rolling(window=window_size).max()
     # window_size-days low
     signals['low'] = financial_data['Adj Close'].shift(1).
         rolling(window=window_size).min()
     # window_size-days mean
     signals['avg'] = financial_data['Adj Close'].shift(1).
         rolling(window=window_size).mean()
- We will write the code that creates two new columns specifying the rules to place an order:
- The entry rule is stock price > the highest value for the window_size day.
- Stock price < the lowest value for the window_size day:
     signals['long_entry'] = financial_data['Adj Close'] > signals.high
     signals['short_entry'] = financial_data['Adj Close'] < signals.low
- The exit rule (when placing an order to get out of a position) will be when the stock price crosses the mean of past window_size days:
     signals['long_exit'] = financial_data['Adj Close'] < signals.avg
     signals['short_exit'] = financial_data['Adj Close'] > signals.avg
- To draw the chart representing the orders, as shown in the code, we will give the values 1 when we enter a long position, -1 when we enter a short position, and 0 for not changing anything:
     init=True
     position=0
     for k in range(len(signals)):
         if signals['long_entry'][k] and position==0:
             signals.orders.values[k] = 1
             position=1
         elif signals['short_entry'][k] and position==0:
             signals.orders.values[k] = -1
             position=-1
         elif signals['short_exit'][k] and position>0:
             signals.orders.values[k] = -1
             position = 0
         elif signals['long_exit'][k] and position < 0:
             signals.orders.values[k] = 1
             position = 0
         else:
             signals.orders.values[k] = 0
     return signals
    ts=turtle_trading(goog_data, 50)
The turtle_trading function from the code will display the plot that describes how the strategy behaves:
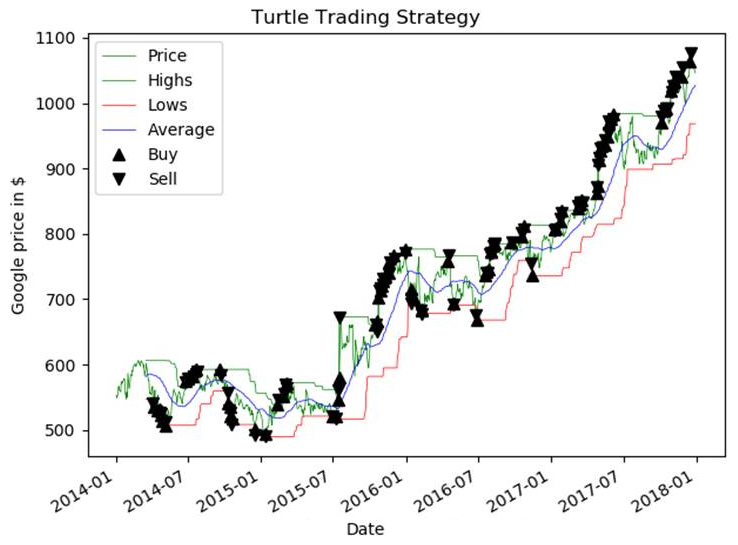
From the plot, the following can be observed:
- The number of orders between the naive momentum strategy and the turtle trading strategy.
- On account of a higher number of orders, this strategy offers more potential of returns than the previous one.