
Backtesting is a key phase to get statistics showing how effective the trading strategy is. As we previously learned, the backtesting relies on the assumption that the past predicts the future. This phase will provide the statistics that you or your company consider important, such as the following:
- Profit and loss (P and L): The money made by the strategy without transaction fees.
- Net profit and loss (net P and L): The money made by the strategy with transaction fees.
- Exposure: The capital invested.
- Number of trades: The number of trades placed during a trading session.
- Annualized return: This is the return for a year of trading.
- Sharpe ratio: The risk-adjusted return. This date is important because it compares the return of the strategy with a risk-free strategy.
While this part will be described in detail later, for this section, we will be interested in testing our strategy with an initial capital over a given period of time.
For the purpose of backtesting, we will have a portfolio (grouping of financial assets such as bonds and stocks) composed of only one type of stock: Google (GOOG). We will start this portfolio with $1,000:
initial_capital = float(1000.0)
Now, we will create a data frame for the positions and the portfolio:
positions = pd.DataFrame(index=goog_data_signal.index).fillna(0.0)
portfolio = pd.DataFrame(index=goog_data_signal.index).fillna(0.0)
Next, we will store the GOOG positions in the following data frame:
positions['GOOG'] = goog_data_signal['signal']
Then, we will store the amount of the GOOG positions for the portfolio in this one:
portfolio['positions'] = (positions.multiply(goog_data_signal['price'], axis=0))
Next, we will calculate the non-invested money (cash):
portfolio['cash'] = initial_capital - (positions.diff().multiply(goog_data_signal['price'], axis=0)).cumsum()
The total investment will be calculated by summing the positions and the cash:
portfolio['total'] = portfolio['positions'] + portfolio['cash']
When we draw the following plot, we can easily establish that our strategy is profitable:
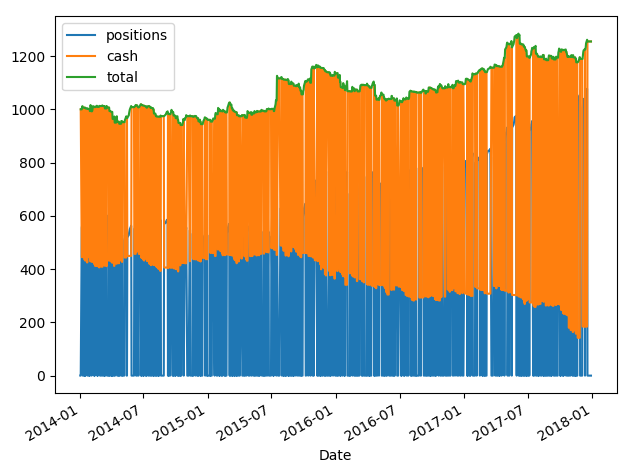
When we create a trading strategy, we have an initial amount of money (cash). We will invest this money (holdings). This holding value is based on the market value of the investment. If we own a stock and the price of this stock increases, the value of the holding will increase. When we decide to sell, we move the value of the holding corresponding to this sale to the cash amount. The sum total of the assets is the sum of the cash and the holdings. The preceding chart shows that the strategy is profitable since the amount of cash increases toward the end. The graph allows you to check whether your trading idea can generate money.