
Chapter 19: Command-Line Interface
This chapter will explore the shell command-line interface (CLI). We will explore some of the most relevant FreeBSD commands to manage the system, networking, and firewalling. We will also learn how to customize some parts of the system and use commands to improve information extraction from logs. At the end of this chapter, you will be capable of running commands on the OPNsense CLI for diagnostics and troubleshooting purposes.
We will explore the following topics:
- Directory structure
- Managing the configd backend daemon
- Useful system commands
- Advanced customization
- Filtering log files
Technical requirements
To follow this chapter, you need to have basic Unix-like shell and filesystem knowledge. A running OPNsense firewall might help try the commands. All commands presented in this chapter are executed as the root user, so pay attention before pressing the Enter key after each command.
Note
Never run the presented commands in production environments without supervision if you don't know exactly what you are doing
Before starting to run CLI commands, let´s first learn more about the OPNsense filesystem.
Directory structure
If you are not familiar with the FreeBSD filesystem layout, I recommend you read this manual page: https://www.freebsd.org/cgi/man.cgi?query=hier&sektion=7. You may find some stimulating directory descriptions on this page, so it is worth reading.
On OPNsense, the most relevant directories reside on the /usr/local path:
root@bluebox:/usr/local # ls
Makefile libdata openssl share
bin etc libexec opnsense var
cloudfence include man sbin wizard
datastore lib www
The subdirectories we will explore inside this path (/usr/local) are as follows:
- /usr/local/etc: This directory contains the configuration files used by OPNsense daemons. Most configuration files generated using the webGUI will reside inside this directory. Occasionally, you might want to check some service's configuration by looking at its configuration file(s).
- /usr/local/www: The legacy webGUI Hypertext Preprocessor (PHP) pages are stored in this directory.
- /usr/local/sbin: OPNsense's binaries, such as the command to sound the boot beep (opnsense-beep) and opnsense-shell, are stored inside this directory, for example.
- /usr/local/opnsense: Inside this directory, we will find the OPNsense Model-View-Controller (MVC) framework, which the webGUI relies on to manage the whole system, for example. The MVC is inside the mvc subdirectory. Other relevant subdirectories inside /usr/local/opnsense are as follows:
- scripts: The auxiliary scripts called by the plugins and other OPNSense framework components are stored inside this directory.
- service/conf/actions.d: Inside this subdirectory are the configuration files used by the configctl command, which manages daemons used by OPNsense. We will explore configctl in a dedicated topic in this chapter.
Other directories on the filesystem's / root that we will mention here are as follows:
- /boot: This is the directory that contains the FreeBSD files used in the bootstrap. You should rarely need to change a file inside it, but on some special occasions in advanced troubleshooting or development, you might need to interact with files inside this directory.
- /conf: This is where the OPNsense configuration file resides. The config.xml file is the webGUI's generated Extensible Markup Language (XML) configuration file.
- /var: Some daemons store variable information inside this directory. If you need to check some daemon's temporary information, you will find it inside the /var directory.
- /var/log: This directory is often used while troubleshooting or in a debugging process where the system's log files are stored inside it; I venture to say that it is the most accessed directory in the CLI for this reason.
- /tmp: Last but not least, the system's temporary directory. As the name suggests, this directory is used by the daemon and the operating system to store most temporary information. A specific example in OPNsense is the generated firewall rules stored in a temporary file called rules.debug.
Now that we have a basic map to explore the CLI world, let's move on with OPNsense's backend command.
Note
As OPNsense supports RAM disk, and both /var and /tmp directories can be configured using it, all content is recreated after a reboot in these directories.
Managing the backend daemons
The OPNsense architecture is composed of a frontend and a backend. In the next chapter, we will explore OPNsense's architecture to learn how to use its Application Programming Interface (API). For now, let's say that the backend is the part that interacts with the system daemons, and eventually, you may want to change some daemon states by stopping, starting, or restarting using it. The service in charge of interacting with daemon states and also writing its configuration file is configd. To manage the configd service with the CLI, we can use the configctl command:
root@bluebox:/tmp # configctl -h
usage: configd_ctl.py [-h] [-m] [-e] [-d] [-q] [-t T] command [command ...]
positional arguments:
command command(s) to execute
optional arguments:
-h, --help show this help message and exit
-m execute multiple arguments at once
-e use as event handler, execute command on receiving input
-d detach the execution of the command and return immediately
-q run quietly by muting standard output
-t T threshold between events, wait this interval before executing commands,
combine input into single events
Note
The configctl –h output will show configd_ctl.py as the command to run, but you can ignore it and remain using just configctl instead.
The first thing you might check before using the configctl command is whether the configd service is up and running:
root@bluebox:/tmp # service configd status
configd is running as pid 143.
Note
Unix-like systems use a process identification number (PID). This number is not fixed, so the PID of your running OPNsense configd process will probably differ from the preceding example.
OK! It is running, but if for some reason the configd service stops, you can restart it by running the following:
root@bluebox:/tmp # service configd restart
Stopping configd...done
Starting configd.
Now, let's list the available options while using configctl:
root@bluebox:/tmp # configctl configd actions
service reload delay [ ]
service reload all [ ]
webgui restart [ Restart web GUI service ]
unbound dumpcache [ ]
unbound dumpinfra [ ]
unbound stats [ ]
unbound listinsecure [ ]
unbound listlocalzones [ ]
unbound listlocaldata [ ]
...
The list may vary depending on the OPNsense installed plugins. Each plugin may install a configuration file inside the /usr/local/opnsense/service/conf/actions.d/ directory, as we explored in the last section. These files are invoked by the configctl command to execute the listed actions shown by the preceding command.
Some examples of the configctl usage include the following:
- configctl webgui restart: Will restart the webGUI process
- configctl interface list arp: Will list the Address Resolution Protocol (ARP) table
- configctl captiveportal list_clients: Will list the current captive portal's connected users
There are dozens of useful commands you can try using configctl. Take some time and test them on your own!
In the following section, we will explore other useful system commands through the CLI.
Useful system commands
As a Unix-like system, OPNsense has a lot of useful commands. In the following, we will explore some of these commands.
Let's dive into a practical scenario.
Assume that you lost access to the webGUI and want to find which process is using Transmission Control Protocol (TCP) port 443 on OPNsense. We can find running processes with listening ports on FreeBSD using the sockstat command:
root@bluebox:/usr/local/etc # sockstat -4l -p 443
USER COMMAND PID FD PROTO LOCAL ADDRESS FOREIGN ADDRESS
root nginx 7065 5 tcp4 *:443 *:*
In this example, the nginx process is using port 443 (just the IPv4 address specified in the –4l parameter), which caused you to lose webGUI access due to some configuration issue.
Note
We are assuming that you followed the previous chapter, so we might see the nginx process running on port 443 instead of lighttpd (OPNsense's default configuration).
You might want to stop the nginx service and start the webGUI again to solve this problem.
To stop the running process, we can use the service command:
root@bluebox:/usr/local/etc # service nginx stop
Let's now restart the webGUI. As you already learned, you can use configctl to interact with OPNsense daemons, so what we need to do is find the right command:
root@bluebox:/tmp # configctl configd actions | grep -i webgui
webgui restart [ Restart web GUI service ]
Bingo! Now, Let's get the webGUI back up and running:
configctl webgui restart
Confirming that it is back, we see the following:
root@bluebox:/tmp # sockstat -4l -p 443
USER COMMAND PID FD PROTO LOCAL ADDRESS FOREIGN ADDRESS
root lighttpd 87811 5 tcp4 *:443 *:*
Well done! With this, the webGUI will be back online. To solve the port conflict issue, changing the port number on the webGUI or nginx configurations will be necessary. As it was just an example, we will not detail this process here.
If I listed all the examples using my personal experience of possible commands, we would probably need an extra book!
But, let's list some useful commands that you can count on with the OPNsense CLI:
- Network commands:
- List routing table: netstat -nr or configctl interface routes list
- List interfaces: ifconfig -a or configctl interface list ifconfig
Note
Some configctl commands output in JSON format, which can be very confusing to read in the CLI. To help format the JSON output, you can count on the jq utility. You can install it using pkg install jq.
An example of formatting a JSON command output using jq: configctl interface list ifconfig | jq.
- Test connectivity: ping <IP address>
- Trace a route path: traceroute <IP address>
- DNS diagnostics: drill <domain>
- Traffic usage per interface: systat -ifstat -match <network interface name> (for example: igb0)
- Firewall commands:
- System commands:
As you can see, there are a lot of commands that help us to manage our OPNsense on the CLI.
It might sometimes be necessary to customize configuration on OPNsense that you can't do using the webGUI. Still, you must take care while customizing the configuration and avoid doing that outside the webGUI where possible. Proceed with maximum caution!
Advanced customization
The OPNsense webGUI is a powerful configuration tool, and you rarely need to change or customize the OPNsense configuration while using the CLI. Still, it can happen, and it is essential to know which tools we can count on for doing this task.
The config.xml file is the webGUI's generated XML configuration file, it is where the OPNsense configuration file resides.
Customizing the XML configuration file
All configurations generated by webGUI through the OPNsense framework are saved in /conf/config.xml.
Note
Before modifying the config.xml file, always make a backup copy! Editing this file can crash your OPNsense installation, so take caution!
The following is an example where the manual editing of the config.xml file could help.
This is an example showing the substitution of OPNsense hardware. Let's suppose that you need to replace the OPNsense hardware, and the new one uses a different network card, which means changing the Network Interface Card (NIC) name on FreeBSD. If you try to back up the configuration from the old hardware and just restore it on the new one, it might not get the network up and running without a bit of adjustment. Let's see how to change it.
This example shows changing from emX to igbX network cards:
root@bluebox:/conf # grep -E "<if>em[0-9]</if>" config.xml
<if>em1</if>
<if>em2</if>
<if>em0</if>
The preceding command lists the configured network devices inside the config.xml file.
To change it, edit the config.xml file with the vi editor (making a copy before):
cp /conf/config.xml /tmp/config.xml
vi /tmp/config.xml
Inside the file, look for the XML block, for example <if>em1</if>, and change it to the new device name.
We can change it from this:
<interfaces>
<wan>
<if>em1</if>
To this:
<interfaces>
<wan>
<if>igb1</if>
Repeat the preceding steps for each network interface. Now, you can restore the new config.xml file to the new hardware to have the network up and running when it is done.
Note
Always check the XML file syntax before trying to upload it to the OPNsense webGUI to restore it. Several utilities might help to do that. An example is xmllint, which is available on OPNsense.
The root password reset
If you lose or forget the root password, you must reset it to get OPNsense access back. To do that, you need to access the OPNsense console and reboot it. During the boot process, the following steps must be taken to reset the root password:
- Select option 2: Boot Single User:
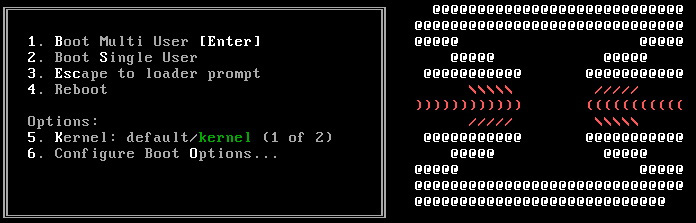
Figure 19.1 – OPNsense boot loader menu
- After the boot process, OPNsense will show the command prompt (in single-user mode), but as this mode mounts the filesystem as read-only, it will be necessary to put it in read-write mode before changing the root password:
/sbin/mount -o rw /
- With the filesystem in read-write mode, now it is possible to change the root password:
/usr/local/sbin/opnsense-shell password
The root user login behavior will be restored to its defaults.
Do you want to proceed? [y/N]: y
Type a new password:
Confirm new password:
The root user has been reset successfully.
- Finally, reboot OPNsense:
/sbin/reboot
After the reboot, you should log in with the newly defined root password.
Filtering log files
As we have explored in this book, one of the most valuable resources for diagnosing issues or troubleshooting is the log files. The log files are always telling the truth and learning about some CLI tools can help us filter data inside the logs and save a lot of time!
In the following, we will explore how to filter logs on OPNsense.
On the CLI, we will change our current directory to the /var/logs path, as we have learned that the logs are stored in this path.
Filtering logs
To have a continuous output of a log file, we can use the tail -f command:
root@bluebox:/var/log # tail -f system/system_`date +%Y%m%d`
Note
The `date +%Y%m%d` command will set the filename to the current date.
grep is one of the most helpful tools to filter data inside log files. We can use it to extract information more clearly:
root@bluebox:/var/log # grep --color -i error system/system_20220305.log
In the preceding example, we filter the word error inside the /var/log/system/system_20220305.log file.
--color colorfully outputs the filtered expression, and -i is for the filter in a case-insensitive case.
Some logs can be trickier than others to filter, for example, while using the nginx plugin with NAXSI rules.
This is an example of an nginx error log file:
022/03/07 00:01:01 [error] 66395#100210: *257649 NAXSI_FMT: ip=203.0.110.100&server=example.cloudfence.com.br&uri=/xmlrpc.php&vers=1.3&total_processed=37547&total_blocked=4900&config=block&cscore0=$LIBINJECTION_XSS&score0=8&zone0=BODY|NAME&id0=18&var_name0=%3C%3Fxml%20version, client: 203.0.110.100, server: example.cloudfence.com.br, request: "POST /xmlrpc.php HTTP/1.1", host: "example.cloudfence.com.br"
This logline can appear non-human readable at first glance, but if you use some CLI tricks, it could help a lot:
head -1 example.com.br.error.log | awk -F'&' '{print "Server: "$2 " Request: " $12 " Match rule ID:" $11 " "}'
Server: server=example.cloudfence.com.br
Request:
var_name0=%3C%3Fxml%20version, client: 203.0.110.100, server: example.cloudfence.com.br, request: "POST /xmlrpc.php HTTP/1.1", host: "example.cloudfence.com.br"
Match rule ID:id0=18
Using the awk command, it is possible to break the line into fields and output a filtered and cleaner output. This is one of many possibilities that we can use CLI filtering logs for. You can change the head –1 parameter to fit the number of lines you want to list.
The command can be explained as follows:
- -F'&': This defines the field delimiter.
- '{print "Server: "$2 " Request: " $12 " Match rule ID:" $11 " "}': This line will print the 2nd, 12th, and 11th fields, considering the & limiter.
Another example is filtering a Squid access.log file with a colorful output depending on the log message:
- For this, we will create a little shell script:
cat > /tmp/colorful-access_log.sh
- Paste these contents to the script file:
tail -f /var/log/squid/access.log | awk '
{matched=0}
/INFO:/ {matched=1; print "�33[0;37m" $0 "�33[0m"} # WHITE
/NOTICE:/ {matched=1; print "�33[0;36m" $0 "�33[0m"} # CYAN
/WARNING:/ {matched=1; print "�33[0;34m" $0 "�33[0m"} # BLUE
/NONE/200/ {matched=1; print "�33[0;34m" $0 "�33[0m"} # BLUE
/ERROR:/ {matched=1; print "�33[0;31m" $0 "�33[0m"} # RED
/TCP_DENIED/ {matched=1; print "�33[0;35m" $0 "�33[0m"} # PURPLE
matched==0 {print "�33[0;33m" $0 "�33[0m"} # YELLOW
'
- Finish by pressing Enter + Ctrl + D.
The new script should be saved in /tmp/colorful-access_log.sh.
- Change the script permissions by running the following command:
chmod +x /tmp/colorful-access_log.sh
To test, run the following command:
/tmp/colorful-access_log.sh
You should see different line colors depending on the filtered message in the Squid access.log file.
As we have explored, we can do extensive filtering and ease the log outputs with a few commands such as tail, grep, and awk.
Summary
This chapter has explored the CLI world with its multiple possibilities. From now on, you can take advantage of the OPNsense CLI (with caution) and run advanced commands and customizations on it. In the next chapter, we will explore the API calls that will extend the power of the CLI over HTTP(S) calls.