C H A P T E R 13
Business Intelligence
This chapter will look into how Business Intelligence is integrated into the SharePoint 2010 platform, starting with an overview of the basics of Business Intelligence, introducing the new additions made available to Business Intelligence in SharePoint 2010, exploring how to optimize your Business Intelligence Resources to get the most out of them, followed by Web Parts and the enhancements that are readily available for your use. This chapter will also review the new features in Excel Services, talk about planning PerformancePoint Services, and culminate with assessing which Reporting Services type of mode is suitable for your needs.
If you are already familiar with the basics of Business Intelligence, feel free to move directly into the topic of your choice or interest.
Overview
The term Business Intelligence has been a buzz word for some time. Buzz words lose their true meaning with the passing of time and thus cause confusion, so let’s start by defining the meaning of Business Intelligence.
Business Intelligence is understood as a variety of methodologies and techniques used in identifying, gathering, extracting, analyzing and providing data to empower users in the decision making process.
Why has Business Intelligence become such an important focus for businesses? It has steadily attracted the attention of management executives. To cite a few reasons, it can
- Identify problem areas in a company.
- Reduce and accelerate the decision making process.
- Save money.
- Reduce costs.
When the amount of time required for decision making has been reduced, the possibility of impacting the bottom line increases as the company’s efficiency and processing times areboosted by enhancing and providing a competitive advantage against their competitors. As a result, businesses have realized that it is no longer a luxury but a worthwhile and essential investment.
New Additions to Business Intelligence in SharePoint 2010
Business Intelligence within SharePoint has grown since the previous version. In fact, there has been a considerable investment and expansion to what is known as the self-service Business Intelligence arena.
The self-service Business Intelligence area has consolidated a previously known product named ProClarity with PerformancePoint; the result is called PerformancePoint Services within SharePoint 2010. Likewise, Excel Services has grown more robust since its previous implementation in Microsoft Office SharePoint 2007; it is no longer confined to data within Excel thanks to the integration of PowerPivot with Excel. Excel Services can now gather data from multiple sources and perform calculations on large amounts of data very quickly. Moreover, it includes a new and improved Excel Web Access Web Part that Reporting Services has made available; as a result, elegant and visually appealing charts that were not available before in SQL Server 2008 are now possible.
The Business Intelligence Center has been revamped and includes dashboards and template options; you’re no longer confined to a predetermined template. A new Chart Web Part allows charts to be generated from data in SharePoint Lists, plus new and improved Reporting Services Web Parts are AJAX-enabled.
There are even two new additions to the Business Intelligence area: Access Services and Visio Services. The biggest advantage of these new additions is that they don’t require Microsoft Access or Microsoft Visio on the client computer; also, both are available through the SharePoint 2010 User Interface (UI).
Access Services provides the ability to publish Access databases into SharePoint 2010; while this might not seem important, it does have a distinct advantage of accessing a central location for tables within an Access published database, and one that is updated through the browser. It does have its limitations, such as no support for VBA, but there is the ability to recreatethe Microsoft Access Database from the site. This last feature is helpful because you can publish the Access database as a SharePoint Site and whenever you are ready to re-consolidate it as an MDB, you can do so. Reporting is also available without the need for SQL Server Reporting Services.
Visio Services provides the ability to share Visio diagrams and Visio data-driven diagrams without requiring Microsoft Visio to be installed on the client computer. Depending on who you talk to, these two new features are not always considered part of the Business Intelligence area—most likely because they are neither as powerful nor as tightly integrated as the other features. Because these are the first versions of Access and Visio Services, given enough time, they will improve and become more powerful and versatile just as Excel Services and other previous new kids on the block have.
Optimizing Your Business Intelligence Resources
Before even creating a dashboard, report, or Excel workbook, it’s of the utmost importance to assess how many end users will be using the Business Intelligence area(s) of SharePoint 2010; in other words, it’s important to plan. As the saying goes, “If one does not plan, one plans to fail.”
This is vital for a successful deployment of the services in the Business Intelligence area of SharePoint 2010. The Business Intelligence Application Services will be relying upon the hardware architecture that was planned and deployed for the delivery of dashboards, reports, and workbooks to the end user. Adding to the situation is the fact that it is highly likely that the users that belong to the Business Intelligence areas of the company are not your typical day-to-day users. Most Business Intelligence users are high profile individuals that make important decisions based on the tools they use on a daily basis. If these are not fast or robust enough, the end result of the Business Intelligence project will not be considered successful; instead it might be seen as a waste of resources.
A Business Intelligence project must provide data immediately, so it is extremely important to plan the processes to deliver the data for analysis while simultaneously supplying on-the-fly analysis for all end users. The system must be able to respond in a timely fashion and accommodate multiple requests at the same time.
Architecture Planning
Architecture planning is more than just the assessment of the number of servers, memory, and storage required for the project to be deployed. In this scenario, you are targeting resources that will support PerformancePoint, PowerPivot, Excel, and Reporting Services at a minimum.While there are many factors and variables to consider, the following list can serve as a guideline:
- Number of simultaneous end users.
- Estimated workload of end users.
- Data amounts related to the end user’s workloads.
- Business Intelligence Services that will be up and running.
Once you have a good estimate of these items, you can establish a preliminary budget. Then you can shop around and determine what you can purchase within your budget—or determine if your budget is large enough to make any of it happen. Sometimes budgets are predetermined and you don’t have much choice regarding what hardware resources can be purchased. If this is the case, it’s important to make the target users aware of these limitations and coordinate how everyone can coexist without affecting performance for the entire group of Business Intelligence end users. Microsoft has published the following links to assist in this process:
- Capacity management and sizing overview for SharePoint Server 2010
http://technet.microsoft.com/en-us/library/ff758647.aspx - Capacity management for SharePoint Server 2010
http://technet.microsoft.com/en-us/sharepoint/ff601870 - SharePoint 2010 performance and capacity technical case studies
www.microsoft.com/download/en/details.aspx?displayLang=en&id=7480 - SharePoint Server 2010 performance and capacity test results and recommendations—This contains the planning for
- Business connectivity services
- Large Scale Document Repositories
- Social computing
- Office web apps
- SharePoint server caches
- Visio services
- Word automation services
www.microsoft.com/download/en/details.aspx?displayLang=en&id=12768
Additionally, a great tool for capacity planning is an Excel workbook made available by Tihomir Ignatov (Microsoft ). It contains three tabs.
- General Sites Sizing: Collects current database size and file count, and projects based on entered estimates the growth for a year
- Capacity: Content, search index and LUN sizes
- About: Author and more details
- Available at
http://tihomirignatov.blogspot.com/2010/12/sharepoint-2010-capacity-planning-and.html
Most of the time, existing hardware for the initial rollout of SharePoint 2010 is used and serves as a starting point for the Business Intelligence initiative. While this is a valid way to start, it is not a recommended situation for the Business Intelligence initiative because it is a very different system when it comes to resource consumption. Keep in mind that every project varies, so the architecture that worked well for a specific project may not work well for a different project. That said, it’s recommended as a starting point for a pilot hardware infrastructure to begin with a separate server for each layer. So in this case, the layers would be Web Front Ends, Applications, and Database. You should also do the following:
- Involve all users for the pilot and final rollout to use the setup infrastructure.
- Gather and collect usage and performance data.
- Review the collected data to assess what the next steps might be. These could include
- The fine tuning or increase of
- Memory
- Storage
- Hardware
- Etc.
- The fine tuning or increase of
Last but not least, it’s necessary to pinpoint where the majority, if not all, of the data will be coming from. Why do you need to know the data source(s)? Because of storage, as listed previously. It’s recommended to have a structured and performant source for your Business Intelligence inquiries.
![]() Note While there can be many different data sources, I recommend using Microsoft SQL Server Databases and Data Warehouses instead of Lists or Workbooks, particularly since they provide a variety of tools that are useful in the optimization processes.
Note While there can be many different data sources, I recommend using Microsoft SQL Server Databases and Data Warehouses instead of Lists or Workbooks, particularly since they provide a variety of tools that are useful in the optimization processes.
Data Storage Optimizations
Data can be stored in SharePoint lists and/or databases. Part of the planning process is to decide which provides the most options. Often SharePoint lists are chosen as the main storage source, but it is by no means the only or the most versatile choice.What follows is a review of the details of SharePoint lists and databases.
Lists
Lists are a key component in any version of SharePoint; improvements have been made since their introduction. Alist is very similar to a database table—the keyword being “similar.” The small differences can matter when making use of lists in SharePoint. These small differences include the following:
- A key is automatically created and selected on every list (usually the column named Title).
- Lists exist within a site and are not generally available to all sites.
- Lists can be throttled to manage large amounts of data and improve response times.
![]() Note Throttling can be thought of being very much like caching, in which you are indicating how many list items will be retrieved when a request is made.
Note Throttling can be thought of being very much like caching, in which you are indicating how many list items will be retrieved when a request is made.
Even though lists are an excellent way of sharing and collaborating and have improved greatly with SharePoint 2010, it is important to remember the following key aspect:
![]() Note Lists are not database tables, nor should they be used as such.
Note Lists are not database tables, nor should they be used as such.
What is often forgotten is: Where are SharePoint Lists stored? Well, guess where? In the SharePoint content databases. That said, it doesn’t hurt to question if there is the need to have an extra step involved in the process for the retrieval of data, particularly if you can go directly to the source and that source can be optimized in more ways than a SharePoint list.
List Planning Guidelines
Below are the top items to reference when planning your Lists (a comprehensive list is available at: http://technet.microsoft.com/en-us/library/cc262787.aspx#ListLibrary):
- A maximum items are 30 million per list.
- A maximum of 100 selected items per bulk operation through the UI.
- A maximum of 48 calculated columns.
- A maximum of 94 managed metadata columns.
- A list view threshold of 5,000.
- This can be modified; when increased, it will directly impact performance.
- It’s also known as list throttling.
- A 2GB file size limit for attachments.
- This can be increased if needed; performance will be directly impacted.
- A maximum of 8 join operations in a query.
- When exceeded, operations are blocked on the list.
- Mobile views availability: Out of the box, the limits are constrained to the real estate available for the mobile devices.
- Data availability:If the data will grow and will need to be available to multiple applications enterprise wide, a database is the best choice, particularly because it has the potential to be accessed by a large range of applications ( Microsoft Office, Microsoft SharePoint 2010, Business Connectivity Services, Custom Developed Applications, etc. ).
![]() Note
Note http://technet.microsoft.com/en-us/library/cc262787.aspx#ListLibrary is updated with the latest updates made available with the SharePoint 2010 Service Pack 1 Update.
SharePoint Content Databases
The content database aspect is often forgotten and thus not always planned well; most of the time this happens because of budget limitations. But once the performance starts affecting the usage of SharePoint and Business Intelligence within SharePoint, questions will be asked; many times there are no straight answers to those questions.
Because most applications, if not a large majority nowadays, depend and store the data used directly in databases, it’s of the utmost importance to take into account the following considerations when it comes to the SharePoint content databases:
- Regularly monitor the available free space in your database drives and files. This includes
- Dedicating your drives to your database files, preferably for exclusive use. This concept should be applied throughout the different types of storage in use.
- Placing your log and database files in separate drives and LUNs.
- Plan and/or leverage quota management to keep track of the maximum sizes for your site collections. More details are available at
http://technet.microsoft.com/en-us/library/cc891489.aspx. - Plan the location for your content database files.
- Plan for High Availability.
- Prepare and regularly test a disaster recovery plan. Make sure to include
- Mirroring, which is available natively in SharePoint 2010. I recommend mirroring for setting up an offsite backup infrastructure. Post SPI I would strongly recommend considering SQL Server 2012 and AlwaysOn.
- Backup Tools include
- SharePoint Central Administration
- SQL Server
- PowerShell
- Explore and review third party products that could align with your needs; each one varies in their offerings and features provided.
- I recommend using a mix of SQL Server and PowerShell, mostly due to the cost benefits and flexibility that both provide.
- Backup storage locations: Use both onsite and offsite options.
- Security
- Plan for the security of the data in the backups. If necessary, decide if data in certain sites or site collections should be covered in a different plan or perhaps a completely separate software/hardware infrastructure.
- Breaches
- Lost backups.
- Unauthorized access to data: Adhere to company policies or create one if it doesn’t exist.
- Frequency: Options include full, incremental, and a mix of both.
- Test the backups to ensure that they are not corrupt and can be used for a recovery when disaster occurs.
- Database maintenance.
- Scheduled drills for disaster recovery preparation.
- If a Disaster Recovery Plan is not available, a starting point is available at
http://technet.microsoft.com/en-us/library/cc261687.aspx. - Drill executions
- Executed as often as the Disaster Recovery Plan stipulates.
- The drills should be executed as often as the amount of data loss that is acceptable.
- The drills can be separated into
- External Facing
- Internal Facing
- Full: Allows for operations to continue without any change.
- Limited: Allows for the internal operations to continue operating at a reduced capacity.
- Full recovery on a similar environment
- Off site on an alternate environment
- Content Only
- Site Collection
- Sites
- Lists
- Document Libraries
- Never recover backups directly into the current failed environment. Test in a separate and identical environment prior to making the restore to the target environment. This allows for finding out if there any problem has affected the data in the backup.
While this list is not necessarily all inclusive, it has been my experience that many companies forget to implement one or more items from this list. The worst chase is when a company doesn’t even bother to address them at any point in time after the implementations have been set to “live.”
When everything is working, things are fine. That’s when this list is easily dismissed and ignored. But when disaster strikes—which it always does; it’s just a matter of time—then it becomes a high priority to recover the data. Stress and pressure become a constant until the data is recovered and the failed systems are working as they should.
Best Practices
- Assess which storage is best suited for your data
- SharePoint
- Database: Keep in mind that when data is stored in a database, it’s easier to export or share.
- How much data will be stored in the list(s)
- The maximum limit is 30 million items in a list.
- Consider throttling; this can, in certain cases, enhance performance.
- If the data stored in SharePoint lists will be shared, consider the following:
- Organize the data to be presented from lists in views.
- Create multiple views if needed; most of the time, it is related to how the data will be organized. Some users or departments might only need certain columns, specific sorting, and/or grouping; this will vary depending on end user requests and needs.
- Plan the steps involved with the SharePoint lists.
- Data entry and/or manipulation
- Charting
- Reporting
- Creation of multiple Web Part pages. The Web Part pages should be created from the standpoint of the following:
- Performance
- Organization
- Ease of use
- Disable the following settings if they won’t be used:
- Versioning: They can grow out of control if not monitored.
- The limit for major versions is 400,000.
- This should be reviewed if versioning has reached double digits.
- Attachments: Most of the time they aren’t used.
- Folders: Help organize content through a SharePoint list or document library; while they are useful, content types should always supersede the usage of folders particularly due to the searchability features that content types provide.
- Enable inline editing. It simplifies data editing for the end user.
- Determine the items to limit or display, taking into account the following criteria:
- Performance
- Boundaries and limits
- List throttling
- Mobile devices
- Total the columns that contain relevant amounts or numbers.
- Index columns that will be used frequently for better performance (remember that the maximum is 20).
- Limit your lookups to a maximum of 8.
- Ensure that the target end users have the proper permissions setup on the list(s).
If you would like to learn more about managing large lists and throttling, the following links will interest you:
http://msdn.microsoft.com/en-us/library/ee557257.aspx
Web Parts
Web Parts are everywhere within SharePoint 2010. For instance, they are used to display, create, update, and delete data inside SharePoint lists. Web Parts have a variety of uses and they can be used for just about for anything within sites. Within every SharePoint site, a SharePoint Web Part is most likely being used.
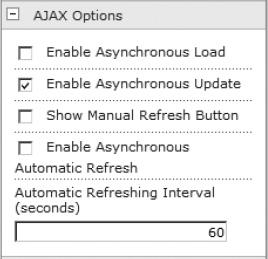
Figure 13-1. Enhanced List View Web Part
Figure 13-1 details the enhanced List View Web Part, which is the ability to configure the AJAX options of the Web Part. The AJAX Options enhancement is a welcome enhancement that does make a difference when used with other Web Parts that support AJAX. A quick example would be by connecting with other List Web Parts to filter them.
Filtering Lists
In order to illustrate the use of filters in SharePoint lists, an example site called “BI Lists” has been provided. The BI Listssite contains the following SharePoint lists:
Additionally, it contains the following site pages:
- Sales
- FilterBySalesPerson
The sample is not all-inclusive or extensive but it does serve the purpose of illustrating how filtering can be used to your advantage. The Sales site page contains a Chart Web Part, which serves to demonstrate the Chart Web Part by creating a bar chart report based on the data from the Yearly Sales SharePoint list. The FilterBySalesPerson site page contains Text Filter, SharePoint List Filter, Sales People, and Yearly Sales Web Parts. If you’re not familiar with the Filter Web Parts, they did exist in Microsoft Office SharePoint Server 2007, but they are seldom discussed. They are very useful and powerful, particularly when filtering data from List View Web Parts.
The difference between the Text Filter and the SharePoint List Filter Web Parts is that the Text Filter Web Part the filter values are typed in while the SharePoint List Filter Web Part displays the choices as radio buttons.
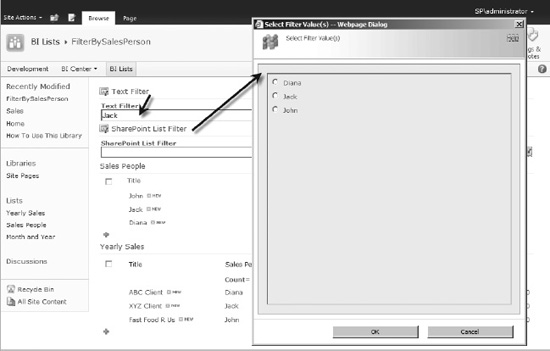
Figure 13-2. Filter Web Parts
Figure 13-2 illustrates the values for the Text Filter and SharePoint List Filter Web Parts.Once the values have been selected, it’s noticeable that the Sales People and Yearly Sales Web Parts have been filtered based on the typed-in value of “Jack” from the Text Filter Web Part.

Figure 13-3. Filtered List View Web Parts
Figure 13-3 depicts the filtered List View Web Parts based on the typed in value into the Text Filter Web Part.The filtering occurred by creating a connection that goes from the Text Filter Web Part towards the Sales People and Yearly Sales Web Part.
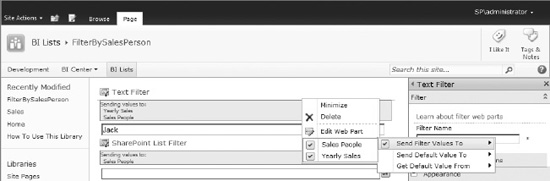
Figure 13-4. Filtered List View Web Parts with a Text Filter
Figure 13-4 illustrates the connection between the Text Filter and List View Web Parts. Why would you want to filter the values within SharePoint lists? Because it’s easier to view the data when it’s displayed and filtered with specific values. In the provided SharePoint lists, there are not many list items, but can you imagine when you have thousands or list items? It can be difficult to distinguish, let alone get a grasp and digest all that data.
Chart Types
|
|
|
|
|
|
|
|
|
|
|
|
|
Charting from Different Data Sources
The Chart Web Part provides the ability to chart from different data sources. The easiest to configure is a SharePoint list. That’s not the only option available; it is very easy to configure the data into a chart because of the intuitive interface that it offers out of the box.
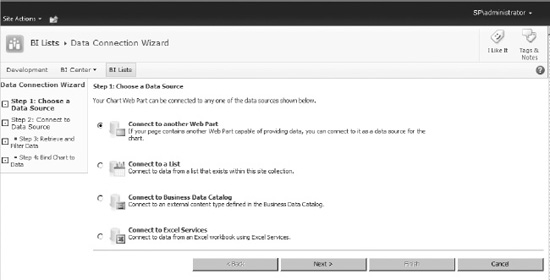
Figure 13-5. Chart Web Part Available Data Sources
Figure 13-5 shows the data connection wizard. The configuration process is divided among the following steps:
- Clicking the “Data & Appearance” toolbar link.
- Connecting the chart to the data.
- Selecting the data source.
- Providing a filter for the data to chart.
- Binding the data by selecting the series and X and Y fields.
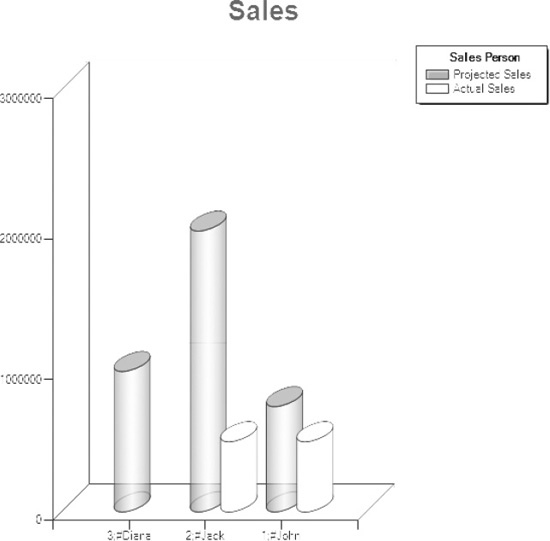
Once the Web Part has been provided with information, the data is charted and displayed by the Chart Web Part. Figure 13-6 illustrates what a chart could look like.
Benefits of Filtering Lists
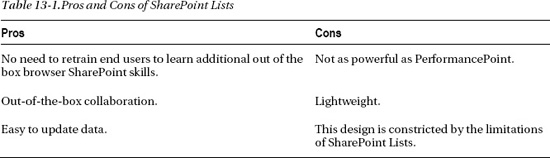
By now, you have probably figured out that this looks like a very light Business Intelligence site within the SharePoint 2010, which is the point I was trying to convey. You can create a very simple, small, and lightweight site that allows you to drillthrough data in your SharePoint lists.The out-of-the-box functionality within SharePoint lists offers the pros and cons outlined in Table 13-1.
External Data Sources
List View Web Parts can also display data from external data sources such as databases. This is achieved by using external content types. By combining data within SharePoint Lists and from external data sources, you can truly increase the value of the sites you have created.
The data that will be made available from an external data source will be presented within SharePoint with the List View Web Part. This means you can filter and manipulate it as if it were a SharePoint list.
Suggested Best Practices
- Review and ensure that the data within the SharePoint lists is accurate. Whatever decisions are made upon this data will be as reliable as the data.
- Plan how many Web Parts you will have on a page. The more Web Parts exist on a page, the slower the response time.
- When large amounts of data exist within a list, you should do the following:
- Index columns
- Leverage the Filter Web Parts or simply enable the filtering capabilities available within the List View Web Parts.
- Plan how to incorporate and combine data from SharePoint lists and external data sources.
Excel Services
Excel Services 2010 has improved greatly since what was made available in Microsoft Office SharePoint Server 2007. Because Excel Web Applications are new to SharePoint 2010, it’s easy to get confused with Excel Services. However, both serve different purposes. Excel Web Applications are a limited subset rich client of Excel 2010 and are used to present Workbooks; Excel Services is more of a server-side Excel.
Since Excel Web Applications provide the ability to display workbooks just like an Excel Web Access Web Part, which one should you use? Well, does the workbook need interaction with data from or to Web Parts?If the answer is yes, then the task is most likely suited to use the Excel Web Access Web Part.
New Features
Many enhancements and improvements have been made to Excel Services, including the following:
- Trusted locations are now defaults.
- Slicers: New filtering functionality for Excel 2010 workbooks is available in combination with PivotTables and PivotCharts.
- Sparklines: Mini charts that appear in designated column and row of a worksheet.
- Show Value As: Simplifies how data will be shown as through a context menu.
- Excel Web Access Web Part
- Changes are now saved into the workbook being edited.
- Includes AJAX support.
- Has the ability to send and receive data from other Web Parts.
Reducing the Workload from the SharePoint Server and Document Libraries
As mentioned, Excel Services can be thought as a server-side Excel installed within SharePoint 2010. With this analogy, add to the thought that when a workbook is being worked upon through the browser, every time it is saved or a calculation needs to be performed, it is being done on the server(s) used by the SharePoint 2010 farm.
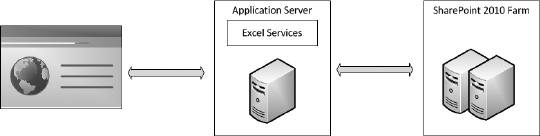
Figure 13-7. Depiction of workloads generated by workbooks
All these thoughts are represented with Figure 13-7. As illustrated, a lot of traffic can be generated back and forth just by working on workbooks. This increases exponentially based on the number of users, amount of data, calculations, and the number of times a workbook is saved.

Suggested Best Practices
- Plan for the following:
- Trusted locations: Is a feature that allows to configure which files are allowed to be loaded safely. Trusted Locations extends to: Access 2010, Excel 2010, PowerPoint 2010, Word 2010 and folders. By taking control of what files are trusted it simplifies their management, otherwise they can out of control.
- Manage Excel Services trusted locations (SharePoint 2010)
http://technet.microsoft.com/en-us/library/ff191194.aspx- How Excel Services will be setup; in particular the following settings:
- File access method
- Connection encryption
- Allow cross domain access
- Load balancing scheme
- Maximum session per user: If you want to manage your resources tightly, set a specific number; otherwise, set it as -1.
- Have users use their local drafts folder when checking out workbooks.
- Publish only the worksheets that need to exist in the workbook.
- Leverage the following:
- Named Sets to facilitate referencing a commonly used set of items. Named sets can be thought of dimension members; once created, they ease the ability to filter data.
- PowerPivot is a useful add-on that increases the functionality of Excel 2010.
- When in doubt whether a user has Excel 2010 available on their desktop, consider using the Excel Web Access Web Part for displaying the workbook(s).
PerformancePoint Services
PerformancePoint Services is a new and welcome addition to SharePoint 2010. It once existed as a separate product and is now tightly integrated within SharePoint 2010. Because it is integrated into SharePoint 2010, the dashboards are now deployed into a folder within a document library. This allows for securing the content of the dashboards.
Creating dashboards is done through the Dashboard Designer, which is usually installed and started through the Run Dashboard Designer button of the deployed BI Center.
Planning
Before creating the BI Center site, consider the following: a BI Center site is a site not a site collection. While this might not seem that important initially, when managing, maintaining, and backing up one or more BI Centers, it will become quickly important for the planning and configuration of these BI Center sites.
Questions to Ask When Planning
- Client Deployments
- Do the target BI end users have the permissions (Administrator on the local box) to install the Dashboard Designer?
- BI Centers
- Will a single BI Center be deployed?
- Will there be a need to create more BI Centers?
The answers to the previous questions will clearly indicate a structure that will be used to create BI Center(s). It’s recommended to create a top BI Center(s) and create BI Centers under it; this will provide a centralized BI Center Site structure. Other questions include:
- Dashboards
- How many dashboards will be developed?
- Do these dashboards need to be organized in a certain fashion?
- Will dashboards require customization to their look and feel?
This is just a quick list of questions that can give you a sense of what needs to happen before BI Center sites are created plus how and where the dashboards will be developed and published.
Suggested Best Practices
- Determine the following:
- Exact or estimated number of BI Centers.
- Structure for the BI Centers to be provisioned.
- Establish a naming convention for the following:
- Folders: Helps organize dashboards.
- Dashboards
- I recommend the following format (expand or improve it according to your needs):
[Dashboard]_[Author]_[Date]_[Revision] – Without the brackets
- Plan the following:
- Location: A centralized location is recommended. A network share would work well once the permissions are set to full so that the end users could create folders as well as organize and manage the folder structure.
- Dashboard definition files: The dashboard definition files end with ddwx.
- Published dashboards
- Dashboard deployment steps or procedures.
- How to handle customizations:
- Perform them on the dashboard definition file, not on the ASPX file.
- Create separate master pages and select the modified master page when publishing.
Reporting Services
Reporting Services has improved with each version of SharePoint. This latest version has better integration and better charts. When developing the reports, take into account these new and improved charting controls that provide a very attractive and easy way to represent data in reports. A major consideration point is the integration mode to use between SharePoint 2010 and Report Services. The local mode is not integrated with a report server; it’s also known as native mode. The connected model integrates the Reporting Services Report Server into the SharePoint Farm, allowing its management through SharePoint Central Administration; it’s also known as integrated mode.
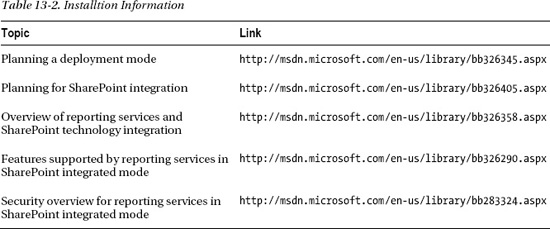
Assessing Which Type of Installation is Best for You
Before deciding which type of mode you should use, it’s a good idea to dedicate enough time to research which type of installation fits your needs. They both have pros and cons. Note that switching back and forth between either installation modes is not recommended nor should it be undertaken lightly.
Table 13-2 contains links that may help you decide which type of installation is best for you.
![]() Note I recommend local mode over connected mode because it provides you with a clear separation between SharePoint 2010 and Microsoft SQL Server Reporting Services. The advantage of that separation is the ability for easier management and recovery in case of an upgrade, service pack installation, disaster, etc.
Note I recommend local mode over connected mode because it provides you with a clear separation between SharePoint 2010 and Microsoft SQL Server Reporting Services. The advantage of that separation is the ability for easier management and recovery in case of an upgrade, service pack installation, disaster, etc.
Report Building Tools
When developing SQL Server reporting services reports it is usual to use BIDS (Business Intelligence Developer Studio) which ends up being added into Visual Studio 2008 at the moment of installation. Yes, that was Visual Studio 2008; not a typo. Visual Studio 2010 is still not supported for report building.
The other tool is Report Builder 3.0, which is a free client side download available at: http://www.microsoft.com/downloads/en/details.aspx?FamilyID=d3173a87-7c0d-40cc-a408-3d1a43ae4e33&displaylang=en.
Which Tool Should You Use?
Sometimes the tool is determined by the budget and/or the target developing users, mostly because if Microsoft Visual Studio 2008 is necessary, so is a license, which requires a purchase. Microsoft Visual Studio Express is an option, but unfortunately the Express version is limited in its functionality; at this point in time, it doesn’t support the ability to develop reports. If the purchase of Microsoft Visual Studio 2008 isn’t possible, Report Builder 3.0 is a free option. In my experience, both developers and non-developers find it very comfortable to build, test, and deploy reports within the Visual Studio 2008 environment and Report Builder 3.0.
Suggested Best Practices
- Decide which type of installation best fits your needs.
- Be sure to use Report Builder 3.0 exclusively with SQL Server 2008 and SQL Server 2008 R2.
- Leverage the following:
- Shared Datasets: Offers improved reusability and sharing.
- Report Parts: For reusability with other reports.
- Snapshots: For displaying reports at a specific point in time.
- Caching reports: Improves response time with Reports.
- Report Viewer Web Part: For displaying reports within SharePoint.
Summary
In this chapter, you have explored the basics of Microsoft Business Intelligence;reviewed the new additions to Business Intelligence in Microsoft SharePoint 2010; learned about the optimization of the Business Intelligence Resources; got some ideas for utilizing Web Parts for filtering and charting data; learned about some of the enhancements to Excel Services and how to reduce the workload from the SharePoint 2010 Server(s);examined which reporting services mode would best suityour needs; and learned about the available tools for developing reports.
Next Steps
Hopefully this chapter has encouraged you to consider leaping into organizing a pilot BI Center site(s); developing PerformancePoint dashboards, Excel Services workbooks, and SQL Server reporting services reports; charting data with Web Parts; integrating two or more of the developed items in Web Part pages; and deploying the pilot and impressing the executives.
Bibliography and Links
- Access Services Planning
http://technet.microsoft.com/en-us/library/ee683869.aspx - Visio Services overview
http://technet.microsoft.com/en-us/library/ee663485.aspx - Techniques for managing large lists
http://office.microsoft.com/en-us/sharepoint-server-help/sharepoint-lists-v-techniques-for-managing-large-lists-RZ101874361.aspx?CTT=1 - Report Builder 3.0 download
http://www.microsoft.com/downloads/en/details.aspx?FamilyID=d3173a87-7c0d-40cc-a408-3d1a43ae4e33&displaylang=en - Plan for backup and recovery
http://technet.microsoft.com/en-us/library/cc261687.aspx - SharePoint Server 2010 Capacity Management: Software Boundaries and Limits
http://technet.microsoft.com/en-us/library/cc262787.aspx#ListLibrary - Capacity management and sizing overview for SharePoint Server 2010
http://technet.microsoft.com/en-us/library/ff758647.aspx - Capacity management for SharePoint Server 2010
http://technet.microsoft.com/en-us/sharepoint/ff601870 - SharePoint 2010 performance and capacity technical case studies
www.microsoft.com/download/en/details.aspx?displayLang=en&id=7480 - SharePoint Server 2010 performance and capacity test results and recommendations
www.microsoft.com/download/en/details.aspx?displayLang=en&id=12768 - SharePoint 2010 Capacity Planning Tool
http://dougortiz.blogspot.com/2011/07/sharepoint-2010-capacity-planning-tool.html - SharePoint Server 2010 capacity management: software boundaries and limits
http://technet.microsoft.com/en-us/library/cc262787.aspx#ListLibrary - Plan quota management (SharePoint Server 2010)
http://technet.microsoft.com/en-us/library/cc891489.aspx - Manage Excel Services trusted locations (SharePoint Server 2010)
http://technet.microsoft.com/en-us/library/ff191194.aspx