
C H A P T E R 16
Tips, Tricks, and Traps
Truth is what stands the test of experience.
—Albert Einstein
The intent of this chapter is to organize a collection of experiences into a reference for some PowerPivot situations that don't necessarily apply to every solution developer. For example, you may have the occasional failure of the PowerPivot add-in for Excel. This chapter incorporates a set of tasks to troubleshoot the add-in so you can get the PowerPivot for Excel environment back to work.
Also included is information on dealing with the quirks, nuances, dare we say features of PowerPivot. Finally, there are some techniques for tuning your PowerPivot for Excel solutions. You'll learn how to use slicer overload to increase worksheet performance. You will also learn to trace the Multidimensional Expressions (MDX) query language by which PowerPivot makes requests to the in-memory database engine.
PowerPivot Annoyances
Sometimes they are referred to as “features,” sometimes as “bugs,” and other times by the harsher term “defect.” By whatever name, PowerPivot for Excel contains the sometimes curious behaviors common to any complex software product in the initial release.
Disabled PowerPivot Add-In
Upon starting Microsoft Excel, you may find the PowerPivot ribbon item is missing, as illustrated in Figure 16-1. It is, of course, exceedingly difficult to do work in PowerPivot for Excel without the PowerPivot ribbon menu. The missing PowerPivot ribbon menu is the principal symptom of a disabled PowerPivot add-in.
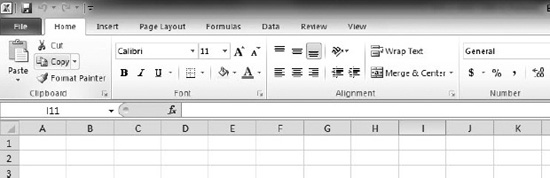
Figure 16-1. Missing PowerPivot add-in
In order to get your PowerPivot for Excel environment back up and running, perform the following steps. First, select the File ribbon item and then the Options submenu, as circled in Figure 16-2.
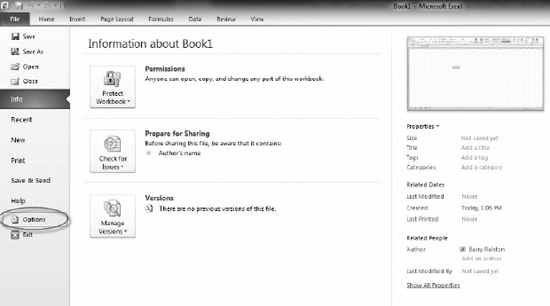
Figure 16-2. File Options submenu
Selecting the Options submenu will display the Excel Options panel, illustrated in Figure 16-3. Select the Add-ins menu item, circled in Figure 16-3.
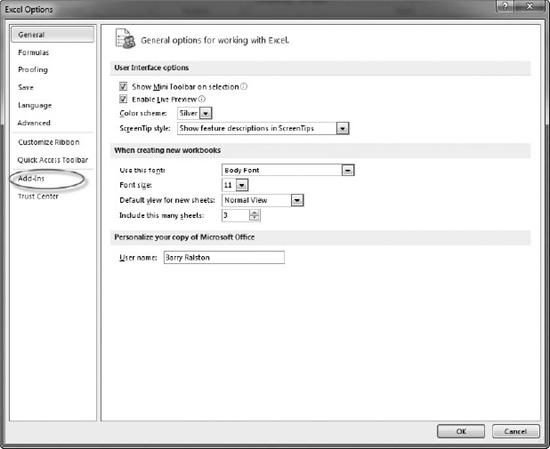
Figure 16-3. Excel Options panel
The Add-ins panel, illustrated in Figure 16-4, will display all of the currently installed Excel extensions. Note the PowerPivot for Excel add-in is a COM-based (Component Object Model) add-in.
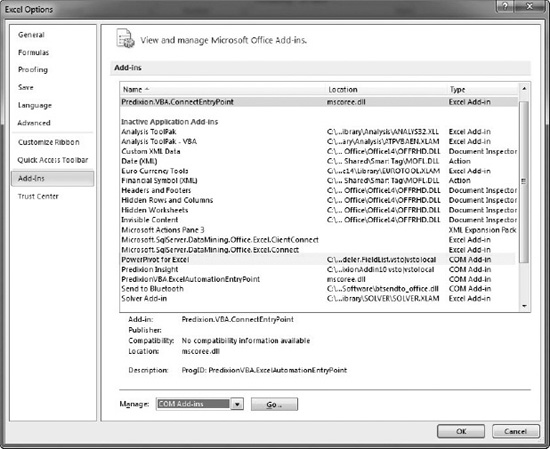
Figure 16-4. Microsoft Office add-ins
Also note the PowerPivot for Excel add-in is in the group of inactivated items. Following the next set of steps will re-enable the add-in, restoring the PowerPivot for Excel features. Using the Manage pull-down illustrated in Figure 16-5, select COM Add-Ins (recall PowerPivot for Excel is COM-based) and click the Go button.
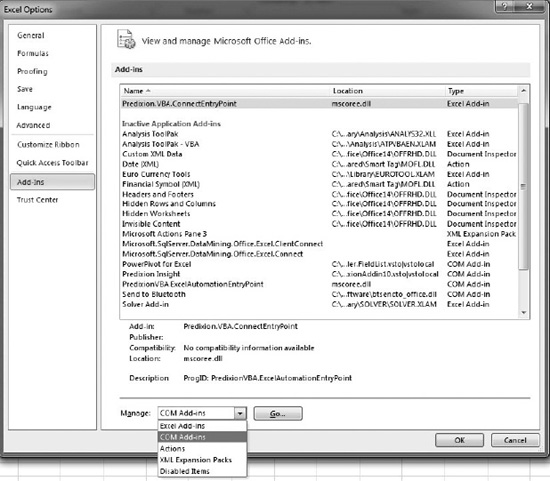
Figure 16-5. Managing COM add-ins
The dialog for managing available COM add-ins, illustrated in Figure 16-6, will be displayed. A disabled PowerPivot for Excel add-in will have an empty check box in the list of available add-ins. Click the check box corresponding to PowerPivot for Excel, ensuring it is in a “checked” state, and click the OK button. The PowerPivot for Excel add-in will be activated, and the PowerPivot menu will reappear on the ribbon.
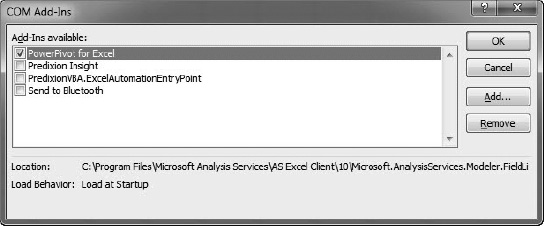
Figure 16-6. Activating the PowerPivot for Excel add-in
Calculated Column Missing
As you use calculated columns in your PowerPivot data, it is important to remember the PowerPivot Field List is not immediately synchronized with the PowerPivot data metadata. For example, after adding a calculated column to a PowerPivot table, the PowerPivot Field List in Excel will display the “PowerPivot data was modified” warning, as circled in Figure 16-7.
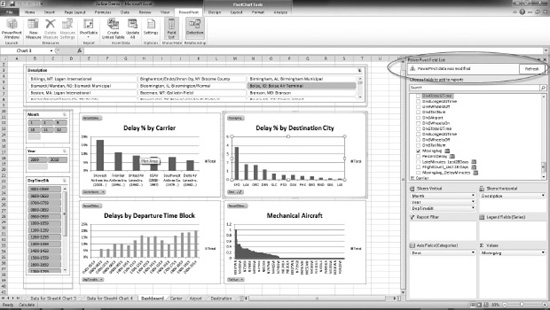
Figure 16-7. “PowerPivot data was modified” warning
However, it's important to remember that pressing the Refresh button doesn't refresh the PowerPivot Field List. In order for the new calculated column to appear in the field list, you must send a query to the underlying SQL Server Analysis Services (SSAS) database. Simply interact with any of the slicer selections, even changing the selection illustrated in Figure 16-7 from Boise to any other value and back. Changing the selection will result in the new calculation appearing in the PowerPivot Field List.
User Experience for PowerPivot Solutions
PowerPivot for Excel provides an environment for rapid development of reports and dashboards from related yet potentially disparate data sources. However, the ease with which the data can be combined and reports created can cause the user experience to be overlooked.
![]() Note I am at heart a database guy who geeks out over the data capabilities of PowerPivot. The intent of this section is to share a few tips on creating a pleasing user interface with PowerPivot. I am not a user experience professional but have found my way to creating workable user interfaces.
Note I am at heart a database guy who geeks out over the data capabilities of PowerPivot. The intent of this section is to share a few tips on creating a pleasing user interface with PowerPivot. I am not a user experience professional but have found my way to creating workable user interfaces.
Connect Slicers Visually
The ease with which PowerPivot slicers can be added can cause user confusion. This is especially the case in a PowerPivot report when all slicers don't relate to all charts/tables. For example, if a single slicer applies only to a subset of the PivotCharts or PivotTable elements of the report, there is no visual cue as to how a slicer is filtering each report element.
In this case, you can use Excel formatting to visually link the elements that relate to each other. To illustrate the example, consider the reports in Figure 16-8. The Origin State and Departure Airport are connected in that they filter data for the Weather PivotChart. Those two fields affect only the Weather chart, and not others that you see in the figure. To make the relationship plain to the user, you can color the background cells to match the bars in the chart, as I've done using the color blue. You may need to explain that approach once or twice to your users, but you'll find that they quickly catch on.
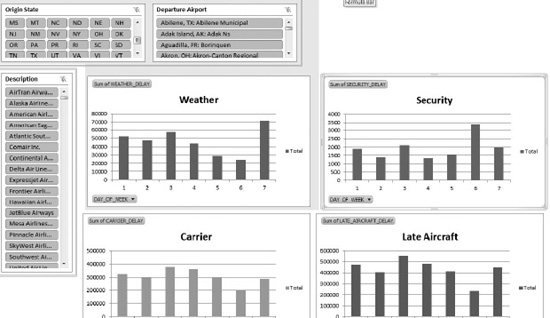
Figure 16-8. Visual cue for slicer connection
Lose the Grid
To reduce the number of steps, many of the examples in this book don't adhere to this very powerful tip to create a more pleasing user interface. However, it is widely held that PowerPivot tables and charts simply look more appealing to users without Excel's gridlines. Combined with removing the row and column headers, a custom application look and feel can be quickly created.
To hide the gridlines, select Page Layout from the ribbon. Then uncheck the Gridlines View check box, as illustrated in Figure 16-9. Similarly, row and column headings can be removed by unchecking the adjacent Headings View check box.
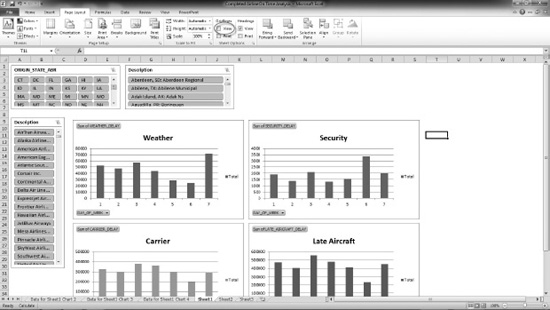
Figure 16-9. Removing gridlines
Tuning PowerPivot Performance
PowerPivot for Excel's features for loading and combining data can be dazzling. In certain cases, these very data loading features can also lead to slow-performing PowerPivot for Excel solutions.
Slicers: Less Is More
In my opinion, slicers are the most visually unique element of PowerPivot. However, they can greatly impact the performance of report (PivotTable and PivotChart) updates. If you incur this type of performance issue in your PowerPivot solutions, here are a couple of suggestions for decreasing update runtimes.
First, endeavor to source slicers from dimension tables as opposed to fact tables in your solution. For example, consider an organization that works with a product set that contains 200 distinct products, and therefore only 200 distinct product names. The fact table for the same solution contains 500 million orders. The PowerPivot engine will more quickly update a slicer based on the 200-row product table as opposed to determining the distinct products using the 500-million–row fact table.
Second, consider eliminating the relationship between slicers. Recall how, by default, multiple slicers on the same PivotTable or PivotChart structure interrelate to visually indicate slicer tiles for which no fact data exists. While removing this feature is not applicable for all solutions, the reduction in workload for the PowerPivot engine is significant. Disabling this feature is a matter of right-clicking the slicer, choosing Slicer Settings from the context menu, and then unchecking the items highlighted in the resulting Slicer Settings dialog, illustrated in Figure 16-10.
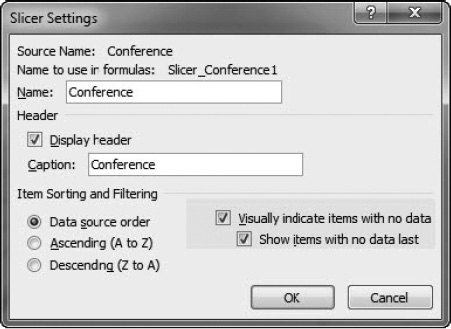
Figure 16-10. Disabling slicer relationships
PowerPivot and SSAS Interaction
PowerPivot for Excel is an environment for developing solutions using the SSAS in-memory runtime. Because the language for querying SSAS databases is Multidimensional Expressions (MDX), you may find it useful in your PowerPivot tuning efforts to examine the queries being sent from PowerPivot for Excel to SSAS. This tactic requires SQL Server Profiler in order to use the trace files that are generated from PowerPivot for Excel. To begin generating trace files, follow these steps.
First, open a PowerPivot solution from Microsoft Excel. Next, select the PowerPivot ribbon menu and then the Settings selection, as illustrated in Figure 16-11.
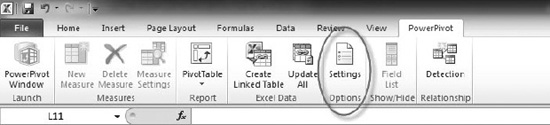
Figure 16-11. PowerPivot Settings menu
The Settings dialog illustrated in Figure 16-12 will be displayed. Check the “Client tracing is enabled” check box, and select a location for the resulting trace file. The default location is fine for our purposes.
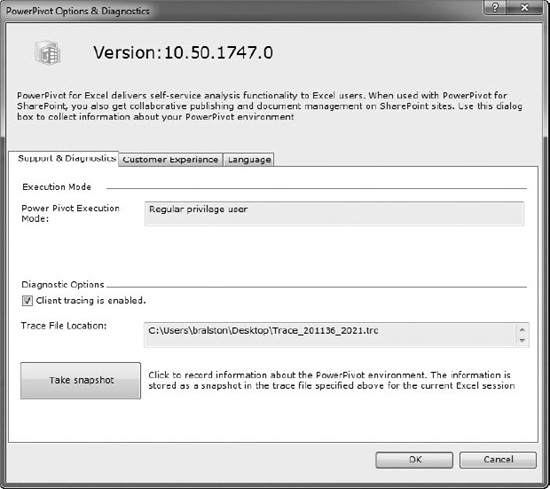
Figure 16-12. PowerPivot settings
Interact with the PowerPivot for Excel slicers or alter the composition of a PivotChart or PivotTable in your solution. By doing this, several queries are sent to the PowerPivot engine (SSAS). Return to the PowerPivot settings, and disable the client tracing feature by unchecking the check box illustrated in Figure 16-12. This is very important, as otherwise all PowerPivot activity will continue to be logged to the trace file.
The trace file created by PowerPivot requires SQL Server Profiler in order to actually open and view the contents. Figure 16-13 illustrates a portion of a trace file, highlighting the Query End event.
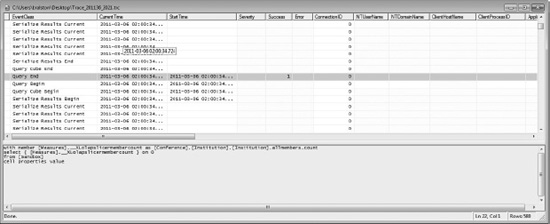
Figure 16-13. Trace file in SQL Profiler
Combined with SQL Profiler, the client trace files can be used to determine the actual query execution times and data volumes being utilized in the PowerPivot engine.
Summary
All tools have their rough edges, and PowerPivot is no different. The tips in this chapter are part of my hard-won experience. Don't be put off by the rough edges. PowerPivot is a powerful tool for bringing data mining to the end user. Take advantage of PowerPivot in your business and apply the tips and techniques in this chapter to make your work easier.