
C H A P T E R 15
Designing Mashups with Excel and Visio
Business Intelligence and reporting have been two of the most important functions of data management systems over the last several decades, and as technology changes, the means for reporting and creating dashboards has evolved to meet the changing needs and capabilities in the market. In today's world, the availability of services such as geographic mapping and social networking on a global scale has led to the redefining of how information is organized and portrayed on the Web. In many cases, dashboards now need to provide a high level of relevance, far beyond a simple tabular report or even charts, and the information expressed should be cohesive and dynamic, allowing the user to incorporate the data they need with external systems that complete a picture for them. This new dashboard for the Web is known as a mashup, and in SharePoint 2010, Microsoft has provided a framework for completing their services that they refer to as Composites. With tools such as Visio, Excel, and PerformancePoint Services, SharePoint has a full feature set for reporting. This chapter will address some aspects of how to extend the out-of-the-box experience from Visio and Excel to quickly create a mashup.
Visio Mashups
Microsoft Visio is a graphical modeling tool used for everything from designing software systems and databases to specifying network architecture and the layout of an office space. The ability to easily create and link shapes together makes Visio a very practical tool for custom dashboards, where the visual representation of information is more important than just seeing the data alone.
Using this capability makes sense when the information portrayed is process or goal driven and the end user of the dashboard needs less analytical information and more visual indication. A good example of process driven data is an air traffic controller, where reams of data is less vital than seeing flashing indicators or live radar. A goal-driven Visio drawing may use something simpler, like a thermometer for showing a company’s annual growth or donation amounts at a fundraising drive.
Mashups for Visio include more than just plain old Visio drawings published and viewable on the Internet. End users are able to create data-driven Visio drawings that tie to one of many types of sources published in SharePoint; then they publish the drawing to their sites. Then a JavaScript developer may add code to interact with the Visio drawing on a given web page. Extending the Visio drawing with the Mashup API creates a powerful integration point between the drawing and other services that are available, such as an online mapping or social networking service. The possibilities are only limited by the imagination of those who are implementing the solution. In this section, you will learn how to create data Visio drawings and how to utilize the JavaScript API components.
![]() Note I am very excited about the release of Visio Services for SharePoint 2010; it has opened up a completely new avenue of process-based dashboards that was traditionally difficult to represent without designing and building a custom application.
Note I am very excited about the release of Visio Services for SharePoint 2010; it has opened up a completely new avenue of process-based dashboards that was traditionally difficult to represent without designing and building a custom application.
Creating Data Driven Shapes
Creating a Visio mashup requires that you create data shapes and provide data for them to use. In order to complete the following examples, you will need a copy of Visio Premium 2010 and SharePoint 2010 Enterprise. You will also need to install the “Charity Drive” List Template from the Chapter 15 folder of the downloadable content to a site on your SharePoint portal, and then create an instance of the list on your site. The first step in creating your data-driven shape is to link to data sources. The next steps describe how to link the Visio drawing to a data source.
- Open Visio 2010 Premium and select the option to create a blank drawing. You should have an empty canvas ready for your new Visio drawing, as shown in Figure 15-1.
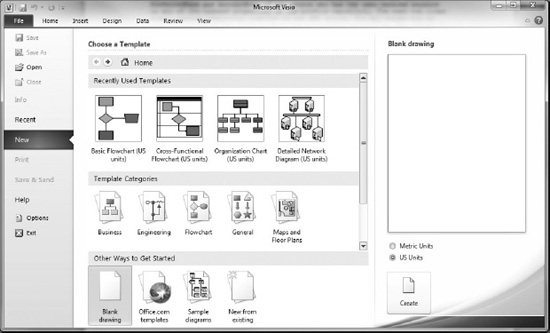
Figure 15-1. Create new Visio diagram.
- Next, open the Data tab on the ribbon and select Link Data to Shapes. In this example you will use a SharePoint list, so select the Microsoft SharePoint Foundation List option, and click Next.
- In the next window, provide the URL to a valid SharePoint site, specifically one that contains the data that you intend to report on your Visio dashboard.
- Click Next, and you will be provided with a listing of the Lists on the site provided. Select the Charitable Drive list, and click Finish.
After you have defined the data sources, you will need to draw the shape and link it to a row of the data source. For this example, you will utilize a Thermometer gradient control to represent progress on the Charity Drive charitable contributions.
- Open the Basic Shapes group and select the 3-D box, dragging it onto the drawing surface.
- Make sure the 3-D shape is selected on the canvas, then right click on the Friends of Chickens record in the External Data window, and click the Link to Selected Shapes option.
- Now that the data and the shape are linked, you need to add the visual data components to the shape. Right-click on the shape and expand the Data sub-menu and select the Edit Data Graphic option.
- Remove the ID field by selecting the row and clicking the Delete button. Select the Title row and click the Edit button to edit the appearance of the data element. On the Edit Item screen, uncheck the Default Position checkbox and then set the Horizontal option to Left and the Vertical option to Top, then select the Heading 1 option in the Style drop-down list.
- Add a new item from the Edit Data Graphic screen, then select the Last Date Checked for the Data Field and Text for the “Displayed as” value. Uncheck the Default Position checkbox and then set the Horizontal option to Center and the Vertical option to Top. In the Details section, set the Border Type to None, and click OK.
- Next, add a new item from the Edit Data Graphic screen, then select the Current Value for the Data Field and Text for the “Displayed as” value. Uncheck the Default Position checkbox; then set the Horizontal option to Center and the Vertical option to Top. In the Details section, set the Value Format to Currency, the Border Type to None, and click OK.
- Finally, add a new item from the Edit Data Graphic screen. Then select the Current Value for the Data Field. This time, set the “Displayed as” value to Data Bar. In the Style list box, select Thermometer. Uncheck the Default Position checkbox; then set the Horizontal option to Center and the Vertical option to Top. Next, under Details, set the Maximum Value to $30,000,000 (without the formatting, so 30000000), then both the Value Position and Label Position to Not Shown, and then click OK.
- The Edit Data Graphic screen should look like Figure 15-2.
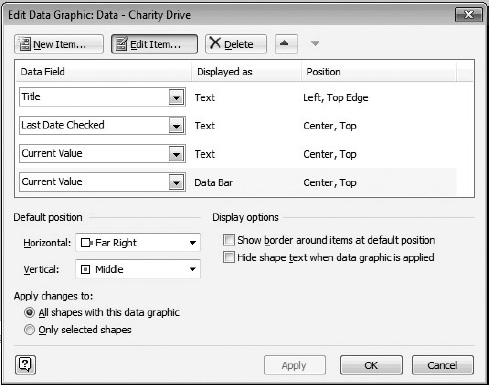
- Click OK on the Edit Data Graphic screen and Visio will update the shape on the canvas with the new settings. The data shape should look something the one in Figure 15-3.
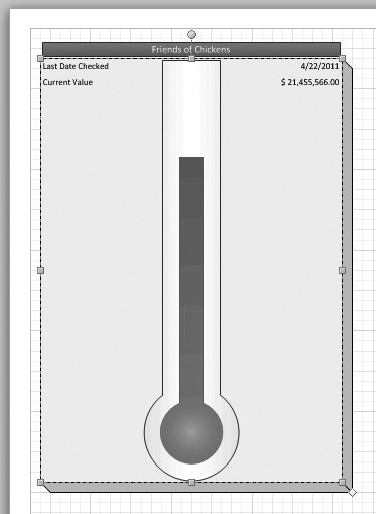
This Visio drawing is now a bona fide data graphic and ready for a SharePoint Mashup. This particular example is very simplistic, but it gives the general idea of what is possible with Visio data shapes. The final step is to publish the drawing as a web drawing into SharePoint. The following steps describe how to publish a web drawing from Visio:
- In Visio, open the file panel and click the Save & Send option.
- Select the Save to SharePoint option, then click “Browse for a location” and select Web Drawing (*.vdw) under File Types. Finally, click the Save As button.
- Save the document to a Shared Documents Library on your SharePoint site.
Now you can open the Visio Drawing in the browser or view it in a Visio Web Access Web Part. So now that you have a published Visio data shape, in order to make it interactive with the user through the browser, you need to learn about the Visio Services JavaScript Mashup API.
Visio Services JavaScript Mashup API
The Visio Services JavaScript Mashup API provides the means for web developers to write scripts that allow users to interact with the Visio diagram using a web browser. This interaction goes beyond just viewing the contents of the diagram; it actually allows for other components on a web page to have content driven by or drive the appearance of the drawing. JavaScript is easy to learn; however, the discussion of how to write and use it is beyond the scope of this book. I will assume that you, the reader, have a firm grasp on the fundamentals and are ready to plunge into the following sections that describe the objects and events that comprise the Visio JavaScript API.
The objects that make up the JavaScript API are logical representations of the underlying components in the Visio document. These objects are organized hierarchically to allow the user to interact with the drawing starting at the Web Part level, moving into the page, then a Shape collection, and finally an individual shape. The following tables describe each of the JavaScript objects.
Control Object
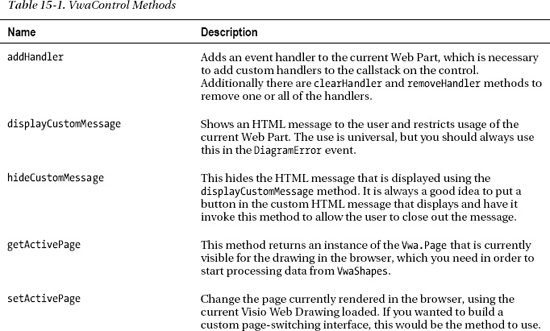
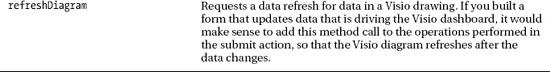
The VwaControl represents the actual Web Part that is hosting the drawing—rather, it’s the Visio Web Access Web Part encapsulated for the browsers scripting engine. This class provides the primary access point for interacting with the web drawing. The methods and events provide the functionality that allows the developer to tap into and respond to the user with actions that leverage the information in the Visio drawing. Table 15-1 describes several of the more common methods that a developer can use to interact with the Visio diagram.
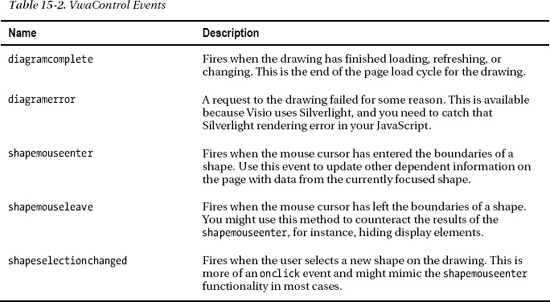
The events associated with the VwaControl are the most important component when dealing with the JSOM. These events provide the passages into the actions that occur in the lifecycle of the Web Part to permit the developer to interact with it. So when developing a mashup, you will need to tap into this lifeline of the Visio Web Part on the page in order to execute the functionality you desire; see Table 15-2.
![]() Best Practice Recognizing the order of the events on the page is important to understanding when to perform certain operations. It doesn’t make sense to start performing operations that involve objects on the diagram before the diagram has completed loading in the browser. Analyze the operations you need to perform and map them into the lifecycle appropriately. This will also save on unnecessary asynchronous calls to the SharePoint server.
Best Practice Recognizing the order of the events on the page is important to understanding when to perform certain operations. It doesn’t make sense to start performing operations that involve objects on the diagram before the diagram has completed loading in the browser. Analyze the operations you need to perform and map them into the lifecycle appropriately. This will also save on unnecessary asynchronous calls to the SharePoint server.
Page Object
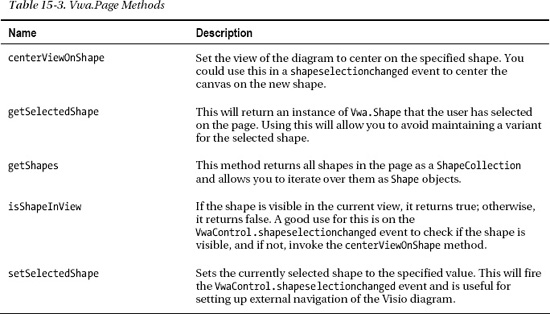
The Vwa.Page represents the current page that is loaded into the viewable space of the Visio Web Access Web Part. This object provides methods for interacting with the page, as well as gaining access to the shapes on the page (see Table 15-3). There are no events for the page object, since only the VwaControl object handles events.
Shape Collection
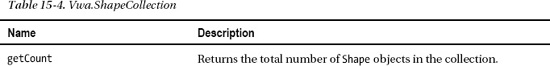
The Vwa.ShapeCollection reveals a collection of Vwa.Shape objects to the Vwa.Page so that the developer can discover the shapes on a page. This class allows the developer to find and provide an instance of an existing shape on the page but won’t allow the developer to add new shapes to the page. It’s helpful if you need to list out the shapes for navigation or something similar; see Table 15-4.
Shape Object
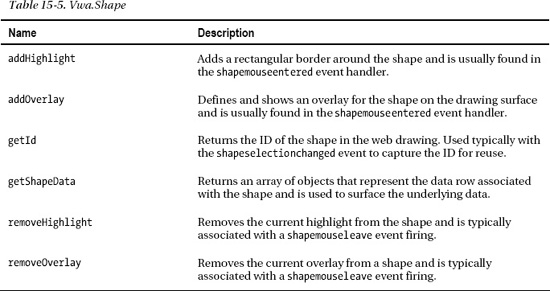
The Vwa.Shape class (Table 15-5) represents an individual Shape object on the Visio drawing. The methods in this class provide access to the underlying shape data and some that will allow visual cues to be created on the shapes.
![]() Note It’s important to recognize here that the
Note It’s important to recognize here that the addOverlay method has several parameters, as you will see in the following example. The second argument is a string variant that requires XAML formatted output if the Visio Display Mode is using Silverlight, which is the default mode in any browser with a Silverlight plug-in. Recognizing this will save you some debug time in trying to figure out why your perfectly formatted XHTML is causing a very strange error.
So let’s look at some code in action. Please notice in Listing 15-1 that “{WebPartID}” needs to be replaced by the actual ID of the Visio Web Access Web Part on the rendered page. This is done by viewing the source of the SharePoint Web Part page on which the Web Part resides, and then searching for the Web Part title (the ID will be close by). The good news is that you should only have to figure out what this ID is the first time.
Listing 15-1. SharePoint JSOM for Visio Web Parts
<script type="text/javascript">

Sys.Application.add_load(App_Load);


var Exception;

var WebPart;

var Page;

var Shapes;

var CurrentShape;


function App_Load()

{

   try

   {

      WebPart = new Vwa.VwaControl ("{WebPartID}");

      WebPart.addHandler ("diagramcomplete", Diagram_Complete);

      WebPart.addHandler ("diagramException", Diagram_Exception);

   }

   catch (e)

   {

      Exception = e;

   }

}


function Diagram_Complete ()

{

   try

   {

      Page = WebPart.getActivePage ();

      Shapes = Page.getShapes ();

      CurrentShape = Page.getSelectedShape ();


      WebPart.addHandler ("Shapeselectionchanged", Shape_SelChanged);

      WebPart.addHandler ("shapemouseenter", Shape_MouseEnter);

      WebPart.addHandler ("shapemouseleave", Shape_MouseLeave);

   }

   catch (e)

   {

      Exception = e;

   }

}


function Diagram_Exception ()

{

   WebPart.displayCustomMessage ("Exception: " + Exception);

}


function Shape_SelChanged (id)

{

        if (CurrentShape != null)

       {

            CurrentShape.removeHighlight ();

       }


   CurrentShape = Page.getSelectedShape ();

   CurrentShape.addHighlight (5, "#FF0000");

}


function Shape_MouseEnter (source, id)

{

   try

   {

      Shapes = Page.getShapes ();

      var shape = Shapes.getItemById (id);

      var shapeData = shape.getShapeData ();


      var shapeInfo = '';


// iterate through all data fields and add them to the overlay


      for (var i = 0; i < shapeData.length; i++)

      {

         var field = shapeData[i].label;

         var value = shapeData[i].formattedValue;


         shapeInfo = shapeInfo + field + ' = ' + value + '<LineBreak/>';

      }


      shapeInfo = '<ContentControl Width="300"><TextBlock TextWrapping="Wrap">'+shapeInfo+'</TextBlock></ContentControl>';


// Add the overlay to the shape, using the div element as content

      shape.addOverlay (

         'dataoverlay',                 // id of the overlay

         shapeInfo,                     // XAML content to display

         Vwa.HorizontalAlignment.right, // horizontal alignment

         Vwa.VerticalAlignment.middle,  // vertical alignment

         300,                           // 300 pixels wide

         300);                          // 300 pixels tall


   }

   catch (e)

   {

      Exception = e;

   }


}


function Shape_MouseLeave (source, id)

{

   try {

      var shape = Shapes.getItemById (id);

      shape.removeOverlay('dataoverlay'),

   }

   catch (e)

   {

      Exception = e;

   }

}

</script>
![]() Best Practice The first event fired for the Web Part is the
Best Practice The first event fired for the Web Part is the diagramcomplete event, but in order to handle this event, you must be sure to add a handler before it fires. The best way of doing this is to add a handler to the AJAX Sys.Application.Load event.
In this example, you added a handler to the ApplicationLoad event from the AJAX event model and used that handler to instantiate the visiowp object with your Visio Web Access Web Part. After that, you can start adding handlers for the diagramcomplete and diagramerror handlers. Notice that you don’t bother with Page or Shape objects at this point because they are not available until the diagramcomplete event has fired, which is the next stop in the page lifecycle. In the diagramcomplete handler, the Visio drawing has fully loaded into the browser, and the developer has access to all of the Visio API objects. This is where you will need to initialize the mashup functionality and start laying the groundwork for user interactions, such as adding handlers to the shapeselectionchanged, shapemouseenter, and shapemouseleave events.
In the Shape_SelChanged method, you provide functionality to execute when a new shape is selected. In this simple case, you are removing the highlight from the previous shape and adding it to the new shape. This method would also be a good place to interact with other elements on the page, such as a service call to gather updated information based on data for the new shape. In the final section of this chapter, you will use this event handler to provide filter data from a list using the Client Object Model.
The Shape_MouseEnter and Shape_MouseLeave methods provide functionality to add overlays based on the shape that has the mouse cursor over it. It’s important to note with these two handlers that you wouldn’t want to perform an action that requires much time to complete, because it may only be a few seconds from the time the mouseenter fires to when the mouseleave fires.
![]() Best Practice With
Best Practice With shapemouseenter and shapemouseleave, it’s best to limit yourself to operations that are stateful. This would include showing or revealing information with the mouseenter and hiding information with the mouseleave. If you try to make the these events do anything else, such as a long running process (which on the Web tends to be anything greater than 30 seconds), calculations, or callbacks, you run the risk that multiple objects on the page will fire simultaneous requests and cause unexpected visual consequences.
Excel Driven Dashboards
Microsoft Office Excel, at its simplest, is a spreadsheet or simple database tool. Over the years, Microsoft has extended this tool to allow more powerful and dynamic data analysis using formulas, charts, and most recently, PowerPivot. Excel has a grand 30-year history of being one of the best spreadsheet applications on the market; with the introduction of Excel Services for SharePoint 2007, Microsoft took this tool to the Web.
As usual, the 2010 version of Excel provides the world with even more power and flexibility for data analysis, and right along with it, SharePoint 2010 has gone to a new level of support for the product through Excel Services 2010. For the business intelligence developer, these components are crucial to providing the rich interactive experience that you are looking to leverage through mashups and dashboards in SharePoint 2010. The JavaScript Object Model (JSOM) for Excel provides the same granular interaction to spreadsheets that the Visio Mashup API provides to diagrams, and the REST API provides read and update capabilities with documents through a web service. Since everyone pretty much knows how to create data in Excel and upload it into SharePoint 2010, I will skip ahead and just cover the JSOM. If you are curious about using Excel files in SharePoint 2010 or have not done it before, I recommend the following resource: http://bit.ly/ivvde5
![]() Note I have often found that Excel is the first tool implemented in department-level solutions. For this reason, in many cases it’s often enough to load Excel documents from a network file share into SharePoint 2010 and utilize Excel Services to get a BI project off the ground.
Note I have often found that Excel is the first tool implemented in department-level solutions. For this reason, in many cases it’s often enough to load Excel documents from a network file share into SharePoint 2010 and utilize Excel Services to get a BI project off the ground.
JavaScript Object Model (JSOM) for Excel
The JSOM for Excel provides the web developer with a means to read and update information in an Excel spreadsheet displayed on a SharePoint Web Part page using the Excel Web Access Web Part. Using the JSOM, the developer will have access to sheets, ranges, tables, PivotTables, and charts found in the Excel document. Using these tools, you can extend the information in the Excel document to affect other portions of a web page, to make web service calls, or even to update or change the appearance of the contents in the document.
Control Object
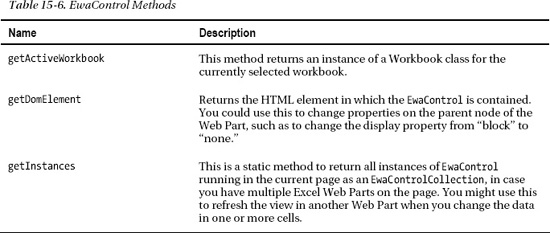
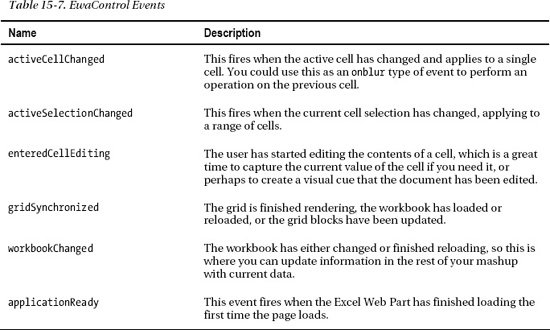
The EwaControl class represents an Excel Web Access Web Part on a page. This object instance is the entry point for working with Excel documents using the JavaScript Client Object Model. The methods and events provided by this class will permit interaction with one or more workbooks, sheets, and other components from Excel Services; see Table 15-6 and 15-7.
Workbook Object
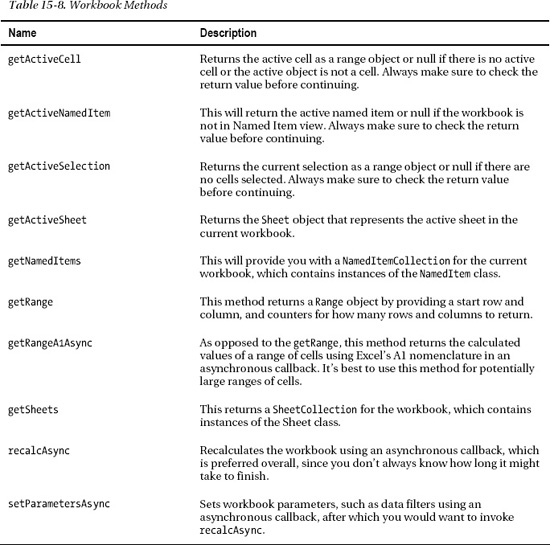
The Workbook class represents an instance of an Excel Workbook on the server and provides access to all of the objects contained in the workbook. This is the primary object that will be used throughout a JSOM application using Excel; see Table 15-8.
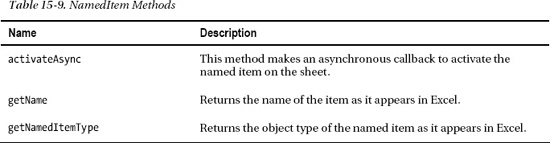
NamedItem Object
The NamedItem class represents a named item in an Excel document and may include cell ranges, tables, parameters, charts and PivotTables; see Table 15-9.
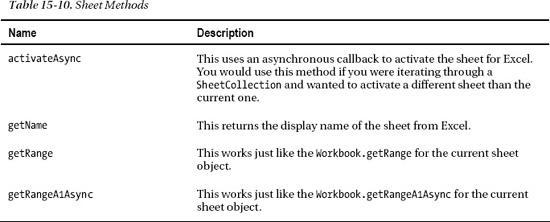
Sheet Object
The Sheet class represents an instance of a worksheet or chart sheet object in an Excel workbook. Sheets that are hidden will not be available to Client JSOM in SharePoint; see Table 15-10.
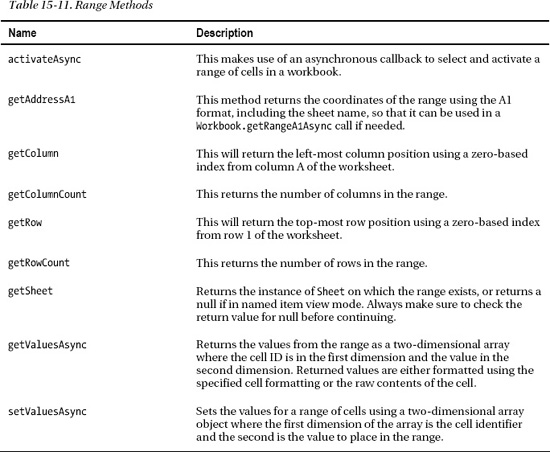
Range Object
The Range class represents a range of cells in a Workbook object; see Table 15-11. The range uses the A1 nomenclature from Excel and can identify one or more cells. This class is useful for defining ranges and performing on-the-fly calculations out of the document and displaying the values in HTML DOM elements. Since the API doesn’t have a Cell object, the Range object may actually represent only a single cell on the document.
REST API
A discussion of the programming around Excel Services would not be complete if I didn’t mention the REST API for Excel Services. Unfortunately, describing the REST API for Excel or SharePoint in general really deserves an entire book of its own, so I will only discuss this in light detail, and trust that you, the reader, will become inspired to read a book or the many MSDN articles on this topic.
Representational State Transfer (REST) is not a new concept on the World Wide Web, having been introduced in 2000. The purpose of REST is to leverage the strengths of the HTTP protocol to perform commanded operations, rather than building defined endpoints that you see in traditional SOAP-based web services. In a SOAP service, you would create an ASMX file, for instance, and then define several methods with the [WebMethod] attribute to allow external calls to that method. In REST-ful services, you have a single endpoint that receives a packet of information and performs operations based on the HTTP method: GET, PUT, POST and DELETE. Using this model, SharePoint 2010 can also return strongly typed results to the calling point. Thus, REST services in SharePoint 2010 are a very nice addition because it’s very easy to make a call to a web service, drop some data in the request, and then send it off with the command you want to execute.
For Excel Services, the implications are almost mind-numbing. Applications can request specific ranges or objects like charts out of Excel documents, and you can use the PUT and POST commands to modify the information in that Excel document. As mentioned, entire volumes could be written on the REST API for SharePoint 2010; I hope you will find some time to sit down and read one of them.
Putting it all Together—Help Desk Mashup
Now that we have discussed the various components that comprise the SharePoint 2010 Insights, you are going to build a composite, or mashup, using several of them. For the purposes of this book, you’ll bring a few of these tools together, but in a real-world environment, you would need to assess the strengths of each and use them logically to meet your needs. For this example, you’re going to leverage Visio on a page and throw in Bing Maps just for fun. You’re going to build a Help Desk dashboard for a company that is currently viewing their Help Desk metrics with an Excel document. The company has 9 locations on the east coast of the United States and the Help Desk must provide support to all locations. You’ll use the Visio Help Desk Flow Template available from http://visio.microsoft.com/en-us/Templates_And_Downloads/Sample_Diagram_Templates/Pages/Help_Desk_Flow.aspx
Excel Data Source
The Excel document in this example is going to be the metrics data source. You will assume that your fictitious company has a robust SQL Server back end and that they exported the metrics to an Excel document for reporting purposes only. In order for the Visio to work as expected, the data will show only the desired data components, such as the number of calls, the average wait time at each tier, the percentage of calls that reach the tier that are resolved by the tier, and the percentage of all calls resolved by the tier for all calls. This data must be stored in SharePoint Document Library in order to act as a valid source for the Visio document. The following steps describe how to create the Excel Data Source:
- Open Microsoft Office Excel (preferably 2010 version, but 2007 should work fine).
- In cells A1 through G1, put the following values:
- Step
- Number of Calls
- Average Wait Time
- % Resolved
- % Total Resolved
- % Transferred
- Average Time on Call
- In cells A2 through A7, place the following values:
- For all of the other values, you can make numbers up. It should look something like Figure 15-4.
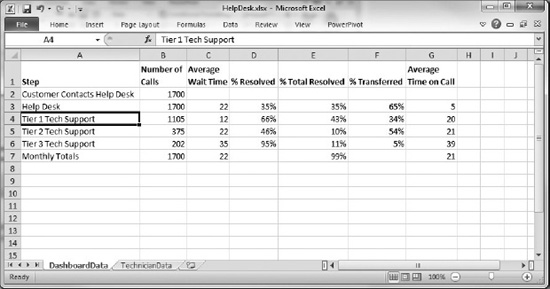
Figure 15-4. The Help Desk metrics spreadsheet
Once the data source is uploaded and published to the Document Library, you can continue.
List Data Source
In order to highlight the ability to pull data from multiple sources and tying them together using the JavaScript Client Object Model and Services, I have set up a List of Technicians. When a user clicks on one of the support tiers in the Visio diagram, It will filter the list of technicians. Each technician operates at one of the 9 locations, with 14 technicians in total. Figure 15-5 shows how the data appears in the SharePoint List view.
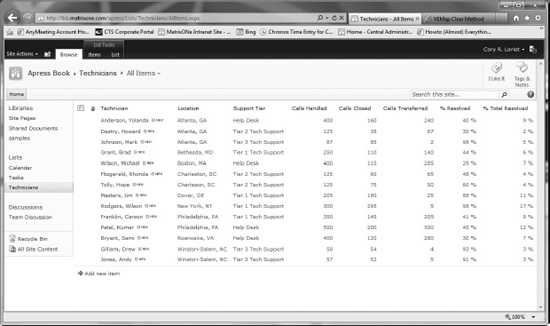
Figure 15-5. Technicians and locations SharePoint List
Visio Dashboard
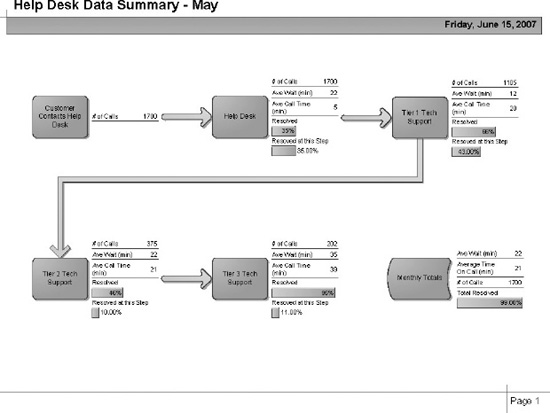
The Visio Dashboard will show the relevant information for your Help Desk metrics. The diagram will indicate the flow of help calls from the beginning of the process through to the end, and then provide totals for all of the numbers. Each shape will contain data relevant to that step of the process and will use status bars to indicate how well each level is doing. Since setting up a Visio data-driven dashboard was discussed in a previous section, I am not going to go into detail here. Figure 15-6 is an image of the Visio Diagram that will be uploaded to the SharePoint site. A copy of this Visio document has been provided in the downloadable content included as part of the book.
Interestingly enough, by combining the Excel document data source with the Visio dashboard and uploading them both to SharePoint 2010, you have already met the minimum requirements for a composite or mashup in SharePoint 2010. However, in this chapter you are learning about going beyond the OOTB capabilities, so let’s continue by writing some JavaScript to pull data out of the Visio document and light up the dashboard.
The Glue: JavaScript
The JavaScript Object Model provides the necessary component to tie all of the pieces together, thus it is the glue. When the user clicks on one of the data objects, it will highlight the object and feed the information to read the list of technicians and display them in a div. You are also going to use JavaScript to interact with the Bing API and place overlays on the map for each location that the company has an office. When the user clicks on one of the technicians, the map will zoom to their office location. So let’s look at the JavaScript code in Listing 15-2; it will be described it in more detail at the end.
Listing 15-2. JavaScript Mashup Code using JSOM
<script src="http://ecn.dev.virtualearth.net/mapcontrol/mapcontrol.ashx?v=6.2" type="text/javascript"></script>


<script type="text/javascript">

Sys.Application.add_load(App_Load);


var Exception = null;

var WebPart = null;

var Page = null;

var Shapes = null;

var CurrentShape = null;


var ContentEditor = null;

var ContentEditorDisplayPanel = null;

var ContentEditorMapPanel = null;


var SelectedSupportTier = null;

var Context = null;

var Web = null

var List = null;

var Query = null;

var ListItem = null;

var ListItemCollection = null;


function App_Load()

{

   try

   {

      WebPart = new .Control ("WebPartQ2");

      WebPart.addHandler ("diagramcomplete", Diagram_Complete);

      WebPart.addHandler ("diagramException", Diagram_Error);


      ContentEditor = document.getElementById("WebPartQ3");

      ContentEditorDisplayPanel = document.createElement("div");

      ContentEditorDisplayPanel.setAttribute("id", "TechnicianResults");


      ContentEditorMapPanel = document.createElement("div");

      ContentEditorMapPanel.setAttribute("id", "MapResults");

      ContentEditorMapPanel.setAttribute("style", "position: relative; width: 400px; height: 400px;");


      ContentEditor.appendChild(ContentEditorDisplayPanel);

      ContentEditor.appendChild(document.createElement("br"));

      ContentEditor.appendChild(ContentEditorMapPanel);


      GetMap();

      FindLoc("Winston-Salem, NC", "Headquarters");

   }

   catch (e)

   {

      Exception = e;

   }

}


function Diagram_Complete ()

{

   try

   {

      Page = WebPart.getActivePage ();

      Shapes = Page.getShapes ();

      CurrentShape = Page.getSelectedShape ();


      WebPart.addHandler ("shapeselectionchanged ", Shape_SelectionChanged);

   }

   catch (e)

   {

      Exception = e;

   }

}


function Diagram_Error ()

{

   WebPart.DisplayCustomMessage ("Error: " + Exception);

}


function Shape_SelectionChanged (source, id)

{

   try

   {

      Shapes = Page.getShapes ();

      CurrentShape= Shapes.getItemById (id);

      var ShapeData = CurrentShape.getShapeData ();


      for (var i = 0; i < ShapeData .length; i++)

      {

         var fieldName = ShapeData [i].label;


         if (fieldName == 'Step')

         {

            SelectedSupportTier  = ShapeData [i].formattedValue;

         }

      }


      GetTechnician();

   }

   catch (e)

   {

      Exception = e;

      Diagram_Error();

   }

}


function GetTechnician ()

{

   Context = new SP.ClientContext.get_current();

   Web = Context.get_web();

   List = Web.get_lists().getByTitle("Technicians");


   Query = new .CamlQuery();

   Query.set_viewXml('<View><Query><Where><Eq><FieldRef Name="Support_x0020_Tier"/><Value Type="Text">'+ SelectedSupportTier +'</Value></Eq></Where></Query>' +

                       '<ViewFields><FieldRef Name="Title"/><FieldRef Name="Location"/><FieldRef Name="Calls_x0020_Handled"/><FieldRef Name="Calls_x0020_Closed"/>' +

                       '<FieldRef Name="Calls_x0020_Transferred"/></ViewFields></View>'),


   ListItemCollection = List.getItems(Query);


   Context.load(ListItemCollection);


   Context.executeQueryAsync(Function.createDelegate(this, this.LoadSucceeded), Function.createDelegate(this, this.LoadFailed));

}


function LoadSucceeded(sender, args)

{

   var ListItemEnumerator = ListItemCollection.getEnumerator();


   ContentEditorDisplayPanel.innerHTML = '';


   var Table = document.createElement("table");

   Table.setAttribute ('border', '0px'),

   Table.setAttribute ('cellacing', '0px'),

   Table.setAttribute ('cellpadding', '3px'),


   var HeaderRow = document.createElement('tr'),

   HeaderRow.setAttribute ('class', 'ms-viewheadertr ms-vhltr'),

   var TechnicianCell = document.createElement('th'),

   var LocationCell = document.createElement('th'),

   var CallsHandledCell = document.createElement('th'),

   var CallsClosedCell = document.createElement('th'),

   var CallsTransferredCell = document.createElement('th'),


   TechnicianCell.innerHTML = 'Technician';

   LocationCell.innerHTML = 'Location';

   CallsHandledCell.innerHTML = 'Calls Handled';

   CallsClosedCell.innerHTML = 'Calls Closed';

   CallsTransferredCell.innerHTML = 'Calls Transferred';


   HeaderRow.appendChild(TechnicianCell);

   HeaderRow.appendChild(LocationCell);

   HeaderRow.appendChild(CallsHandledCell);

   HeaderRow.appendChild(CallsClosedCell);

   HeaderRow.appendChild(CallsTransferredCell);


   Table.appendChild(drHeaderRow);


    while (ListItemEnumerator.moveNext())

    {

       ListItem = ListItemEnumerator.get_current();


       var drTechnicianRow = document.createElement("tr");

       TechnicianRow.setAttribute ('class', 'ms-itmhover'),

       TechnicianRow.setAttribute ('onclick', 'FindLoc ("' + ListItem.get_item("Location") + '", "' + ListItem.get_item("Title") + '");'),


       TechnicianCell = document.createElement("td");

       LocationCell = document.createElement("td");

       CallsHandledCell = document.createElement("td");

       CallsClosedCell = document.createElement("td");

       CallsTransferredCell = document.createElement("td");


       TechnicianCell.innerHTML = ListItem.get_item('Title'),

       LocationCell.innerHTML = ListItem.get_item('Location'),

       CallsHandledCell.innerHTML = ListItem.get_item('Calls_x0020_Handled'),

       CallsClosedCell.innerHTML = ListItem.get_item('Calls_x0020_Closed'),

       CallsTransferredCell.innerHTML = ListItem.get_item('Calls_x0020_Transferred'),


       TechnicianRow.appendChild(TechnicianCell);

       TechnicianRow.appendChild(LocationCell);

       TechnicianRow.appendChild(CallsHandledCell);

       TechnicianRow.appendChild(CallsClosedCell);

       TechnicianRow.appendChild(CallsTransferredCell);


       Table.appendChild(TechnicianRow);

   }


   ContentEditorDisplayPanel.appendChild(Table);

}


function LoadFailed(sender, args)

{

   alert('Failed to load'),

}


var BingMap = null;

var Coordinates = "";


function GetMap() {

   try {

      BingMap = new VEMap("MapResults");

      BingMap.LoadMap();

   } catch (e) {

      alert(e.message);

   }

}


function GetSearchResult(layer, resultsArray, places, hasMore, veErrorMessage) {

   Coordinates = places[0].LatLong;

}


function FindLoc(location, technician) {

   try {

      BingMap.Clear();

      BingMap.Find(null, location, null, null, 0, 1, true, true, false, true, GetSearchResult);

      window.setTimeout(function() { AddPushpin(location, technician); }, 1000);

   } catch (e) {

      alert(e.message);

   }

}


function AddPushpin(location, description) {

   var shape = new VEShape(VEShapeType.Pushpin, Coordinates);


   BingMap.ClearInfoBoxStyles();

   shape.SetTitle('<h4>' + description + '</h4>'),

   shape.SetDescription(description + ' - ' + location);

   BingMap.AddShape(shape);

}

</script>
There’s a lot going on in this code. The first thing you do is create the App_Load method to set the stage for the rest of the operations. This will be used to wire up the events for the Visio Web Access Web Part (WebPartWPQ2) and then add some DOM elements to the Content Editor (WebPartWPQ3) that is hosting the script. The method closes out by initializing your map in the MapResults div that was created in your Content Editor Web Part.
The next event in the lifecycle of the page will be the Diagram_Complete handler, which wires up the last of the events, Shape_MouseEnter. When the user moves the cursor over one of the Visio Shapes, the Shape_MouseEnter will use the Client JavaScript Object Model to initialize a collection that roughly resembles an SPListItemCollection and then performs an executeQueryAsync callback to the SharePoint Services, passing the CAML query. The CAML query is designed to select all of the SPListItems from the Technicians list that have a Support Tier matching the Step of the current shape on the Visio page.
After the callback executes, either the LoadSucceeded or LoadFailed methods will be called. The purpose of each of these is pretty much self-explanatory, but suffice to say, I prefer it when the LoadSucceeded fires and execution continues normally. LoadSucceeded performs some JavaScript DOM work to add a table with headers, and then adds rows dynamically for each Technician returned in the ListItemCollection. For each row created, an OnClick attribute is added that will make the FindLoc method call.
FindLoc is the entry point for centering the map on a location and adding a pinpoint to the location. When this invokes, the map will center and provide the pinpoint with a tooltip showing the technician name and location. Ultimately, the finished product should look something like the Figure 15-7.
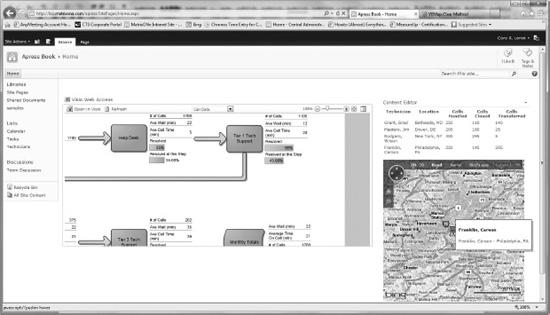
Figure 15-7. The finished product
Conclusion
In this chapter you learned how to take the out-of-the-box Business Intelligence capabilities of SharePoint 2010 and extend them to make a rich and dynamic dashboard. Whether you’re using Visio, Excel, or PerformancePoint, the possibilities for customization really rely on the imagination of those envisioning the project. Using an Excel file, a SharePoint List, and a Visio Web Drawing, you were able to combine previously unrelated data together, and then use an external service like Bing Maps to help make the data relevant. I sincerely hope that you have developed an appetite for the information in this chapter and are inspired to delve further into the deep world of SharePoint Insights and Composites more thoroughly.