
Chapter 9
Credit Markets
Credit Market Snapshot
History: The largest components of the credit derivatives market today are the credit default swaps (CDS) and the closely related synthetic collateralized debt obligations (CDOs). Many assume that the credit derivatives market began with the introduction of CDS in the mid 1990s, but earlier, predecessor products, including letters of credit, bond insurance policies, and certain types of total return swaps had existed for some time and serve many of the same purposes. Nevertheless, the advent of CDS was a watershed event. The earliest CDS allowed commercial banks to transfer the credit risk associated with their loan portfolios to third parties. By the early 2000s, the CDS market was expanding rapidly, driven in large part by standardization, advances in computational power, and evolved thinking on the management of credit risk. During the past decade, CDS have been used to create several varieties of structured products, to arbitrage capital market inefficiencies, and to both hedge and speculate on corporate, municipal, and government fiscal health. They were also used to create exposure to the mortgage market and to protect holders of mortgage-backed securities. CDS became the focus of considerable interest with the onset of the credit crisis of 2007–2009.
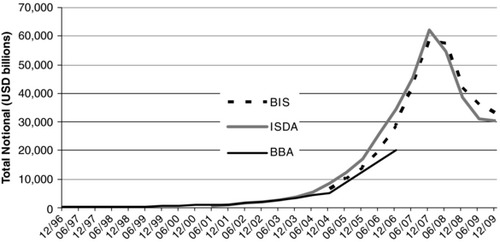
Size: Prior to 2004, the market was of trivial size in comparison to the markets for other types of derivatives. But from a size of $6.4 trillion in notional amount in 2004, it grew to over $60 trillion by the end of 2007, before falling back to $32.7 trillion in 2009. Approximately half of the growth was driven by index trades.
Products: The most basic and widely-traded credit derivatives are credit default swaps (CDS). Other common structures include credit spread options, bond options, total return swaps, index swaps, basket default swaps, synthetic collateralized debt obligations, and credit-linked notes (which are not derivatives themselves, but, rather, are securities that contain embedded credit derivatives).
First Usage: It is reported that the first credit default swap was written in 1994 between J.P. Morgan (now JPMorgan Chase) and the European Bank for Reconstruction and Development (EBRD). The contract was written to shift the credit risk on a $4.8 billion Exxon line of credit from J.P. Morgan to the EBRD. At the time, J.P. Morgan was concerned about the financial impact on Exxon from the 1989 Exxon Valdez oil spill.
Selection of Significant Events
1992: Bankers Trust leads the way in emerging market credit spread options. Though these transactions pre-date the first CDS contracts, they fit squarely within the definition of credit derivatives, as they were documented as ISDA contracts and provided for payments based on the credit spreads of the reference assets. Some transactions were based on the spreads between Brady Bonds and U.S. Treasury securities, others on the relative spreads of Brady Bonds and local-currency securities issued by the same sovereigns. Deals were done in “unfunded” derivative and credit-linked note form.
1997: J.P. Morgan closes its First BISTRO transaction.1
1998: The Financial Accounting Standards Board publishes FAS 133, which requires reporting entities to record most derivatives contracts at fair value on their balance sheets and to record changes in fair value in their income statements. The resulting disconnect between the accounting treatment of CDS and instruments with similar economic features (e.g., corporate bonds and loans, funded CDOs) serves as a source of structuring challenges and opportunities and an impediment to growth at the margin.
1998: TRS (total return swaps), already an important source of financing for hedge funds, become a source of interbank financing during the LTCM (Long-Term Capital Management) crisis. This was largely the result of the ease of execution, accounting, and regulatory capital advantages of TRS relative to comparable sources of financing (e.g., secured loans, repo). One of my first significant transactions upon joining the credit derivatives desk was arranging a TRS facility for an American bank, provided by a major European bank.
1999: Several major banks begin making markets in single-name corporate CDS.
2000: The first bespoke synthetic CDOs are traded.
2001–2002: Enron and WorldCom file for bankruptcy.
2003: ISDA publishes the 2003 Credit Derivatives Definitions.
2005: Market-implied correlation declines sharply, especially at the equity level of the capital structure, as a result of the downgrade and corresponding spread widening of GM and Ford.
2007: Market-implied correlation increases sharply, especially at the senior levels of the capital structure, as a result of the failure of the Canadian asset-backed commercial paper (“ABCP”) market. The Canadian conduits that issued the ABCP were large sellers of protection on the “super senior” tranches of corporate synthetic CDOs. On a fundamental level, the failure of the Canadian ABCP market serves a reminder of the interconnectedness of markets, especially in times of stress. The spike in correlation, however, is more driven by a technical concern—the prospect of hundreds of billions of super senior risk coming back to the banks.
2008: Losses on ABS CDOs, especially those with significant exposure to the mezzanine tranches of sub-prime securitizations, puts into motion the demise of several of the largest insurance companies in the United States. The downgrade of AIG triggers collateral-posting requirements that it was unable to meet, leading to a government bailout. Monoline insurers including MBIA and Ambac are also downgraded, but without a short-term liquidity crisis, as their downgrade-contingent collateral requirements are limited.
2009: MBIA and Ambac, with the support of their regulators, are each split in two, pursuant to “good bank/bad bank” restructurings.
2008–2010: Litigation filed within the Lehman Brothers bankruptcy proceeding raises legal questions with significant potential impact on the derivatives markets generally, and the credit derivatives markets in particular. Two points of contention are the assessment of early termination values for portfolios of credit derivatives and the enforceability of default-contingent subordination of a swap counterparty's claims.
2010: The Dodd–Frank Wall Street Reform and Consumer Protection Act is enacted, effecting sweeping changes on the financial markets. Subject to details to be determined by regulation, the act will have a major impact on derivatives products and markets.
Best Providers (as of 2009): J.P. Morgan was named by Global Finance magazine as the best Credit Derivatives Provider in North America and Europe, while Deutsche Bank received the same rank in Asia. Other dealers who have maintained a significant presence through and after the financial crisis of 2007–2009 include Morgan Stanley, Barclays, and BNP Paribas.
Applications: Credit derivatives can be used for hedging company-specific credit risk or market-wide credit spread movements, to effect outright shorts, to diversify exposure, to enhance portfolio yields, to engage in arbitrage and relative value strategies, and to access new asset classes.
Users: Major buyers and sellers of credit derivatives include banks, securities firms, insurance companies, and hedge funds. Participation by pension funds, non-financial corporations, and mutual funds has been limited.
INTRODUCTION
As recently as early 2007, most Americans had never heard the terms “credit derivative” or “credit default swap,” despite the fact that the estimated size of the global credit derivatives market stood at more than $40 trillion in notional amount, more than the size of the global markets for corporate, municipal, and sovereign debt combined. As shown in Exhibit 9.1, the market would go on to peak in size at about $60 trillion at the end of 2007.
Exhibit 9.1 Size of the Credit Derivatives Market
Sources: International Swaps and Derivatives Association (ISDA), British Bankers Associations (BBA), and Bank for International Settlements (BIS).
Early on, I can recall in conversations having to say “credit derivatives” at least twice, and depending on the age and career background of the person I was talking to, describing them as “virtual bonds” or “bankruptcy insurance” (always being sure to add that for legal and regulatory purposes derivatives are not insurance). By late 2008, however, when the topic of what I did came up in conversation, almost every lay person was able to identify credit derivatives as the “weapons of mass destruction”2 that “wrecked the economy,” caused people to lose their homes, and enriched a few “greedy Wall Street manipulators” at the expense of everyone else.
Regrettably, such perceptions inform much of what we hear about credit derivatives from the media, business leaders, and political leaders. Newsweek, for example, called credit derivatives “The Monster That Ate Wall Street.”3 As of the time of this writing, even the Wikipedia entry states “in plain language, a credit derivative is a wager … [s]imilar to placing a bet at the racetrack.” Sometimes the stories provide a distinction between the “good” credit derivatives, which are used by banks to manage risk and the “bad” ones, which apparently are the trades where AIG or some other major institution lost money. Sometimes no such distinction is provided. Congresswoman Maxine Waters, for example, in advocating a ban of credit derivatives trading, said that “preventing all credit-default swaps is essential to bringing stability to the market.”
The purpose of this chapter is to describe in more detail the history, major developments, product innovations, and applications of credit derivatives over the past 15 years. It is written from the perspective of someone who began structuring credit derivatives products in 1998, who traded the products on both the buy side and sell side, and who continues, at the time of this writing, to work in the area as an independent advisor. The discussion is almost entirely focused on corporate credit derivatives and tends to focus on synthetic collateralized debt obligations (CDOs), which have been a critical contributor to the growth of the more liquid and single-name CDS products. One key goal of this chapter is to give the reader a clear understanding that credit derivative technology serves an important function in allowing for an unprecedented ability to manage and distribute credit risk and in providing valuable price information. While policy changes aimed at improving transparency and reducing systemic risks involved in trading large volumes of the standardized products may help the stability of the financial system, if and only if done correctly, proposals aimed at stifling innovation, or even worse, turning back the clock by banning the basic products, are not likely to help.
The next section illustrates that contracts resembling credit derivatives have a long history. Two predecessor products are discussed, with a discussion of the key differences that distinguish the modern instruments known as credit derivatives. Following that, I discuss applications, with an emphasis on risk transfer across financial institutions. Later I discuss first- and second-generation products, respectively, with some anecdotes weaved in. The chapter concludes with some thoughts on where the market for this product might be going.
PREDECESSOR PRODUCTS
Letters of Credit
The letter of credit (LC) is a traditional commercial banking product known to exist at the turn of the twentieth century. Under an LC, an insured debtor pays a bank a periodic fee in exchange for the bank's promise to make payments under a debt, purchase, or other obligation on behalf of the debtor, should the debtor fail to do so. LCs are used as credit support where financial markets or commercial practices require a very high degree of credit quality (such as trade finance or the commercial paper market) or where it is impractical for trade or financial creditors to perform an independent credit analysis of the issuer.
Municipal Bond Insurance
Municipal bond insurance, also known as financial guaranty insurance, is a product that bears significant economic similarity to a credit derivative. Under a typical contract, the issuer pays a premium to an insurance company in exchange for its commitment to provide scheduled interest and principal repayments on the bond in the event of the failure of the issuer to do so.
The business of insuring municipal bond investors began, for all practical purposes, in 1971 with the formation of AMBAC.4 MBIA5 was formed two years later, and by the mid 1980s the other two of the big four monoline insurers, FGIC6 and FSA,7 were up and running. By the time ISDA-documented corporate credit derivatives began their growth cycle in the late 1990s, MBIA and AMBAC together were insuring more than $400 billion of municipal bonds and just under $200 billion of other risk, mostly mortgages.
As with letters of credit, a key justification for the existence of municipal bond insurance is the impracticality and large costs associated with each participant in the municipal bond market performing independent credit analysis on multitudes of municipal issuers. Since the advent of the financial crisis of 2007–2009, which among other things, brought on the failure or near-failure of many of the traditional municipal bond insurers, it has been argued that perhaps the primary purpose of municipal bond insurance is the comfort value of knowing that a highly-rated insurer with a staff of capable municipal credit analysts has underwritten a bond and stands to suffer a significant loss of its capital if the issuer fails.
Modern Credit Derivatives versus Predecessors
Although the predecessor products described above bear economic similarity to the credit derivative products of the last 15 years, there are important differences. Perhaps three of most significant are as follows:
1. Standardization: Credit derivatives have always been transacted under documentation produced by the International Swaps and Derivatives Association (ISDA). Though customization has never disappeared, the growth of the marketplace was facilitated by the creation and refinement of documentation standards. The first Credit Derivative Definitions published in 1999 gave the marketplace enough standardization to support the beginnings of an actively traded market. The publication of ISDA's expanded 2003 Credit Derivative Definitions and the birth of the index product in that same year further advanced the process, providing the infrastructure necessary to support the growth that would take place over the next four years.
2. Lack of an “insurable interest” or other relationship between the protection provider and the subject of the contract: Documentation terms do not require that the purchaser of credit protection hold a position in the underlying reference entity or reference obligation. Thus, credit derivatives can be used to effect outright shorts, capital structure arbitrage (e.g., long equity, short debt) or relative value plays (long Ford, short GM). The cash credit markets have little to no ability to short credit.
3. Regulatory status: Credit derivatives are not considered insurance policies and are not regulated as such. Proposals to regulate credit derivatives as insurance contracts8 did not receive broad support during the recent financial reform debates and have been pre-empted by the Dodd-Frank Act. The Act does, however, have the potential to significantly impact the credit derivatives marketplace. Most likely certain credit derivatives will be required to be traded on an exchange or through a clearinghouse, and there will be regulatory requirements with respect to initial and ongoing margin (i.e., collateral), disclosure and reporting, and capital for certain market participants. It is generally believed that LCs and bond insurance will not be subject to comparable regulation.
Each of the preceding factors contributed to the growth of an active market.
APPLICATIONS
Separation of Funding and Credit Risk
The development of the credit derivatives market9 has allowed market participants to separately price and manage funding requirements and credit risk to an extent not possible before. No longer is the holder of a physical asset, such as a bank loan or a bond, required to retain the credit risk of the issuer's default, and no longer is physical ownership of a security required for an investor to earn the returns associated with taking default risk. Put another way, credit derivatives allow for a separation of the decisions with respect to funding and credit risk, allowing those participants who can most efficiently bear liquidity risk to do so while mitigating credit default risk, and allowing those in the best position to bear credit default risk to do so without the need to fund an asset.10
This point is well illustrated by the classic example of a bank purchasing credit default swap (CDS) protection on the borrower under a revolving credit (RC) facility. The typical revolving credit facility for an investment grade borrower starts out as an unfunded commitment on the part of the bank to lend should the borrower require funding during the term of the commitment. In many cases, the expectation is that there will be little to no drawings on the facility as the borrower has access to the commercial paper markets, but unforeseen circumstances, such as an inability to replace commercial paper funding, may create an unanticipated funding need. The commitment fee paid to the bank is often a single-digit number of basis points per annum on the total amount of the commitment. If the facility is drawn upon by the borrower, interest is typically paid at LIBOR plus a utilization spread, which is higher than the commitment fee.
The typical RC facility is a loss-leader for a bank. The commitment fee is typically less than the market spread for the borrower's credit risk in a stand-alone transaction. The utilization spread may be in line with the borrower's credit spread at the time the facility closes, but in states of the world where the borrower draws, one can expect the borrower's credit spread to be higher elsewhere.11 Moreover, even after full syndication, RCs often leave banks with large single-issuer concentrations, which are undesirable from a risk management standpoint and can necessitate large amounts of regulatory and economic capital. Add to this the operational costs and risks of managing a facility in which funds can potentially be drawn upon and repaid frequently. Despite these less-than-compelling economics, commercial banks offer back-up RC facilities to their high-grade customers as part of an overall relationship, in which it is expected that the bank will be compensated by the borrower with more profitable business such as stock and bond issuances, M&A advisory, derivatives, and asset management.
A liquid and transparent market for credit risk gives banks the opportunity to reduce credit exposures while continuing to perform the function of providing liquidity for corporate borrowers. And the CDS pricing mechanism allows banks to rationally evaluate whether particular customer relationships are truly profitable when taken as a whole.
Distribution of Risk to the Capital Markets
On a more macro level, credit derivatives have allowed banks to distribute large amounts of credit risk to other participants in the capital markets. For example, starting in 2000, the banks were large buyers of protection on Enron and WorldCom, two corporate borrowers with large syndicated loan facilities that went bankrupt in 2001 and 2002, respectively. These two issuers had large amounts of bank debt concentrated in the portfolios of the largest U.S. banks. In the world before banks used credit derivatives as a risk management tool, the back-to-back defaults of Enron and WorldCom might have meant a significant capital impairment for one or more major banks. This was noted by then-Chairman of the Federal Reserve System, Alan Greenspan, in 2002. Speaking on the topic again in 2004, Greenspan had the following to say:
[N]ot only has a significant part of the credit risks of an admittedly few large U.S. banks been shifted to other U.S. and foreign banks and to insurance and reinsurance firms here and abroad, but such risks also have been shifted to pension funds, to hedge funds, and to other organizations with diffuse long-term liabilities or no liabilities at all. Most of the credit-risk transfers were made early in the credit-granting process; but in the late 1990s and early in this decade, significant exposures to telecommunication firms were laid off through credit default swaps, collateralized debt obligations, and other financial instruments. Other risk transfers reflected later sales at discount prices as specific credits became riskier and banks rebalanced their portfolios. Some of these sales were at substantial concessions to entice buyers to accept substantial risk. Whether done as part of the original credit decision or in response to changing conditions, these transactions represent a new paradigm of active credit management and are a major part of the explanation of the banking system's strength during the most recent period of stress. Even the largest corporate defaults in history (WorldCom and Enron) and the largest sovereign default in history (Argentina) have not significantly impaired the capital of any major U.S. financial intermediary.12
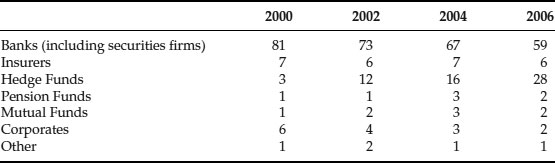
To get a rough sense of how much risk had been transferred, one can look to the results of the BBA credit derivative surveys from 2000 to 2006. The BBA reports protection buyers and sellers, as a percentage of total notional outstanding, as depicted in Exhibits 9.2 and 9.3.
Exhibit 9.2 Buyers of Protection by Institution Type
Source: British Bankers Associations (BBA), 2006.
By implication, the net buyers and sellers of protection, as measured by notional amount,13 are depicted in Exhibit 9.4.
Exhibit 9.3 Sellers of Protection by Institution Type
Source: British Bankers Associations (BBA), 2006.
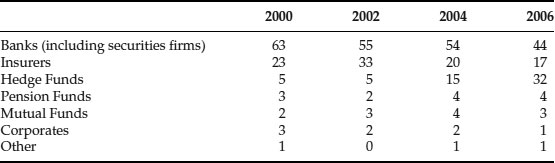
Exhibit 9.4 Net Buyers (Sellers) of Protection Institution by Type
Source: British Bankers Associations (BBA), 2006
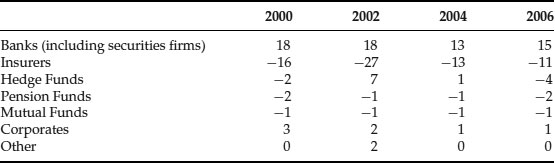
Applying these net percentages to the aggregate notional amounts estimated by the BBA, it would appear that, as of the end of 2006, the banking sector was a net purchaser of protection in an amount of approximately $3 trillion in notional (15 percent multiplied by a total $20 trillion of notional outstanding). But this figure is missing at least two important parts of the story. Much of the activity within the banking sector is made up of risk transfer from the global “money center” banks, which originate risk to national and regional banks, mostly outside the United States, which were large risk takers through credit derivatives and structured products based on credit derivatives (e.g., investment-grade-rated credit linked notes). This factor represents a distribution of risk not captured by the sector groupings.
The second significant factor is the degree to which the monoline insurers represent the net protection sale (i.e., long credit risk) side of the equation. The monolines are highly-leveraged entities that sold protection primarily on the AAA-rated tranches of CDOs and synthetic CDOs. Under typical documentation terms, the monolines generally do not post collateral (their AAA ratings were seen as a substitute for collateral), and there are generally very limited circumstances under which the monolines’ counterparties can terminate transactions prior to maturity with the benefit of a mark-to-market based termination payment. It has since become clear to the marketplace that given the leverage, documentation structure, and “systemic” nature of the risk taken by the monolines, the monolines are not, and never actually were, the “perfect” counterparties for most of the transactions under which the banks bought protection.14 This is especially true for entities buying protection on corporate CDOs.
Put very simply, given a macro default scenario in which one AAA rated corporate CDO suffers a loss, it's likely that many others will also suffer losses. In this scenario, the limited capital base will become overwhelmed with loss claims, and counterparties can expect to recover only a fraction of what they are owed. Put another way, the counterparties of a monoline are exposed to the performance risk of a protection provider with a small capital base in relation to protection written, and the protection contracts written are all very highly correlated.
The upshot of this second factor is that the banking sector actually transferred much less risk than one might infer from the notional amounts of the contracts. If a protection seller has the resources to cover only a fraction of the potential losses, then the notional amount of the contract represents a multiple of the risk transferred. In assessing the overall degree to which credit derivatives have truly resulted in better distribution of risk, this caveat cannot be ignored. But what we are talking about here is better characterized as an error made by the users of the product, rather than an inherent defect in the product itself.
The Ability to Go Short
As noted previously, a key difference between modern credit derivatives and predecessor products, such as bond insurance, is the absence of an “insurable interest” requirement. As a matter of fact, there are no requirements that any relationship exist between either of the parties to the contract and the reference entity that is the subject of the contract. It is this feature, in particular, that has elicited some of the harshest, and in the view of many market participants, most misguided, criticisms of credit derivatives.
Most of the arguments for restricting the ability to establish short positions through credit derivatives are the same as the arguments in favor of restrictions on the ability to short stocks. Some critics seem to believe that an unrestricted ability to go short allows “speculators” unchecked power to destroy otherwise sound companies. Others argue that short sellers destabilize markets. What's new about credit derivatives is that there is, in theory, no limit to how large the short interest can be, whereas with stock there is an effective limit created by the availability of stock for short sellers to borrow. Therefore, if you don't like the ability to short equities, you really don't like the tools that credit derivatives provide short sellers.
Those in favor of the ability to short question how allowing the expression of only the favorable or neutral view, while censoring the negative view, promotes long-term stability and efficient allocation of capital in the economy. Others argue that short selling is a necessary counter to the large and rising presence of index funds, whose mission is essentially to be long on everything. Closer to home, others point to the unraveling of the subprime market in 2007 as an argument in favor of shorting. The senior tranche on the BBB ABX, a CDS index based on the BBB-rated, subordinated mezzanine classes of ABS transactions, started to decline in price some time before senior ABS CDO spreads widened. By sending this price signal to the market, CDS arguably hastened the demise of ABS CDOs, and therefore caused new subprime mortgage origination to grind to a halt sooner than it would have otherwise, potentially avoiding the creation of tens or even hundreds of billions of dollars of additional bad product.
Much of the discussion focuses on the outright shorts, but this misses a very important part of the picture. In addition to outright shorts, other strategies involving a protection purchase without an “insurable interest” allow market participants to express relative value views that promote the efficient allocation of capital and send important risk-pricing information to the marketplace. One such strategy is a long/short pairing of two companies in the same industry. For example, suppose that IBM and Dell trade at the same credit spread but some market participants believe that Dell is a better credit. Suppose further, that some such market participants do not have a strong conviction that Dell bonds offer good value on an absolute basis, or are generally concerned about the short-term direction of credit spreads in the tech sector, or in the market generally. The view is one of relative value, not absolute value. The ability to express such a view without credit derivatives is limited. With credit derivatives it's easy: sell credit protection on Dell, buy credit protection on IBM. If enough market participants have this view, the credit spread of Dell will tighten relative to the credit spread of IBM. This will ultimately affect the borrowing costs of both companies, putting Dell at a funding advantage relative to IBM.
Another example is capital structure “arbitrage,” which is actually a bit of a misnomer. A more correct term is perhaps capital structure “relative value.” Under such a strategy, an investor typically uses CDS to purchase protection on a relatively rich part of a reference entity's capital structure and purchases the relatively cheap security. A popular strategy is to simultaneously purchase CDS protection on the debt (i.e., synthetically sell the debt short via CDS) and purchase the equity of a highly-leveraged financial firm. The rationale is that if the firm is levered enough in most scenarios where the equity takes a big loss of market value, the debt is also likely to suffer a big loss (corresponding to a big gain on the CDS). But in a positive environment, the equity stands to increase in value significantly while, at worst, the value of the credit protection can go to zero (with the investor losing the value of the CDS premium only). The net effect of investors executing this strategy is to drive credit spreads on the reference entity's debt to a level that reflects its downside risk relative to the equity and lower the cost of the reference entity's equity financing to reflect its upside potential.
FIRST-GENERATION PRODUCTS: 1992–2000
Asset Swaps
An asset swap involves the exchange of the cash flows of a given asset for a different set of cash flows. In the context of credit derivatives an asset swap is the combination of a credit-sensitive asset, typically a bond, with a corresponding swap that transforms the cash flows of the non-par bond, into a par bond. Asset swaps typically transform fixed-rate bonds into par floaters, resulting in an all-in coupon of LIBOR plus a spread. The resulting spread to LIBOR can be seen as the combined price of issuer default risk and term funding for the asset.
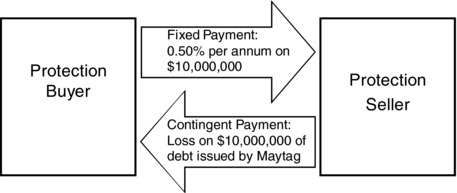
Single-Name CDS
The single-name credit default swap is the basic building block of most of the second-generation products, including the index products and the bespoke tranches. A credit default swap (CDS) is an agreement between two parties (the “counterparties”) in which the counterparties exchange the risk of default of a third party (the “reference entity”). The protection buyer pays a periodic premium to the protection seller in exchange for the protection seller's commitment to pay the protection buyer the amount of loss resulting from a credit event affecting the reference entity. Through this mechanism, the protection buyer transfers to the protection seller credit exposure to the reference entity without the exchange of an actual debt instrument. Exhibit 9.5 illustrates a hypothetical CDS with Maytag Corp. as the Reference Entity and a $10,000,000 notional amount.
Exhibit 9.5 Single-name CDS
The above definition begs two key questions:
1. What is a Credit Event?
2. How is the protection buyer “paid” should a “Credit Event” occur?
The short answer to both is “however the parties to the contract so provide,” and in the early days of the credit derivatives market the time spent figuring out the answers to those questions was quite high in relation to the trading volume. The 1999 ISDA credit derivatives definitions represented the first significant step toward developing market-standard answers. As can be expected, the market standards have evolved over time, and customized provisions have never disappeared. That said, the dominant practices in the marketplaces have been as described next.
Credit Events
The credit events most often used in traded CDS contracts are the following:
- Bankruptcy: Bankruptcy, receivership, insolvency or other similar proceeding; dissolution (other than merger or acquisition).
- Failure to Pay: After the expiration of any applicable grace period, failure to make a payment on any debt obligation, subject to a materiality threshold.
- Restructuring: Modification of the “money terms” of a debt obligation, where such modification is adverse to the creditors and is the result of a deterioration of the creditworthiness of the reference entity.
- Obligation Acceleration: The acceleration of any debt obligation, subject to a materiality threshold, resulting from a non-payment default.
- Repudiation/Moratorium: A failure to pay or restructuring (not subject to a materiality threshold) closely following a statement by the reference entity repudiating or declaring a moratorium on a debt obligation, subject to a materiality threshold.
As for settlement, there are two broad options:
1. Physical Settlement: The protection buyer delivers a security issued or guaranteed by the reference entity and meeting the deliverable obligation criteria, and the protection seller pays par value.
2. Cash Settlement: Protection buyer identifies (but does not deliver) a security issued or guaranteed by the reference entity and meeting the deliverable obligation criteria, and the protection seller pays the difference between par value and the market value of the obligation.
For the majority of single-name CDS, deliverable obligations are senior unsecured obligations, denominated in a major global currency (e.g., USD, EUR, GBP, CHF, JPY), with no “exotic” coupon or redemption features, and having a maturity of 30 years or less. For some reference entities, most often financial institutions, there are CDS traded under which a subordinated reference obligation may be delivered.
The traded market also includes CDS under which the deliverable obligation must be senior secured loans. The reference entities are almost all non-investment grade issuers of broadly-syndicated loans. Such contracts are referred to as Loan CDS or simply LCDS. Despite the prevalence of loan-based CDS in the first-generation CDS products, LCDS did not become broadly traded until 2006, and trading volumes never came close to those of senior unsecured CDS, even in relation to the underlying debt outstanding.
Loan Total Return Swaps
Under a loan total return swap (TRS) the total return receiver takes a synthetic long position in an individual loan or portfolio of bank loans. It is effectively a credit line that gives the investor all the cash flow benefits of a loan without actually holding the asset. The investor receives the total rate of return of the loan, in exchange for which it typically makes ongoing payments based on LIBOR plus a fixed spread.
Loan TRSs are used primarily by end users to: obtain leverage on a portfolio of bank loans; as a means to outsource loan operations or physical settlement; as a vehicle to gain access and exposure to assets that might not otherwise be readily available (e.g., due to eligibility restrictions in credit agreements).
Bank loan TRSs go back at least as far as 1995. In that year, Chase began offering TRS to institutional investors and hedge fund clients who purchased Chase's syndicated leveraged loans. At the time, other banks offered TRS structures based on leveraged loans, but the growth of Chase's program relative to others was driven largely by an innovative structure called the Chase Secured Loan Trust, or “CSLT.” The CSLT structure involved the creation of a special purpose vehicle (SPV) which:
- Entered into a TRS with Chase referencing the loan portfolio.
- Issued a note to investors in a par amount equal to about 20 percent of the par amount of the underlying loans.
- Invested the proceeds of the note issuance in a high-quality, highly-liquid asset, which served as collateral, first to satisfy the SPV's obligations under the TRS with Chase, and second, to make payments of interest and principal on the note issued by the SPV.
- The note was typically rated BBB by Fitch. Assuming losses in the loan portfolio remained at historical averages, the investor would earn a coupon equal to LIBOR plus a spread of approximately 200 basis points and would receive a return of its principal at maturity (typically 10–12 years), plus an equity-like “upside” payment as described below.
The above describes an early example of what later became widely known as a synthetic CDO or credit-linked note structure: the SPV enters into a credit derivative, issues a rated security, and pays a floating coupon and return of principal, provided losses on the reference portfolio remain below certain tolerance levels. This basic structure would be used again and again.
But what was particularly innovative about Chase's CSLT structure was that it used an excess spread account to provide a loss cushion to protect the rated cash flows of the issued notes. The excess spread came from the difference between the spreads earned on the reference loans, the sum of the above-LIBOR financing spread paid to Chase under the TRS, the portfolio manager's base fee, and the above-LIBOR coupon paid to the noteholder.
For example, if the average coupon on the loans was LIBOR plus 275 basis points, the funding cost under the TRS was LIBOR plus 75 basis points, the manager's base fee was 35 basis points per annum, and the note coupon was LIBOR plus 200 basis points (paid on 20 percent of the notional amount of the loans) then the excess spread is 125 basis points [i.e., 275 – 75 – 35 – (200 × 20%)]. Assuming a 2 percent annual default rate on the loans and a 70 percent recovery —standard collateralized loan obligation (CLO) assumptions up until the 2007 financial crisis—the excess spread covered more than two times expected annual default losses. At the end of the transaction most funds remaining in the excess spread account were distributed to the investor,15 creating the possibility for returns as high as LIBOR plus 800 basis points.
According to Fitch's rating models at the time, the risk of default losses over a 10-year period exceeding two times the expectation was low enough to merit a BBB rating on the notes. In all, the CSLT structure allowed an investor to take a five times leveraged position in a portfolio of BB and B rated loans with the benefit of a BBB rating on the instrument purchased. Many of the investors were insurance companies who found the relatively low regulatory capital requirements particularly compelling.
Looking back now, and admittedly with the benefit of having seen leveraged loan price volatility during the down markets of 1998–1999, 2002, and 2008–2009, there were some important risks that were arguably not given sufficient consideration in the rating analysis. Besides the question of whether the stressed levels of default and recovery were severe enough to support an investment-grade rating for the notes, there was the risk that the portfolio manager would not be able to acquire and maintain a portfolio earning the assumed spread over LIBOR, and the potential for losses on loans sold at a discount to par, especially at the maturity of the transaction or in the scenario where Chase terminated the TRS transaction for insufficient asset value coverage.16
Chase's CSLT program was discontinued in 1998 and the transactions were later restructured to more closely resemble standard cash-flow CLOs. This was done for reasons having nothing to do with the flaws in the rating methodology. Imperfections and all, the CSLT was a ground-breaking structure, and many of its features would be reutilized, with revisions and enhancements, throughout the growth of the credit derivatives market.17
First-to-Default (FTD) baskets
One can think of first-to-default baskets as the predecessor to “arbitrage” or “bespoke” synthetic CDOs. Though FTD baskets never became a very large component of the overall CDS marketplace, the modeling and risk management techniques developed for the product laid the groundwork for the growth of the synthetic CDO product.
In a first-to-default basket, the protection seller takes exposure to the first default in a small basket of identified reference entities, typically between 4 and 10. Most commonly, each reference entity has the same notional amount, and the premium is expressed in basis points per annum on the notional for a single-name. Losses can be either cash or physically settled.
Exhibit 9.6 FTD Premium as a Function of Correlation
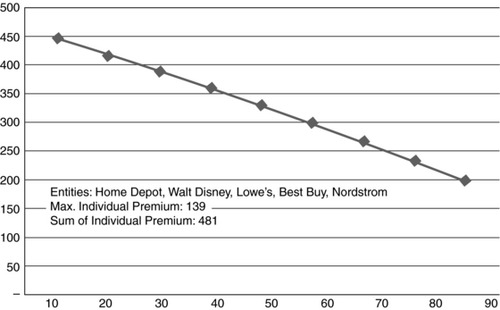
The fair premium for an FTD basket has to be no lower than the highest premium of the reference entities (the seller of protection is exposed to the risk of any name defaulting, including the worst one, of course), and no higher than the sum of the spreads of the reference entities (the first-to-default position can't possibly suffer more losses than the entire basket). The correlation between the defaults determines where the spread fits within these bounds.
Exhibit 9.6 illustrates a result that was counterintuitive to some in the early days of correlation products, namely, that, all else equal, the first-to-default position (or more generally, the equity position) of a basket of assets is better off if the basket is less diversified. One explanation that makes the intuition clear is that the first to default position suffers a loss if one reference entity defaults, and after that is no worse off if others default. Therefore, for a given set of reference-entity default probabilities, the first-to-default investor would prefer if all the credits either default or survive together.
Synthetic CDOs: Bank Balance Sheet
The first synthetic CDOs were bank balance sheet transactions, meaning that the reference portfolios were based on loans that resided in the loan portfolio of a sponsoring bank. In order to understand a synthetic CDO it's helpful to first understand CDOs. A CDO, or collateralized debt obligation, is a securitization in which the assets held as collateral are either corporate debt instruments, or are themselves tranches of a securitization (e.g., credit card debt or another corporate CDO). In a typical transaction, a special purpose vehicle is formed for the purpose of purchasing debt securities. The purchase is financed through the issuance of various classes of securities (called “tranches”), each of which has a security interest in the assets purchased by the SPV. The tranche with the first-priority security interest is typically called the “Class A.” The tranche with the second-priority security interest is typically called the “Class B.” The risk of each class increases as one goes down the capital structure of the CDO, with the senior-most-class, or the one with the first-priority security interest, representing the least amount of risk and lowest promised return. The most subordinated class is commonly referred to as the equity, the residual, or the first loss. The classes subordinated to the first-priority and senior to the equity are typically referred to as the mezzanine classes.
A synthetic CDO involves tranching the risk of a portfolio of credit derivatives, rather than the securitization of a pool of funded assets. In a typical transaction, the losses on a portfolio of CDS are allocated among various protection sellers (i.e., the takers of credit risk) according to specified priorities. The equity or “first loss” tranche assumes first losses on the reference portfolio up to a specified limit, usually expressed in terms of a percentage of the total portfolio size. The mezzanine tranches assume losses in excess of the limit specified by the equity, up to the mezzanine loss limit. The senior tranche assumes losses in excess of the sum of the limits specified by the equity and mezzanine.
Losses are cash-settled, meaning the loss corresponding to each credit event is determined based on market prices, and the applicable protection seller makes a cash payment to the protection buyer.
One of the first balance sheet synthetic CDOs, and surely the first such transaction to receive significant press, was J.P. Morgan's BISTRO transaction (standing for “Broad Index Securitized Trust Offering”), which closed in December 1997. J.P. Morgan subsequently closed a series of BISTRO transactions, purchasing credit protection and obtaining regulatory capital not only for itself, but for several other banks as clients. Morgan described the product as follows:
In this structure, an originating bank buys protection from J.P. Morgan on a portfolio of corporate credit exposures via a portfolio credit swap. Morgan, in turn, purchases protection on the same portfolio from an SPV.
The credit protection may be subject to a “threshold” … relating to the aggregate level of losses which must be experienced on the reference portfolio before any payments become due to the originating bank under the portfolio credit swap. Since this threshold represents economic risk retained by the originating bank, it is analogous to the credit enhancement or equity stake that a bank would provide in a traditional securitization using a CLO.
The BISTRO SPV is collateralized with government securities or repurchase agreements on government securities which it funds through the issuance of notes which are credit-tranched and sold into the capital markets. In a critical departure from the traditional securitization model, the BISTRO SPV issues a substantial smaller note notional, and has substantially less collateral, than the notional amount of the reference portfolio. Typically, the BISTRO collateral will amount to only 5–15 percent of the portfolio notional. Thus, only the first 5–15 percent of losses (after the threshold, if any) in a particular portfolio are funded by the vehicle, leaving the most senior risk position unfunded. The transactions are structured so that, assuming the portfolio has a reasonable amount of diversification and investment grade-average credit quality, the risk of loss exceeding the amount of BISTRO securities sold is, at most, remote, or in rating agency vernacular, better than “triple A.”18
The BISTRO structure allowed banks to achieve significant regulatory capital relief under the Basel I regime. Put simply, Basel I rules required banks to hold capital against most corporate credit exposures equal to 8 percent of the amount of the exposure, regardless of the credit quality of the corporate borrower. Exposures to banks were given a 20 percent risk weight, reducing the effective capital requirement to 1.6 percent. By packaging a large, well-diversified portfolio of exposures into a synthetic CDO structure, it was possible to obtain investment grade ratings on tranches with subordination levels as low as 1–2 percent. Typically, an issuing bank held dollar-for-dollar capital against the first loss retained. Assuming the issuing bank retained a first loss tranche of 1.5 percent, the regulatory capital requirement would be reduced from 8 percent to just over 3 percent [i.e., 1.5% + (98.5% × 8% × 20%)].
Bank balance sheet synthetic CDOs fell out favor in 2001 and 2002 for several reasons. The first was that most sponsoring banks required the ability to change the composition of the portfolio during the course of the transaction in order to match the changing composition of credit exposures in its loan portfolio. Suppose, for example, a bank had a loan exposure to IBM that was referenced in a synthetic CDO transaction. If IBM were to pay down its loan without the bank lending under a replacement facility to IBM, the synthetic CDO would leave the bank with a short position in IBM. Since bank loan portfolios typically do not maintain open short positions, the most desirable thing to do would be to remove IBM from the synthetic CDO and replace it with another credit.
At this point a conflict arises between the interests of the sponsoring bank and the interests of the investors. Since the pricing of the transaction is already fixed and not sensitive to the quality of the replacement, it is in the bank's interest to replace IBM with the worst credit possible, while the investors would like to see the best credit possible, or even no replacement at all. The early bank balance sheet deals attempted to address this problem by creating a requirement that the replacement credit be of equal or better quality than the removed credit and that the substitution not reduce the diversity of the reference portfolio. The marketplace quickly realized that this protection was insufficient, as the reference entities’ ratings tended to lag the market's perception of credit quality, and sponsoring banks tended to have better information about the condition of the borrowers in their loan portfolios.
These factors started to matter to investors as credit spreads widened and a few investment grade borrowers defaulted in late 2000 and early 2001. Around that time, a new product came on the scene. This new product addressed the substitution conflict by making the portfolio static, not relying on obscure bilateral credits that sit on the balance sheets of sponsor banks, and allowing investors much more flexibility to tailor portfolio composition, tranche attachments, maturity, and other features. For a brief while the new product was called “arbitrage BISTRO” within J.P. Morgan, then more broadly the “arbitrage synthetic CDO” or “single-tranche synthetic CDO” until the marketplace finally settled on “bespoke synthetics” or simply “bespokes.”
SECOND-GENERATION PRODUCTS: 2001–2007
Bespoke Synthetic CDOs
The first bespoke synthetic CDOs were executed in 2000, and by 2001 at least five dealers were active in the space. By the end of 2006, the number of dealers had surpassed 20. A bespoke synthetic CDO is a synthetic CDO transaction in which the investor has a large degree of flexibility to select the components of the reference portfolio, the attachment and detachment points, maturity, premium structure, and other details.
Because of its flexibility, transparency, and structural simplicity, bespoke synthetics experienced rapid growth from 2001 through the first half of 2007. Beginning with the onset of the subprime crisis in August of 2007, the volume of new bespoke synthetic CDO transactions slowed down considerably and by 2009 it had ground virtually to a halt. Several developments in 2009 and 2010, which will be discussed below, make a meaningful return of this product in the short term highly unlikely.
In each year between 2001 and 2007 the CDS market roughly doubled in size, to a total of $60 trillion. Bespoke synthetic CDOs were instrumental in driving this growth. According to BBA statistics, synthetic CDOs accounted for a total of 17 percent of total credit derivative notional, while single-name CDS accounted for 33 percent of the total. Assuming an average tranche delta of one,19 it can be inferred from this data that synthetic CDOs drove roughly half of the single-name CDS volume. For some dealers, the synthetic CDO business actually represented as much as 80 percent of the “protection buy” side of the trading book.
The Gaussian Copula Model and Correlation Trading
In light of the significant contribution made by the bespoke synthetic CDO product to the growth of the overall credit derivatives market, it is particularly useful to understand the technology that made the product possible. In 1999, David Li of J.P. Morgan's RiskMetrics group, published a seminal paper describing the Gaussian copula modeling approach to the valuation and risk measurement of synthetic CDOs.20 It has become an industry standard, in much the same way as the Black-Scholes model is the industry standard for pricing equity options, due to its simplicity and ease of implementation.
The Gaussian copula model starts with the assumption of risk-neutral pricing of the underlying single-name CDS (i.e., that the expected present value of the premium equals the expected present value of default loss payments). The objective of the model is to determine the fair premium for any bespoke synthetic CDO, or the level that equates present value of the premium payments to the present value of the expected losses on the CDO tranche. For each reference entity, given the term structure of its CDS spreads, a recovery assumption and the term structure of interest rates, a probability distribution of the time-to-default can be derived. The Gaussian copula model provides a framework to specify the joint distribution of the reference entities, thereby producing a probability distribution of losses for the entire portfolio at each point in time. Put simply, the “copula” is the framework by which default correlation between the reference entities is modeled, and for simplicity one can think of the model as using the standard Gaussian, or normal distribution, to correlate the “asset values” of the reference entities.21 As noted in Li's paper, the model “introduces a few techniques used in survival analysis. These techniques have been widely applied to other areas, such as life contingencies in actuarial science and industry life testing in reliability studies.”
Similar to the Black-Scholes model for equity options, the Gaussian copula model can also be used to calculate risk measures. For example, one of the measures is single name “credit 01,” which captures the change in the value of a bespoke CDO value with respect to a one-basis-point shift of the CDS curve for each individual name in the portfolio. The credit 01 can then be used to determine a delta, or hedge ratio, for each reference entity in the bespoke portfolio.
While the use of this model for the valuation of synthetic CDOs has been the market standard since 2001, the specifics of how market participants have used the model have evolved in response to major market events.
One such event was the development of a correlation “skew” in the standardized tranches of broad CDS market indices. As early as 2002, J.P. Morgan and Morgan Stanley began efforts to create market-standard CDS indices. The upshot of these efforts was the creation of two highly important indices: Markit “CDX” indices in the US and the iTraxx indices in Europe and Asia. The first investment grade (IG) CDX Series, for example, began trading in October of 2003. The IG CDX is an index of 125 investment grade reference entities whose CDS contracts are actively traded. A new series of the index is created every six months, with changes to the index being driven by:
- Downgrades of reference entities to non-investment grade (e.g., Ford and GM were in the earlier series but were excluded from IG CDX series 5, which began trading in September, 2005, because both had been downgraded to non-investment grade in May of 2005).
- Defaults of reference entities (e.g., Lehman Brothers was a member of the on-the-run index when it filed for bankruptcy in September of 2008).
- Mergers (e.g., Wyeth).
- A drop in trading activity of the single-name CDS.
In late 2003, the market also began trading standardized tranches of the IG CDX as depicted in Exhibit 9.7.
Exhibit 9.7 Seniority Structure of IG CDX Tranches
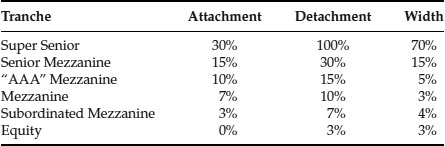
A large part of the initial impetus for trading standardized tranches was for dealers to have an observable market in credit default correlation. This was necessary to provide a basis for the valuation of bespoke synthetic CDOs, which by 2003 had become a large business at several of the major global banks and investment banks.
Prior to the advent of the index tranche market, dealers generally marked their credit correlation books based on historical correlations, either from stock prices or CDS spreads, and took large reserves. Average historical correlations were in the 25 percent range and reserves were in the +/– 10 percent range. For example, a long equity or short senior position might be marked at 15 percent correlation, and long senior or short equity position might be marked at 35 percent correlation.
Initially, the traded market for correlation, as reflected by the index tranches, was more or less in line with the correlation levels at which dealers were marking their books. Over time, however, a correlation “skew” developed, under which the correlation implied by index tranche prices varied depending upon the attachment point. This correlation skew is analogous to the volatility skew, or “smile” or “frown” observed in equity option pricing.
The correlation skew has tended to slope upward, meaning that implied correlations at the more senior attachments are higher. This general behavior has both a technical “supply and demand” explanation and a fundamental explanation. The technical explanation is that during the years when new bespoke issuance was active, the strongest investor demand was for the investment-grade rated mezzanine tranches, generally corresponding to the 3 percent and 15 percent attachments of the IG CDX. The tranches were attractive largely because they paid credit spreads well in excess of spreads available on single-name CDS for reference entities of comparable ratings. In addition, the existence of subordination equal to 2 to 8 times historical default loss averages, which were in part responsible for the ratings, gave investors comfort that even if there were a few unexpected credit events in the reference portfolio, the investment could still come out whole.
Equity tranches, on the other hand, do not generally have ratings and are exposed to the first loss in the reference portfolio. Two or three bad calls out of 100 or more reference entities could result in a losing investment. Lastly for tranches attaching above approximately 15 percent, there was plenty of loss cushion, at least in relation to historical averages. As a result, spreads were too low to make the investment worthwhile to most types of investors. For any given CDS spreads on the reference entities, stronger technical demand for the mezzanine compresses mezzanine spreads and “pushes” spread into the senior and equity classes. This, in turn, raises implied correlation at senior attachments and lowers implied correlation for the equity.
As for the fundamental explanation, the notion of low to moderate default rates corresponding to low correlation, and high default rates corresponding to high correlation makes intuitive sense, at least where correlation is measured under a normal (or Gaussian) distribution. Put another way, if we were to observe, say, that two investment-grade reference entities out of 125 default over a five-year period, one would expect that those defaults were the result of idiosyncratic or at most industry-specific factors. If, on the other hand, 25 out of 125 investment-grade borrowers were to default, or more than 10 times historical averages (the type of scenario it would take to reach a 15 percent attachment assuming 25 percent average recovery), one would expect that this would have been caused by a systemic economic disaster comparable to the Great Depression. Even the sustained period of recession and weak economic growth which began in 2008 is not expected to come close to such a level of corporate default.
One of the defining events in the development of the CDS market was the dislocation of the credit correlation market in May of 2005. Since late 2003, the correlation skew had been steadily steepening. In May of 2005, S&P downgraded GM and Ford to non-investment grade, or “junk” status. As expected, this caused a significant widening of the credit spreads for these two issuers, but not necessarily due to any fundamental news reported to the market by the downgrade.22 The move was driven more by the technical effect of investment grade funds having to sell out of Ford and GM. In addition, because the investment grade funds had to replace these issuers with others, the remaining investment grade universe tightened a bit. Lastly, because the high-yield funds had to “make room” for Ford and GM, the rest of the high-yield universe widened.
The downgrade of Ford and GM was a significant decoupling event. Even without any move in correlation, the equity tranches of the IG CDX would have suffered a deterioration in value. But this deterioration was made much larger by a new concern surrounding the potential for future idiosyncratic or industry-specific events. Correlation at the 3 percent attachment point and 5-year maturity fell into the single digits, the lowest levels that had ever been seen, and generally stayed at 15 percent or lower until the first credit-market dislocation in the summer of 2007.
CDS Benchmark Indices and Tranches
As noted above, the IG CDX and iTraxx indices, and tranches on those indices, began active trading in late 2003. Since then other indices began active trading, including a U.S. high-yield index (HY CDX), “crossover” indices (XO CDX and iTraxx) and an index of loan-only CDS (LCDX). The indices are used by dealers, hedge funds, and other market participants to quickly and cost-effectively establish market long or short positions, with the particular index chosen to provide the best proxy for the type of market benchmark desired. For example, a U.S. high-yield bond asset manager with a short-term bearish market view might express this view by purchasing protection on the HY CDX. This would allow the manager to hedge his or her core long portfolio, or even establish a net short position, until such time as his or her view changed to neutral or bullish, without incurring the large bid-offer costs, and risking a potential inability to re-establish a portfolio of desired issuers.
For a while there was active trading of tranches of the HY CDX and the LCDX, but with the slowdown of bespoke tranche activity beginning in 2007, trading in these tranches dropped off significantly. At the time of this writing, the “on-the-run” series of each index is number 13 or 14, established some time in 2010. But for tranches, the only actively traded series are series 9 of the IG CDX and iTraxx, which went effective in September 2007 and March 2008, respectively.
CDS Swaptions
A CDS swaption is an option to either purchase or sell credit protection on a particular reference entity or index at a prespecified premium level. Like stock options, FX options and interest rate swaptions, CDS swaptions create a market in volatility. In the case of CDS swaptions, the relevant volatility is that of the credit spread. The first attempts to create a traded market in CDS swaptions go back to the beginnings of the CDS market itself. After a slow start, a real market in CDS swaptions began to emerge in 2007, and CDS swaptions on the indices are actively traded at the time of this writing.
GOING FORWARD
In some ways, the present time for credit derivatives is similar to 1994 for interest rate derivatives. What was a nascent market more or less 10 years ago has witnessed several years of, literally, exponential growth. Product innovation in some cases reached beyond the point of usefulness, and some market participants took meaningful losses as a result of poorly-understood risks and excessive leverage. Of course in many important ways, the comparison breaks down. The players who took big well-publicized losses in interest rate products in 1994 (e.g., Orange County, P&G, and MBS funds) were not systemically critical, and some suffered no material impact to their business. There was no systemic crisis comparable to that of 2007–2009, and interest rate derivatives weren't generally believed to have actually caused the rate volatility that led to the losses.
But, as with interest rate derivatives in 1994, some today believe that credit derivatives have outlived their usefulness and we are now on our way to a return to the old ways of managing risk. As with interest rate derivatives in 1994, I do not hold this view of credit derivatives today. Has the technology been misunderstood, misused, and mismanaged, with catastrophic consequences for some? Absolutely. But I believe just as strongly that the technology is just too useful to simply disappear from the landscape of global finance. This was what I thought of interest rate derivatives in 1994, and it's what I think about credit derivatives today.
Global banks are still large originators of risk and not only in their loan portfolios. Interest rate and currency derivatives, which thankfully are not the subject of public scorn at the moment, are a big source of credit risk for the banks. Commodity derivatives are likely to become another meaningful source. It appears likely that corporate clients who use interest rate, currency, and commodity derivatives to manage exposures will be exempt from the margin requirements of the Dodd-Frank Act.23 At the same time, banks are becoming more disciplined in their management of counterparty risk, and proposed Basel rules will increase the capital charges associated with such risk. For these reasons, credit derivatives still have an important place in the risk management strategies of the global banks. And depending on a number of factors, we may see a new generation of standardized products to trade such risks, a new generation of customized “bank balance sheet” structures, or both.
Moreover, some other types of organizations who have not heretofore been big protection buyers should continue to have access to the product because, sooner or later, the potential applications will become apparent to them. One such organization type are the non-financial corporate entities, who may consider using the product to manage credit exposures to trade debtors or to the banks that provide liquidity facilities; to hedge risks and enhance yields in their pension funds; or to hedge anticipated borrowing costs. Another type are the federal, state, and local governments who may consider using the product to manage the risk of various financial guarantees issued and other credit exposures taken, to business ventures ranging from environmentally-friendly energy projects to sports teams.
The need is clearly there and, if anything, the desire to use the product as a protection buyer should increase. The challenge will be in finding the protection sellers.
The marketplace for the time being has lost perhaps the single most important vehicle—the bespoke synthetic CDOs. A number of factors make it unlikely that bespoke CDOs will return in meaningful size any time soon. These factors include:
- No obvious home for the senior-most classes. As discussed above, the monolines were big protection sellers, but due to their limited ability to pay, the banks ended up as the de facto holders of this risk. This is not likely to happen again.24
- New rating agency rules have raised the subordination levels required at all rating categories.
- Proposed BIS rules will double or triple the regulatory capital requirements of dealers making markets in synthetic CDOs.
- Regulatory capital requirements for many investors are up too, especially at non-dealer banks and insurance companies.
- New accounting rules force investors to recognize mark-to-market volatility of performing synthetic CDOs purchased in note form.
So, who will be the new protection sellers? Two types of players, who have heretofore been virtually absent, could step in, depending in large part on the regulatory environment. The first are the “real money” investors, and especially pension funds and investment companies. The second is individual investors in the United States high net worth and traditional “retail.” Both these types of investors are, for different reasons, potentially good takers of risk through credit derivatives products.
Among real money investors, life insurance companies have to some extent used credit derivatives as an alternative means of taking long-term credit exposure to corporate issuers. Mutual funds and pension funds can also benefit from the diversification and yield-enhancement strategies that credit derivatives make possible. To date, however, their participation has been limited, in part due to lack of clarity with respect to how such investments are treated under applicable regulation. Realistically, there is little short-term prospect of the rules changing in such a way that opens the door for these investors to meaningfully participate in the space, but one can hold out hope for the longer term.
Moreover individual investors, subject to proper disclosure and suitability standards, could be good takers of the senior-most, systemic risk in a CDO or synthetic CDO structure. Such investments would be considered part of the “less liquid” or “long term” component of the investment portfolio, and would most likely be made through managed funds rather than directly. Individuals arguably take greater risks (in terms of likelihood and severity of loss) by purchasing stocks, traditional corporate bonds, and municipal bonds (either directly or through ETFs and mutual funds). Individual investors are not subject to accounting rules that arbitrarily identify some assets and risks for mark-to-market treatment and others for, essentially, accrual-based treatment. They are therefore in a better position to make a rational choice with respect to tolerance for price volatility. Lastly, like it or not, individuals, as taxpayers, are already exposed to the systemic risk represented by the senior tranches of CDOs and synthetic CDOs, be it through federal deposit insurance, GSEs, or programs such as TARP and TALF. Assurances to contrary, including the “anti-bailout” provisions of the Dodd-Frank Act are simply not credible. There's an argument that it would be more transparent and economically efficient if they took more of such risk through choices made with respect to their investment portfolios and less through the political process.
Thankfully, credit derivatives have thus far survived misguided attempts to ban them by legislation. There should be concern, however, that the current environment may produce rules that single out credit derivatives for more restrictive treatment than the treatment applicable to comparable products (as the accounting rules already do). If these cases can be kept to a minimum and market participants are left relatively free to engineer new products and applications, credit derivatives should continue to serve the important functions of risk management, distribution, and pricing to the benefit of the capital markets as a whole.
NOTES
*. The author would like to thank his colleagues at Riverside Risk Advisors, and especially Yuan Zhou, for their valuable comments and assistance.
1. Discussed in the chapter.
2. The use of this term to describe derivatives products was first attributed to Warren Buffett, Chairman and CEO of Berkshire Hathaway. Interestingly, Berkshire Hathaway is known to have been a large uncollateralized risk taker through credit and equity derivatives (as a seller of protection on the equity tranches of synthetic CDOs and writer of put options on the S&P 500).
3. www.newsweek.com/2008/09/26/the-monster-that-ate-wall-street.html.
4. AMBAC is Ambac Financial Group, Inc.
5. MBIA is MBIA, Inc.
6. FGIC is Financial Guaranty Insurance Company.
7. FSA is Financial Security Assurance, Inc.
8. Eric Dinallo, the New York State superintendent of insurance, stated on November 20, 2008, at the U.S. House of Representatives Committee on Agriculture, that he was withdrawing his earlier proposal to regulate credit default swaps under New York insurance law in light of the federal government's expressed interest in bringing federal regulation to the market.
9. As well as securitization.
10. Or, for that matter, to take on the costs of origination and relationship management or bear the operational burdens and risks.
11. Otherwise, the borrowers would likely seek funding from another source.
12. Remarks by Chairman Alan Greenspan at the American Bankers Association Annual Convention, New York, October 5, 2004.
13. It should be noted that not all notional is created equal. Risk transferred can vary in credit spread, maturity, and leverage. Simple notional does not measure these factors.
14. It was always understood that the monolines were imperfect counterparties, and pricing reflected this imperfection. Through mid-2007 monolines were generally paid approximately 50 to 80 percent of the premium that would have been paid to, say, a AA financial institution with daily collateral calls.
15. With a portion, typically 20 percent, paid to the portfolio manager as an incentive fee.
16. In order to protect its position as the de facto lender to the CSLT, Chase had the right to unwind the structure by selling loans out of the KZH if the value of the loans reached approximately 85 percent of par. In such a scenario, note investors would lose most or all of their investment.
17. For example, the excess spread feature was utilized again by Chase in a “balance sheet” structure called LANCE, which also featured loan portfolio equity rated BBB by Fitch. LANCE was based on CDS, which matured on the same day the notes matured, rather than on TRS. Moreover, there was no asset value coverage test. For these reasons, the rating of LANCE was less subject to extraneous risks.
Moving for ward to 2002, Lehman Brothers developed an excess spread structure in which a first-loss security obtained a rating of A3 from Moody’s. This was made possible by the general credit spread widening caused by fear of “corporate governance” scandals.
Though economics ne arly identical to those of an excess spread structure could be replicated by combining rated mezzanine and unrated equity, traditional CDO investors seemed to favor the pricing transparency of the excess spread structure.
18. See J.P. Morgan and RiskMetrics Group (1999).
19. See discussion of the Gaussian Copula model in Li (1999).
20. Ibid.
21. In reality, the default rate for a group of credits tends to be higher in a recession and lower when the economy is growing. This implies that each credit is subject to the same macroeconomic environment, and that there exists some form of positive dependence among the credits. To capture the description in the simplest and most convenient mathematical term, one factor Gaussian copula is introduced. In brief, it is a multivariate normal joint distribution defined on the n-dimensional unit cube [0, 1]n such that every marginal distribution is uniform on the interval [0, 1] assuming a single correlation parameter. More specifically, each individual credit in the portfolio is modeled as an asset combining two independent components; one is a systemic component, which can be thought of as the state of the general economy, and the correlation of the credits in the portfolio is captured through the sensitivity to this macro factor only; the other component is an idiosyncratic component, which is specific to each individual name. In the Gaussian copula framework, both components are normally distributed, which implies the asset itself is normally distributed. Moreover, the distribution of the asset value is mapped to each corresponding time to default distribution indicated above, thus providing a complete description of the joint portfolio loss distribution, which enables us to compute the expected loss and premium payments for the entire portfolio.
22. It's well understood that credit ratings tend to lag changes in credit spreads, though the rating agencies have done much to improve the response time of corporate ratings in recent years.
23. The Act itself does not create such an exemption to the collateral rules, but given the clear intent conveyed in the Dodd-Lincoln letter, it would be surprising if the CFTC and SEC were to force a significant change to the status quo for corporate end-users.
24. Or if it does, it won't be in the same form.
REFERENCES
J.P. Morgan and RiskMetrics Group. 1999. The J.P. Morgan Guide to Credit Derivatives. www.defaultrisk.com/pp_crdrv121.htm.
Li, David X. 1999. “ On Default Correlation: A Copula Function Approach.” Journal of Fixed Income 9:4, 43–54.
ABOUT THE AUTHOR
Frank Iacono is a partner at Riverside Risk Advisors LLC, an advisory firm specializing in the structuring, execution, and risk management of interest rate, currency, and structured credit derivatives transactions. He has over 15 years of experience with derivatives and structured products as a trader, structurer, manager, and advisor. From 2006 to 2008 Frank was CEO of Cournot Financial Products LLC, a AAA rated Credit Derivatives Product Company sponsored by Morgan Stanley. From 2001 to 2006, Frank worked with Lehman Brothers as the senior executive responsible for the corporate-structured credit business in New York. From 1998 to 2001, Frank worked with Chase as a vice president in the Credit Derivatives Group. From 1994 to 1998, Frank worked at Capital Market Risk Advisors, a consulting firm specializing in structured products and risk management. Frank holds a BS in Applied Math (summa cum laude) from Yale University and a JD (cum laude) from Harvard Law School. Frank is a licensed attorney in the State of New York.