
Chapter 23
Performance Fees
INTRODUCTION
This chapter explores three aspects of investment management fees, which are not commonly understood. First, performance fees for a group of funds are higher than the average of the funds’ expected fees. Second, the standard deviation of returns net of performance fees understates a fund's exposure to risk. Third, typical mutual fund fees are as high as, or higher than, typical hedge fund fees. Allow me to explain.
PERFORMANCE FEES
Hedge funds typically charge a performance fee that is a percentage of profits—but not losses—relative to a benchmark along with a base fee that is a fixed percentage of assets under management. Often the base fee is deducted from the profits before the performance fee is applied. If, for example, the base fee equals 2 percent and the performance fee equals 20 percent, a hedge fund manager who produces a 7 percent return in excess of the benchmark on a $100 million portfolio will collect a $2 million base fee (2 percent × $100,000,000) and a $1 million performance fee [20% × ($7,000,000 − $2,000,000)], for a total fee of $3 million. The investor's return net of fees, therefore, is 4 percent in excess of the benchmark. Exhibit 23.1 shows fees as a function of relative performance given this particular fee arrangement.
Exhibit 23.1 Performance Fee Payoff Diagram
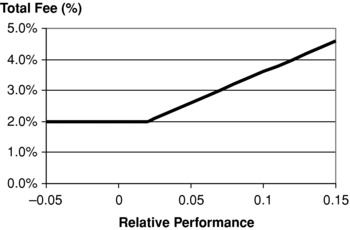
Exhibit 23.1 reveals that a performance fee, in which the hedge fund manager collects a share of the upside but does not pay for any downside, is tantamount to a long position in a call option on relative performance for the manager, and a short position in this option for the investor. If the investor engages several managers with performance fees, the investor is effectively short a portfolio of options as opposed to an option on a portfolio, because performance fees are paid on the individual performance of the funds, rather than on the average performance of the funds. If, for example, one fund is up and another is down by the same amount, the investor is still required to pay a performance fee on the profitable fund. This arrangement dilutes the portfolio's expected performance beyond the expected value of the fee, as I will now demonstrate.1
Impact of Asymmetry
Suppose an investor hires two managers who each charge a base fee of 2 percent, and a performance fee of 20 percent, and these managers both have expected returns in excess of the benchmark of 7 percent. The expected fee for each manager is 3 percent [2 percent + 20 percent × (7 percent − 2 percent)]; hence the investor might expect an aggregate return net of fees from these two managers equal to 4 percent. This expectation would be justified, however, only if both managers’ returns exceed the base fee. If, instead, one manager produces an excess return of 25 percent and the other a −11 percent excess return, and an equal amount of capital is allocated to each manager, the investor would pay an average fee of 4.3 percent rather than 3 percent, and the average return to the investors would equal 2.7 percent rather than 4 percent, even though the managers still have an average excess return of 7 percent.
Exhibit 23.2 Asymmetry Penalty Numerical Example
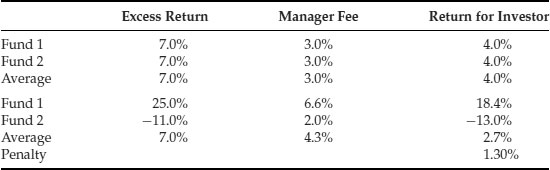
The difference between the expected return to the investor of 4 percent, and the realized return of 2.7 percent, is the drag attributable to the asymmetry of the performance fee, as I just explained. The result shown in Exhibit 23.2 is specific to the assumptions of this example, but it is easy to determine the typical asymmetry penalty given assumptions about expected excess return, standard deviation of excess return, and the average correlation of the managers’ excess returns by applying Monte Carlo simulation.
Suppose, for example, we invest in 10 hedge funds, each of which has an expected excess return of 7 percent and a standard deviation of 15 percent. We will examine the impact of asymmetry under three different return correlation scenarios. These are −25 percent, 0 percent, and 25 percent. We assume, for simplicity, that all ten funds’ returns are mutually correlated to the degree indicated. In order to estimate the impact of asymmetry on a collection of hedge funds we proceed as follows:
1. We first draw 1,000 returns for 10 funds, each from a multivariate normal distribution with means equal to 7 percent, standard deviations equal to 15 percent, and correlations equal to −25 percent, 0 percent, and 25 percent.
2. Then we apply the fee structure to each individual fund's returns for 1,000 trials and compute the average net return of 1,000 trials for all 10 funds.
3. We next compute the average return across 10 funds for 1,000 trials.
4. We apply the fee structure to the average return of 10 funds for 1,000 trials and compute the average net return of 1,000 trials.
5. We compute the difference in average returns from steps 2 and 4.
Exhibit 23.3 shows the results of such a simulation, assuming a base fee of 2 percent and a performance fee of 20 percent, which is applied to the excess performance after subtracting the base fee.
Exhibit 23.3 Asymmetry Penalty Simulated Results
| Correlation | ||
| −0.25 | 0% | 25.00% |
| 0.80% | 0.69% | 0.47% |
| Alpha = 7% | ||
| Expected return = 11% | ||
| Standard deviation = 15% | ||
As we should expect, the size of the asymmetry penalty is inversely related to the correlation of the funds, because the more disparate their performance, the more likely it is that some funds will outperform while others underperform.
Asymmetry also impacts risk. Specifically, it invalidates standard deviation as a measure for estimating exposure to loss. It turns out that the standard deviation of a fund's returns net of fees is lower than the standard deviation of returns before fees, but this difference does not imply a reduction in risk. Exhibit 23.4 illustrates why standard deviation fails to capture exposure to loss.
Exhibit 23.4 Upside versus Downside Volatility
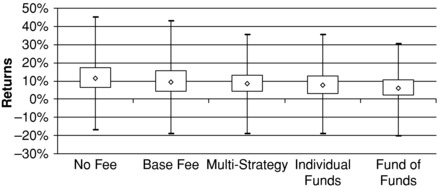
Exhibit 23.4 shows the distribution of returns for various fee strategies. The diamonds represent the median returns, while the boxes show the 25th and 75th percentile returns. The extended lines show the maximum and minimum returns. The first plot shows the distribution assuming there are no fees. The second plot subtracts only the base fee. The third plot assumes that the performance is applied to the net return of the 10 funds, as would be the case in a multi-strategy fund. The fourth plot assumes that the performance fee is applied individually to the various funds. Finally, the fifth plot subtracts an additional base fee of 1 percent and a performance fee of 10 percent as compensation to a fund of funds manager.
Although the distribution of returns is tighter after performance fees are deducted, implying a lower standard deviation, this reduction in volatility does not imply lower risk. The standard deviation is reduced because the performance fees attenuate upside performance, not downside performance. The downside is just as low or lower after deducting fees than it is before fees. Therefore, standard deviation is not a reliable indicator of exposure to loss, nor should it be used to build efficient portfolios comprising funds that charge performance fees. Instead, we should use downside deviation to measure risk and determine optimal allocation to hedge funds and other funds that charge performance fees.
Optimal Allocations
Let's now explore the impact of performance fees on optimal portfolio allocations. Suppose we wish to allocate a portfolio across stocks, bonds, and hedge funds based on the following assumptions for stocks and bonds. Exhibit 23.5 shows the expected return and downside deviation, given various fee arrangements and assumptions for alpha ranging from 7 percent to 10 percent.
Exhibit 23.5 Return and Risk Net of Fees
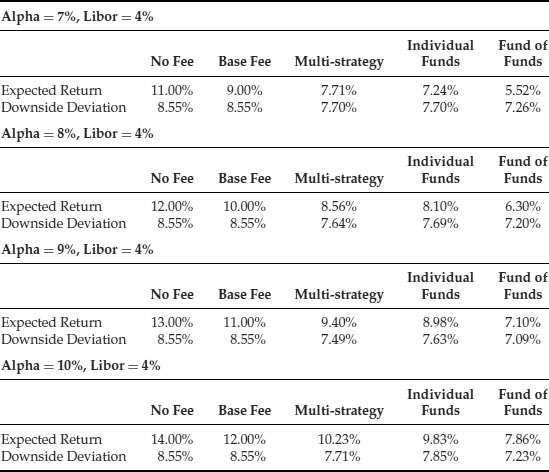
We can use this information to determine the optimal allocation to hedge funds, assuming an investor starts with a 70 percent allocation to stocks, which are expected to return 9.5 percent with a standard deviation of 20 percent, and a 30 percent allocation to bonds, which are expected to return 8 percent with a standard deviation of 10 percent, and assuming that stocks and bonds are 30 percent correlated.2
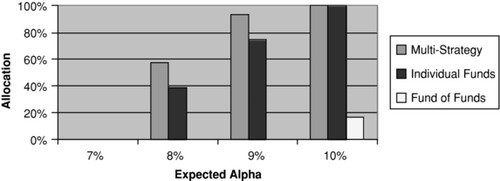
Exhibit 23.6 reveals that a 7 percent alpha is insufficient to warrant any exposure to hedge funds. If alpha is as high as 8 or 9 percent, portfolios should include substantial allocations to hedge funds within a multi-strategy portfolio, and even funds that charge performance fees individually; however, funds of funds are still undesirable. It is only when alpha reaches 10 percent that a small allocation to funds of funds makes sense.
Exhibit 23.6 Optimal Hedge Fund Allocations with Asymmetry Penalty and Downside Volatility
Summary
Performance fees have a hidden cost called the asymmetry penalty, arising from payment for outperformance without reimbursement for underperformance. Performance fees lower volatility but not risk, because they limit upside deviations. Investors in hedge funds should account for the asymmetry penalty and downside volatility when determining optimal hedge fund allocations. Investors should expect a premium of several hundred basis points to justify allocation to funds of funds.
HEDGE FUND VERSUS MUTUAL FUND FEES
Most investors believe that hedge fund fees are much higher than mutual fund fees. After all, the typical hedge fund charges a base fee that is much higher than the typical mutual fund fee and, on top of that, hedge funds take a substantial fraction of the profits in the form of a performance fee. Surely hedge fund fees must be higher than mutual fund fees—or perhaps not. Hedge funds, in principle, hedge out market returns and thereby produce a pure alpha; hence the term hedge fund. Alpha, in principle, is uncorrelated with market returns. Mutual funds, by contrast, generate returns that comprise a market component and an alpha component. The returns of mutual funds are typically more than 95 percent correlated with market returns. Taking these factors into account, it is unclear whether hedge funds or mutual funds are more expensive. The following example illustrates the relative cost of investing in hedge funds and mutual funds.
Exhibit 23.7 shows the monthly returns and values of a hypothetical mutual fund and index fund, assuming an initial investment of $1 million. The index fund serves as the benchmark for the mutual fund.
Exhibit 23.7 Mutual Fund and Index Fund Returns and Values
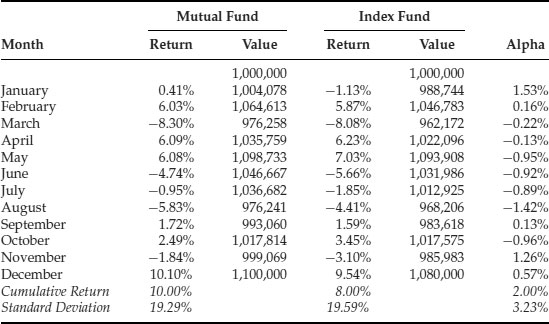
The mutual fund manager had a fairly good year. He generated a 2 percent alpha with active risk equal to 3.23 percent, for a respectable information ratio of 0.62 (alpha's cumulative return divided by alpha's standard deviation). Moreover, although not shown here, he has produced similar performance in years past. Because he has a solid long-term track record, he charges 75 basis points of the average of the beginning and ending values of the fund.
We might be tempted to hire this talented mutual fund manager, but as it turns out, he has a twin sister who is just as talented. In fact, their similarity as twins extends to their stock-picking skills, because they make the exact same active bets. She applies her skill, however, not as a mutual fund manager but as a hedge fund manager. Rather than invest in the stocks she expects to outperform the benchmark, she puts the capital to work in a short-term investment fund (STIF) that earns 4 percent. She then sells short the index fund and uses the proceeds of these short sales to purchase the stocks she expects to outperform, and she levers these exposures 12 to 1. Thus, she delivers a pure alpha stream, rather than the composite of market returns and alpha that her twin brother delivers through his mutual fund. Exhibit 23.8 shows the returns and values of her hedge fund, assuming an initial investment of $1 million.
Exhibit 23.8 Hedge Fund Returns and Values
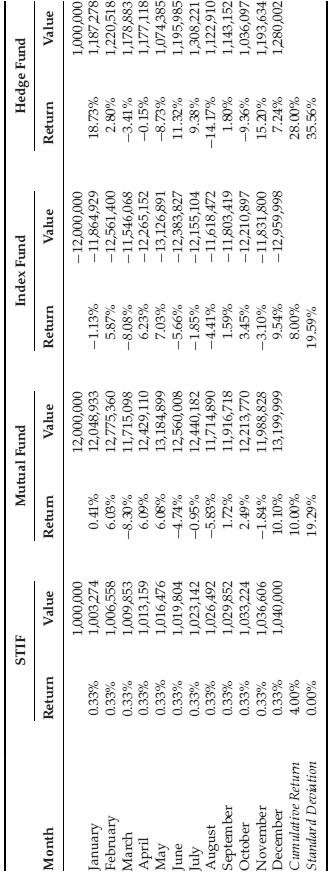
The $1 million investment in the short-term investment fund compounds at 0.33 percent per month for a cumulative annual return of 4 percent. The initial exposure to the mutual fund equals $12 million (12:1 leverage), while the initial exposure to the index fund equals negative $12 million (again 12:1 leverage). The value of the hedge fund each period, therefore, equals the sum of the short-term investment fund position and the mutual fund and index fund positions.
Her hedge fund strategy produced an annual return of 28 percent, which equals 12 times her twin brother's 2 percent alpha plus 4 percent from the funds invested in the short-term investment fund. The annualized standard deviation of her monthly returns is slightly less than 12 times her brother's active risk, owing to her hedge fund's allocation to the short-term investment fund. Thus, she produced an information ratio of 0.79 compared to her brother's information ratio 0.62. Her performance in this year, just like her brother's performance, was consistent with her performance in years past; hence she charges a 2 percent base fee based on the average of the beginning and ending total value of the hedge fund and a performance fee equal to 20 percent of profits after netting out the income from the short-term investment fund as well as the base fee.
Although we might be justifiably impressed by her hedge fund's performance, its standard deviation of nearly 36 percent may be too much risk for us to swallow. Moreover, we may be unwilling to pay such high fees. First of all, we would have to pay a base fee of $22,800:
![]()
Then on top of the base fee, we would have to pay a performance fee equal to $43,440, as shown in Exhibit 23.9.
Exhibit 23.9 Performance Fee
| Hedge Fund Gross Profit | 1,280,002 − 1,000,000 | 280,002 |
| STIF Profit | 1,000,000 × 4% | 40,000 |
| Base Fee | 2% × (1,000,000 + 1,280,002) ÷ 2 | 22,800 |
| Hedge Net Profit | 22,802 − 40,000 − 22,800 | 217,202 |
| Performance Fee | 20% × 217,202 | 43,440 |
The total hedge fund fee, therefore, would equal $66,240, compared to a total mutual fund fee charged by her brother of only $7,875 [0.75 percent × ($1,000,000 + $1,100,000) ÷ 2]. She charges more than eight times as much as her brother—or does she?
Remember, the mutual fund is a composite of market exposure and exposure to alpha. We could have achieved 80 percent of the mutual fund's total return by investing in a low-cost index fund. Moreover, suppose that the mutual fund returns are more than 98 percent correlated with the index fund returns. Why should we pay active fees for a product with such a large passive component?
The hedge fund, in contrast, is designed to have no market exposure, and in fact was slightly negatively correlated with the index fund returns during the period shown. We are comparing apples to oranges when we measure the fees of a hedge fund that delivers a pure alpha stream with the fees of a market-driven mutual fund. What if we combined a low-cost investment in an index fund with investment in the hedge fund, instead of investing exclusively in either the mutual fund or the hedge fund? Exhibit 23.10 shows the returns and values of a 90/10 mix of the index fund and the hedge fund.
Exhibit 23.10 Returns and Values of 90/10 Mix of Index Fund and Hedge Fund
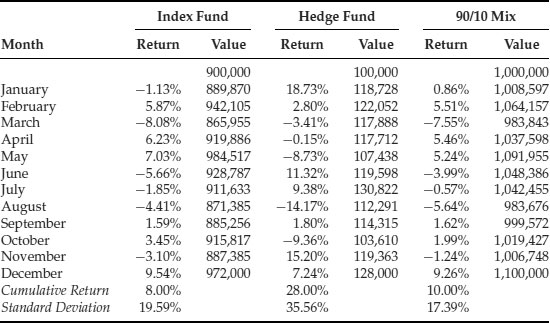
This particular mix of a $900,000 initial investment in the index fund, together with an initial investment of $100,000 in the hedge fund, produces precisely the same return as the mutual fund: 10 percent; and it achieves this result at slightly less risk: 17.39 percent versus 19.29 percent for the mutual fund. Moreover, the returns of this strategy are 99.85 percent correlated with the mutual fund returns. It is almost a perfect substitute for the mutual fund. But what does it cost?
Let's suppose the index fund charges five basis points, which is higher than what institutions typically pay for index funds. Exhibit 23.11 shows the total cost of investing in this strategy.
Exhibit 23.11 Total 90/10 Strategy Fee
| Index Fund Fee | .05% × (900,000 + 972,000) ÷ 2 | 468 |
| Hedge Fund Base Fee | 2% × (100,000 + 128,000) ÷ 2 | 2,280 |
| Hedge Fund Gross Profit | 128,000 − 100,000 | 28,000 |
| STIF Profit | 100,000 × 4% | 4,000 |
| Hedge Net Profit | 28,000 − 2,800 − 4,000 | 21,720 |
| Performance Fee | 20% × 21,720 | 4,344 |
| Total Strategy Fee | 468 + 2,280 + 4,344 | 7,092 |
The total fee for this strategy is $7,092 compared to the mutual fund fee of $7,875. It is cheaper to invest in the hedge fund alongside an index fund than it is to invest in the mutual fund. This comparison is apples to apples, because the mutual fund blends market exposure with active bets, and the 90/10 strategy mimics the mutual fund strategy. In the 90/10 strategy, however, we pay active fees for active exposure and passive fees for passive exposure. In the mutual fund strategy, we pay active fees for both the active and passive exposures. The mutual fund and the 90/10 strategy both have about the same passive exposure, yet the mutual fund fee exceeds the fee for the 90/10 strategy. Therefore, the implicit active fee of the mutual fund is greater than the active fee of the 90/10 strategy, which is the hedge fund fee.
There are several simplifying assumptions that underlie this analysis. I assume, for example, that the income from selling securities short exactly offsets the cost of purchasing securities on margin. In practice, there are net costs associated with the long/short strategy described in my example. My example also depends on specific assumptions about return, volatility, interest rates, and fee schedules, which all conspire to produce the result you see. Nonetheless, variations in these assumptions will not alter the essence of my argument, which is that hedge fund fees and mutual fund fees are remarkably similar when measured properly. Or perhaps it is not at all remarkable, but rather what efficient markets dictate.
Summary
Explicit mutual fund fees are typically less than 1 percent of assets under management. The typical hedge fund charges a base fee of 2 percent and, on top of that, a performance fee equal to 20 percent of net profits. The preponderance of mutual fund performance is driven by passive exposure to the market, yet the fee is applied to the total fund. Hedge fund performance, by design, is independent of market performance. We can mimic a mutual fund's performance by combining an index fund, representing the mutual fund's passive component, with a hedge fund, representing the mutual fund's active component. The fee of the combined fund, comprising a low-cost index fund and a high-cost hedge fund, is remarkably close to the mutual fund fee, revealing that the implicit fee of the mutual fund's active component is very close to the hedge fund fee.
NOTES
1. This problem was pointed out to me by Eric Rosenfeld, who posed a problem to my students at MIT who were asked to measure the extent of this performance drag.
2. With these assumptions, a 70/30 mix is optimal for an investor with quadratic utility whose risk aversion coefficient equals 1/3.
ABOUT THE AUTHOR
Mark P. Kritzman is president and CEO of Windham Capital Management, LLC. He also serves as a senior partner of State Street Associates, and he teaches a financial engineering course at MIT's Sloan School. Mr. Kritzman serves on the boards of the Institute for Quantitative Research in Finance and the Investment Fund for Foundations, and on the editorial boards of Emerging Markets Review, the Journal of Alternative Investments, the Journal of Asset Management, the Journal of Derivatives, and the Journal of Investment Management. Mr. Kritzman has written numerous articles for academic and professional journals and is the author of six books, including Puzzles of Finance and The Portable Financial Analyst. He has an MBA with distinction from New York University and a CFA designation.