
Chapter 10
Optimization and Performance
This chapter covers various strategies and techniques for isolating and optimizing performance bottle necks in your Daydream projects. Useful profiling and monitoring tools are introduced as well as practical methods for addressing common causes of frame rate deficiencies, with the aim of achieving of consistently high frame rates in your VR apps.
Optimization Strategy
Optimizing code requires a methodical approach in order to isolate problems and construct solutions until satisfactory efficiencies in the system have been reached. The process entails analysis, diagnosis, correction, and iteration, and presents a distinct challenge to the developer because it involves the necessary application of scientific rigor.
Two particular conditions must be addressed during Daydream optimization. The first is the establishment and the maintenance of a consistent frame rate. A frame rate of 60 fps is of utmost importance to control the quality of the experience while reducing the possibility of motion sickness. Second, thermal throttling can occur when the hardware is generating more heat than it can effectively expel. Thermal throttling functions as an internal safeguard that is designed to cool down and protect the device and is therefore very useful; but the mechanism also has the disadvantage of kicking the user out of VR.
The previous scenarios epitomize bad user experience but can be mitigated during performance optimization. This chapter covers strategies for isolating, analyzing, and preventing such problems in your project.
Asynchronous Reprojection
Asynchronous reprojection is a technique used by Daydream to decrease the perceived latency of the rendered scene during frame rate dips. Asynchronous reprojection holds the frame rate at a consistent 60hz by inserting the previously rendered frame in place if no frame is ready from the GPU. It takes into account updated rotational head-mounted device (HMD) tracking to smooth out the motion and remove the uncomfortable jittery effect; that is, a rapid shaking or shuddering that is created by dropping frames.
Isolating Bottlenecks
A good high-level strategy for keeping sustained stereo 60Hz frame rendering is first to find out where the performance hit is located, and then work out why it is happening.
Performance deficiencies are usually either GPU or CPU bound with a different solution for each depending on the type of problem. The GPU is often constrained by the number of pixels it is capable of drawing to the screen in a given frame, known as the fill rate, whereas the CPU is frequently constrained by the number of batches (or draw calls) it needs to issue to the GPU.
Isolating these performance deficiencies is achieved through the extensive use of profiling and analysis of the code. Various tools are provided by Unity and Daydream that can aid in this process and are introduced later in this chapter.
Fixing Bottlenecks
After the performance impediment has been discovered and understood, a fix can be worked on. Solutions will generally involve finding efficiencies with draw calls, geometry complexity, memory leaks, suboptimal compression, and memory management.
If performance shortcomings still persist after all avenues of possibility have been exhausted the pragmatic software engineer may simply “design out” the offending section by altering the game design.
Profile Early, Profile Often
Although it may seem antithetical to what is the common practice of not optimizing too early, getting into a habit of regularly profiling your work is a good idea. Performance is critical in VR and, therefore, leaving all optimization until the very end is unwise.
This is not to suggest overoptimizing before problems exist, but rather from an early stage be aware of the game’s memory footprint and its performance profile. The prudent Daydream developer will have begun monitoring early and regularly.
VR Performance Best Practices
To learn more about optimizing performance for Daydream VR (and AR), take a look at this in-depth article on the Daydream developer website:
https://developers.google.com/vr/develop/best-practices/perf-best-practices
Tools for Analyzing and Optimizing
The remainder of this chapter outlines techniques for finding, analyzing, and solving performance bottlenecks in Daydream. Daydream offers several ways to monitor and optimize the performance of VR apps separate from the standard Android and Unity profiling tools.
Analyzing
Daydream’s real-time monitoring tools can be accessed through the Developer Options section when entering Daydream (refer to Recipe 2.4). The Daydream developer monitoring capabilities include:
Enable developer logs: Includes additional log messages for VR developers when dumping messages to the command line in logcat (see Recipe 10.2).
Enable performance monitoring: Enables performance monitoring tools, such as a screen flash on missed asynchronous reprojection frames.
Enable performance heads up display: A diagrammatic overlay in VR that graphs out VR-related system information; see Recipe 10.1.
Display frame tracking bar: Renders a strip at the base of the viewport that cycles through a different color in every frame. When the frame rate drops low it is clear to see.
Enable VR screen capture using ADB: Allows screen captures and videos to be made of any running Daydream app via ADB.
Recipe 10.1 Daydream Performance HUD
The Performance Heads Up Display (HUD) visualizes real-time performance metrics in a heads up display over the running app. It is used to visually review the general performance characteristics of the app while you navigate through the scenes.
To get the HUD working, make sure you have the Daydream developer options enabled (see Recipe 2.4) and follow these steps:
Run the Daydream app and during the initial entry screens when prompted to sync the controller, tap the gear icon (with your finger) at the top right of the screen to enter the Daydream settings.
Select Developer Options > Enable Performance Heads Up Display.
Restart the app and the HUD should now be visible overlaying the screen. See Figure 10.1.
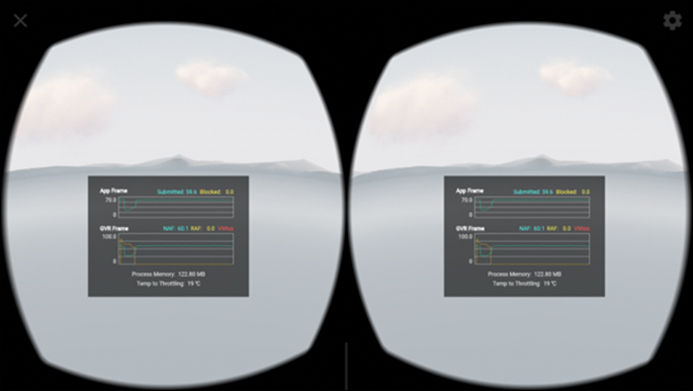
Figure 10.1 The Daydream Performance HUD. (© Google LLC)
The HUD metrics are:
App Frame Graph: Displays the rate at which frames are being submitted to the GPU, and how many frames were blocked waiting for the GPU render.
Gvr Frame Graph: The Gvr’s asynchronous reprojection pipeline. This pipeline potentially displays a new frame, or reuses an existing frame if none is available.
NAF: Stands for New App Frame. This should be hitting the native target frame rate of the device’s screen refresh rate, 60 Hz (or 60 fps) on an Android device.
RAF: Stands for Reused App Frame. This is the number of times per second a reused frame was displayed because a new frame was unavailable.
VMISS: Refers to Vsync Misses and means that the system was unable to reproject any frames.
Process Memory: The memory currently being used by all process. This is a useful metric to check when optimizing particularly for things like texture size.
Temp to Throttling: The temperature (in Celsius) at which thermal shutdown mode will kick in on the device.
Recipe 10.2 Analyzing: Using Logcat
Logcat is an Android Debug Bridge (adb, introduced in Recipe 2.2) command-line tool used for real-time logging of system and Unity messages while your app is running on the device. Logs are useful for optimizing and debugging sections of code that may be executing too many times, or not at all, and for checking that loops are running efficiently.
To use Logcat, follow these steps:
Make sure USB debugging is enabled on the device (see Chapter 2), connect the device to a computer via USB, and launch the Daydream app you want to debug. In the Terminal (Mac) or command prompt (Windows) enter this line of code:
adb logcat -d > myLog.txtThis dumps the contents of the session’s Unity logs and stack trace into a text file named myLog in the current directory. To stop logging, press Control+C in the Terminal on your keyboard. To only see Unity-related output, use the command:
adb logcat –s UnityTo trace out a custom log from Unity, use the
Debug.Log()method in your C# class:Debug.Log(“Log this my log”);
Optimizing: Daydream Renderer
The Daydream renderer is a tool that helps optimize textures and lighting in a Unity scene for better performance with minimal sacrifice in quality.
The Daydream Renderer focuses on these areas:
Lighting: Optimizes performance by moving most of the lighting calculations from pixel shaders to vertex shaders. This dramatically increases performance because most Daydream scenes will have significantly less vertices than pixels.
Materials: Converts existing shaders to optimized Daydream shaders.
Shadows: Allows for up to four “hero” shadows. These are optimized dynamic shadows that can be used for characters or enemies in the scene.
Performance Rendering: Uses single-pass rendering, which means the render texture is rendered only once for both eyes.
The Daydream Renderer comes included with the Daydream Elements package (see Recipe 2.1); or install it separately by downloading the Unity package from GitHub and dragging it into the Assets folder of your project. Find out more details about the inner workings of the Daydream Renderer at the GitHub: https://github.com/googlevr/daydream-renderer-for-unity.
Recipe 10.3 The Daydream Renderer Wizard
The easiest way to optimize a scene using the Daydream Render is with the helper wizard. Open any previous Daydream-ready scene from this book, or the example files has a scene ready called Chapter10_VertexLighting_Start, and follow these steps:
After installing the Daydream Renderer package, open a Daydream scene that you want to optimize. Open the Daydream Renderer Wizard by choosing Window > Daydream Renderer > Daydream Wizard.
If the scene does not already have a Daydream Renderer added to the root hierarchy, click the Add The Daydream Renderer To Your Scene button. This adds a GameObject called Daydream Renderer that has the renderer script attached.
The scene’s materials can be converted to Daydream Materials in the Materials Conversion Wizard. Click the Open Conversion Wizard button to get started. Converting all the materials in the scene for better performance is recommended. You will then be given the option to bake vertex lighting. Click Yes for maximum optimization. You may be asked to enable Vertex Lighting; select Yes, and then click Bake Scene.
An option to enable either Daydream Lighting (recommended) or Unity native lighting appears. You can set it up now or later through the Vertex Lighting window (Window > Daydream Renderer > Vertex Lighting).
Vertex Lighting Window
The vertex lighting wizard helps bake the scene’s lights to vertex shaders and gives granular control over the shaders. To open the vertex lighting window choose Window > Daydream Renderer > Vertex Lighting.
If the Daydream Renderer has not already been added to the scene, you will be prompted to add this and enable the Renderer. The materials and textures in your scene will then automatically be converted over to Daydream materials using the Daydream standard shader, and you will be prompted to bake the lighting.
The Vertex Lighting window will then be visible with control options for properties such as shadows, ambient occlusion, and ambient light. Click the Bake scene button to complete the process.
For more detailed information on each of the settings of the Daydream Renderers, Daydream materials, and vertex lighting options, see the documentation by clicking Open Documentation in the Daydream Renderer wizard.
Optimizing Frame Rate
The goal of frame rate optimization is to decrease the “motion-to-photon latency.” In other words, reduce the lag between the user moving her head and the HMD updating and drawing the new image on the screen.
Keeping the latency low and the frame rate high is of paramount importance for aligning the user’s vestibular and ocular systems to prevent motion sickness. This section sets out methods and strategies for solving frame rate issues by addressing performance overhead and inefficiencies.
Draw Calls
Draw calls happen in Unity every time a GameObject is rendered to the screen. They are expensive operations, made even more so by the fact that VR requires scenes to be rendered twice: once for each eye. Lowering draw calls to the GPU will significantly increase performance in your game.
As a general rule, for Daydream VR, draw calls should be kept to fewer than 100 per eye; that is, around 200 batches total per frame. You can check this number in the Profiler (see Recipe 10.3) or in the Unity Editor’s Game window in the Stats view.
To lower draw calls, Unity uses a process known as batching. Batching takes all the applicable vertices and meshes and combines them into a single mesh. The two types of batching in Unity are static and dynamic.
Static batching: Setting a GameObject to static combines its mesh with all the other static meshes in the scene. This single larger mesh only uses one draw call, dramatically increasing the performance of the game.
Static batching can only be applied to GameObjects that don’t move, such as walls, floors, and other fixed elements in the environment. Set a GameObject to static by selecting the Static check box in the top-right corner of the Inspector. See Figure 10.2.
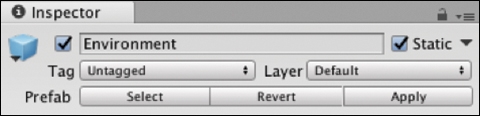
Figure 10.2 The Inspector showing a GameObject set to Static. Dynamic batching: This is used for smaller, similar GameObjects with less complex meshes and is handled automatically by Unity so no developer’s input needed.
Recipe 10.4 Using the Profiler to Analyze Draw Calls
The Profiler (introduced in Chapter 6) is the best place to start when attempting to isolate draw call issues. To work out how many draw calls are being made in your game, follow these steps:
Open the Profiler (choose Window > Profiler) while running the game in the Editor.
Pause the game in the Editor to analyze the code and processes that have been executed. Select the Rendering row and scrub the recorded timeline to isolate the section to analyze. In the Open Frame Debugger window below the Profiler timeline, you can see a reading of the draw calls for that particular frame. See Figure 10.3.
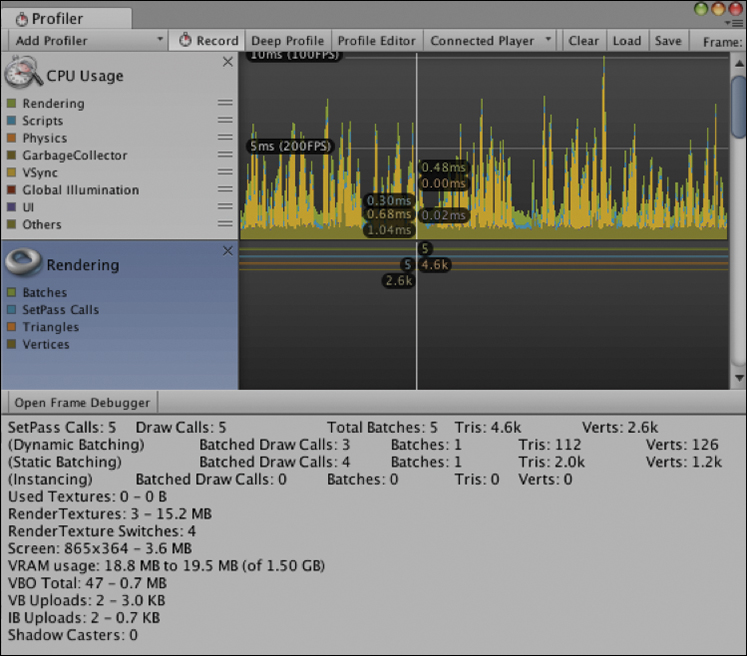
Figure 10.3 The Unity profiler showing the Rendering Open Frame Debugger window.
Texture Memory
Lowering the overall texture memory profile can significantly boost render performance. A number of techniques exist to do this, including compression, texture atlases, mip mapping, and asynchronous scene loading.
Texture atlases: A texture atlas packs multiple textures into one larger texture, thus decreasing multiple draw calls down to one.
Using texture atlases with 3D objects requires the models to be UV mapped to the texture atlas in 3D modeling software (Maya, 3DS, or Blender, and so on). The first step in this process is to use a texture packing tool (such as Texture Packer) to combine all the textures into one. You then import this optimized texture into 3D modeling software and UV map the texture correctly to the various models. You then import these UV-mapped models into Unity with the single texture attached. In Unity a material is created for each model from the texture. If the UVs are set up correctly the texture should map to the mesh.
Unity has a built-in texture atlas creation tool called Sprite Packer that is streamlined for 2D games. For 3D games many people prefer to use the commercially available Texture Packer. Mesh Baker is another popular app available from the Unity Asset Store that bakes textures and combines meshes and materials to improve performance.
Mip mapping: Mip maps create a low-resolution texture that displays when objects are far away from the camera or very small. When mip mapping is enabled, multiple textures are swapped out dynamically on the GameObject depending on its distance from the camera. This improves performance by only rendering high-resolution textures when needed.
Mip maps should be switched on by default. Confirm that mip maps are turned on by selecting the texture and in the Inspector under the Advanced section, select the Generate Mip Maps check box.
Compression: Compressing textures as much as possible is important optimization for lowering the overall memory footprint. Compression type can be set in the Inspector by selecting the texture, or when importing the texture.
Asynchronous loading: It is a good idea not to load one massive scene into memory. Instead, split your project into smaller scenes and asynchronously load and unload them as needed. See Recipe 4.5 for details on loading and unloading scenes asynchronously.
Polygon Count: Geometry
Another astute performance strategy is to lower the polygon count in the scene. Simplify complex geometry by removing faces of areas that will never be seen, such as the backs and undersides of objects.
A good general rule is to keep the number of polygons in the scene to under 100,000. The number of triangles (polygons) being drawn can be viewed in the stats overlay in the Game window by pressing the Stats button.
Lighting
Lighting is a processor-intensive operation. Although the Daydream Renderer takes care of much of the lighting optimization in a scene, I would be remiss not to cover the high-level concepts relevant to lighting optimization.
Bake lighting: Wherever possible it is a good idea to bake the lighting and remove dynamic lighting. Having any light settings set to auto is a bad idea in the Unity Light component. It is better to explicitly set the light to be important or not important.
As discussed previously, vertex lighting is cheap, and pixel lighting is expensive simply because there are more pixels on the screen than vertices. Again, most of this is automated for developers with the Daydream Renderer.
Baked light maps: These do not render in real time but calculate the light maps in advance on the GPU. A baked light map is basically a texture of all the lighting, and therefore, is static but it is cheap to use.
Shadows: Rendering shadows is an expensive operation. Try to use low-quality forms and switch them off on objects, such as the ground, that clearly don’t need to cast a shadow. Creating fake, low-quality shadows for your characters can be an effective workaround without the heavy overhead of dynamic shadows.
Light probes: Light probes offer high-quality lighting and are relatively fast to render.
Culling
Culling is the process of not rendering objects in the scene that are not visible in the camera’s field of view. There are various types of culling. In Unity the two main types are occlusion culling and frustum culling.
Occlusion culling: Using ccclusion culling is way of increasing performance by not drawing objects that cannot be seen by the camera, specifically because they are being obscured (occluded) by other objects.
Overdrawing is a wasteful process of drawing occluded objects that are not being culled; and you should minimize them wherever possible. Developers can view the overdrawing in the Scene window by selecting it from the scene view control bar’s drop-down menu.
Further information about the process of setting up occlusion culling in your game is covered in detail in the Unity manual: https://docs.unity3d.com/Manual/OcclusionCulling.html.
Frustum culling: Frustum culling does not render objects that are outside the camera’s field of view. Unity handles this by default but it is important to note that you can cull different objects at different distances by adding them to separate layers using
Camera.layerCullDistances. Use this to hide trivial visual elements at a closer distance and larger objects further away.
Be aware of the camera’s clipping planes. For better performance pull the far plane down as much as possible. If your game is based indoors, the far plane only needs to be set to the furthest wall.
Other Tricks and Tips
The following are some other general tips and concepts to help performance:
Level of detail (LOD): LOD groups swap between high- and low-res models based on their distance from the camera. Working in a similar way to mip maps, but for meshes, LOD groups associate several meshes of varying complexity with a GameObject and swap them out based on the GameObject’s distance from the camera.
You set up LOD groups using the LOD component in Unity. Various tools are available in the Unity Asset Store to aid in the creation of LOD group meshes.
Render scale: The scale at which the scene is rendered can be adjusted to trade off visual quality and sharpness for better performance. The render scale needs to be set in code, and it is an expensive operation so should only be done once at the very start of the app.
The default render scale is 1.0. Decrease this to improve performance. Use the following code to set the render scale, making sure to include the using UnityEngine.VR namespace at the top of the file.
void Start() {
    VRSettings.renderScale = 0.5f;
}
Object pooling: Creating an object pool is a good way to reuse objects instead of continually instantiating new ones. The idea is to enable and disable existing objects in the pool instead of the more expensive operation of instantiating new ones.
An example candidate for pooling would be the bullets and enemies from a shooter game. The objects are added to a list and instead of being destroyed they are disabled and reused when needed. If there is not an available object in the list, a new object is created and added. Objects can be created at the scene load and reused, or created on the fly as needed.
Light boxes: Beyond a certain distance the stereo effect ceases to exist. Prerendering backgrounds into a flat image, omnidirectional stereo image (ODS), or light box will not waste valuable draw calls and processing cycles on 3D geometry.
Avoid full screen passes: Effects such as bloom and depth of field that require a full screen pass are expensive and should be avoided.
Collisions: Where possible simplify collisions in the physics simulation. Complex collisions will cause a hit on memory and CPU.
Code optimizations: Unity has many unique and idiosyncratic patterns that have the potential to cause bottle necks if used overzealously.
Calling the GetComponent method from the Update loop is bad practice. Caching the result once in the Start method as a property and referencing the property is better. The same can be said for Unity’s other expensive methods for finding GameObjects and components. These should be used sparingly and never in the Update loop.
Summary
This chapter covered various strategies and techniques for optimizing Daydream VR projects, including
Following a process of finding where the performance bottleneck is happening and then why it is happening.
Using profiling and monitoring tools to better understand the source and nature of the problem.
Applying the Daydream Renderer to optimize lighting and materials in your Daydream scene.
Understanding and addressing other common causes for frame rate deficiencies such as draw calls, texture memory, and complex geometry to name a few.