
Using customer profitability and customer lifetime value to manage strategic accounts
Abstract
Today's economy is characterized by an increasingly globalized business-to-business environment, whereby a very large proportion of a supplier's overall revenue stream is generated by a very small number of customers. Because of the strategic importance of these customers, they should be considered assets of the company and treated accordingly. The performance of these customers should no longer be based on their revenues but on their profitability and lifetime value. This paper explains the concepts of customer profitability and customer lifetime value at an individual key account level. It also proposes a framework that guides strategic account managers during the account planning process, to improve the relationship with their strategic customers in a profitable way.
Introduction
Sales, and more particularly strategic account management, is undergoing a paradigmatic shift that involves a change in focus from managing customer accounts based on revenues to managing the accounts based on profitability for planning and follow-up; and to managing based on valuation for long-term strategic resources and investment-allocation purposes. This is triggered by an ever rising globalized business-to-business (B2B) environment, whereby a very large proportion of a supplier's overall revenue stream is generated by a very small number of customers. These customers, referred to as strategic customers, are often the product of close relationships that have been built over a period of many years and can therefore not easily be replaced. Losing such a customer can, for many organizations, never be compensated by the number of new customers acquired during that year. This means that losing a strategic customer may be decisive in failing to reach the organization's sales targets.
Many supplier organizations have responded to this situation by implementing special account management procedures and teams within their organizations, whereby each individual strategic customer is considered an asset of the company and no longer a commodity that comes and goes (Gupta and Lehman 2007). These intangible assets are critical and often dominant determinants of an organization's value (Srivastava et al. 1998). The people managing these strategic customers are no longer seen as salespeople but as managers or custodians of these high-value assets. Their task is to closely follow up and monitor the relationships based on account plans, and at the same time they have to nourish long-term relationships by managing the investments that the organization is willing to make for these customers.
Customer loyalty does not mean customer profitability per se
Relationship marketing emphasizes the need for maintaining long-term customer relationships. Customer profitability is supposed to be positively related to customer loyalty and customer satisfaction. This link between customer satisfaction and profitability is one of the cornerstones of customer relationship management (CRM) (e.g. Anderson and Mittal 2000; Reichheld and Sasser 1990). In recent years this link has been questioned by several researchers (Helgesen 2006; Reinartz and Kumar 2002; Soderlund and Vilgon 1995; Zhang et al. 2010), and while several studies found a link, others, such as Reinartz and Kumar (2002), found that the relationship between loyalty and profitability is much weaker – and more subtle – than the proponents of loyalty programmes claim. They found little or no evidence to suggest that customers who purchase steadily from a supplier over time are necessarily cheaper to serve, less price sensitive, or particularly effective at bringing in new business.
Very large customers are powerful and demand highly customized solutions, have high demands in terms of sales and account management, and are challenging in terms of profit (Brady et al. 2004; Piercy 2006; Sawhney 2004). They know their value to their suppliers and use it to get premium services or price discounts (Reinartz and Kumar 2002). They are also more knowledgeable about product offerings and are better able to assess the quality. In general, purchasing has become a strategic function with responsibilities for profitability, cost control and shareholder value (Janda and Seshadri 2001; Piercy 2006). Furthermore, many organizations have recognized the strategic value-adding potential of global procurement (Ellram and Carr 1994) and have therefore adopted integrated centralized purchasing practices (Olsen and Ellram 1997; Sheth and Sharma 1997). These organizations have reduced their number of suppliers by 40–90% (Emshwiller 1991; Ulaga and Eggert 2006). This enables them to increase their buying power and achieve further price reductions or transaction cost reductions with a smaller subset of suppliers (Ulaga and Eggert 2006). When professional purchasing managers use complex sourcing metrics to select the ‘right’ suppliers, and dictate terms on how they will be supplied, more than ever before supplier profitability is determined at the point of sale (De Boer et al. 2001; Piercy 2006; Talluri and Narasimhan 2004).
As a response, supplier organizations have been implementing special account management procedures and sales teams. Strategic account managers nurture long-term customer relationships (Arnold et al. 2001) by becoming trusted advisors for their accounts and by demonstrating a solution-driven focus (Sheth 2000). They are in charge of sales, customer satisfaction and ultimately profitability and customer value (Harvey et al. 2003).
Traditionally, the benefits of customer profitability and customer lifetime value (CLV) are discussed at an aggregated level for a customer segment or even the complete customer base. Such aggregated levels allow the calculation of customer equity linked with shareholder value, but we believe that there is a gap in the literature showing how these concepts can be used at an individual account level. This paper aims to contribute to the existing literature on customer profitability and CLV by focusing on an individual key account.
To implement CLV and reap the rewards we need a framework to guide strategic account managers during their account planning process. The measurement of customer profitability and CLV, and the definition of the optimal account development strategy, are the core of our proposed CLV management framework for strategic accounts. Kumar et al. (2008) developed a CLV management framework and field tested it at IBM, in order to better allocate visit frequencies to customers. Inspired by their work, we propose the CLV framework in Table 1 for a strategic account management setting.
Table 1: CLV framework for a strategic account management setting
| Process | Purpose |
|---|---|
| Measure customer profitability | Determine the methods for calculating the profitability of each customer |
| Measure CLV | Determine the lifetime value of strategic accounts |
| Define the drivers of CLV | Determine which factors influence the CLV of each account |
| Define the optimal account development strategy | Determine the optimal mix of activities that is likely to increase the overall lifetime value of the account |
We first discuss the importance and the methods available to measure customer profitability. Several cost-allocation methods are discussed, whereby arguments are presented in favour of activity-based costing. Second, we discuss the importance and relevance of measuring CLV. The limitations of using an individual measure rather than the traditional aggregated one are discussed briefly. Third, we will analyse in detail the financial and non-financial drivers of CLV. Finally, we will present an integrated account development framework which strategic account managers can use during their account planning process.
Measuring customer profitability
What is customer profitability?
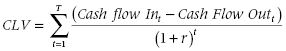
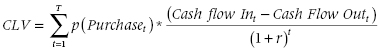
Customer profitability is the arithmetic difference between earned revenues and associated costs of an individual customer relationship, measured over a discrete time period such as a year (Jacobs et al. 2001).
![]()
where: t = the discrete time period over which the customer profitability is calculated.
The calculation of customer profitability is based on information of actual purchases the customer has made in the considered past time period and on the associated costs (Ryals 2008, p. 22). These data should be available within the company.
Why is customer profitability relevant?
The costs of marketing, selling and servicing customers can vary significantly (Benson et al. 1987). As a result, it is possible for a company to have profitable products and at the same time incur customer-related costs that make certain customer relationships unprofitable (Hilton 2008). Research shows that not only small customers but also large customers can be unprofitable (Reinartz and Kumar 2000; Sharma 2003, 2006). Customer profitability management helps to allocate the right costs and revenues at customer account level, leading to a clear view on the profitability of the customers. Since the ultimate objective of companies remains to make a profit from selling products and services, measuring and managing customer profitability has become an essential part of customer relationship management.
How can customer profitability be measured?
Costs
In their zeal to delight customers, some companies actually lose money with their customers because they become customer-obsessed rather than customer-focused. They want to satisfy their customers at all costs and in this light they offer additional product features and services but fail to receive prices that cover the costs. To avoid this, suppliers need an in-depth understanding of the total cost of the delivered products and services (Kaplan 2005).
Costs can be split into two main categories: the first contains all costs linked to the production of goods, i.e. the ‘cost of sales’, while the second covers the costs generated by servicing the customers, i.e. ‘cost to serve’. In standardized production and service environments the ‘cost of sales’ will not be impacted by customer behaviour, allowing suppliers to focus on determining and controlling the ‘cost to serve’ (Shapiro et al. 1997). Costs of serving customers can vary significantly, triggered by the fact that some buyers can negotiate more aggressively, or take advantage of differential discounts because of their size, or because they can perform functions themselves, such as in-house maintenance or technical support (Benson et al. 1987). When working with strategic accounts, strategies, processes and systems become interwoven, leading to a situation where the split between the two cost categories becomes less obvious. It is therefore important that in the first step, costs of all natures are considered and listed and in the next step, only the costs caused by the customer and funded by the supplier are assigned (see Table 2).
Table 2: Cost nature categories
| Cost nature | Short description |
|---|---|
| Pre-sale costs | All costs related to activities in the sales process, prior to the moment that the contract is closed |
| Production costs | Contains both the one-off costs such as design, set-up, testing, regulatory and the recurrent production costs |
| Distribution costs | All costs made to transfer the goods to the supplier |
| Post-sale service costs | This category is often neglected. Sometimes customer training, installation, technical support, and repair and maintenance are profit-making operations, but businesses bundle such services into the product price and the buyer pays ‘nothing extra’ for them |
Revenues
Depending on the industry and products that are sold, different revenue types can be more or less important. Each organization has to decide which revenue types they want to include. Some types, such as gross sales income, fees, commissions, margins, discounts, rebates and refunds, are generic and quite simple to allocate, while others, such as financial interests, exchange of assets, exceptional revenues and any other increase in owner's equity, can be more complicated. As soon as the activities or behaviour of a customer generates revenues, the effort to link the revenues to the customer should be made. The majority of revenues that can be influenced by the account manager are generated by the gross sales income, which is calculated by multiplying the price at which goods or services are sold by the number of units or amount sold. Customized pricing policies are at the heart of any strategy to manage customer profitability.
Multiple pricing strategies exist: there is not ‘one pricing strategy’ that is the best in all situations, so the adoption of a pricing strategy is a learning curve driven by studying the needs and behaviours of customers.
The most commonly applied pricing strategies are:
- Cost-based pricing: the price is determined by adding a profit element on top of the cost of the product. The main advantage of this approach is that prices are relatively easy to calculate. If the profit element is applied consistently, the business can also predict more reliably what the overall profit margin will be. The main weakness of cost-based pricing is that aspects related to demand (willingness to pay, price elasticity) and competition (competitive price levels) are ignored. In the context of strategic account management, cost-based pricing is rare because customers often have a good view on the actual costs since they are more involved in the total production process. Some customers even demand total transparency of the costs of the products that they buy and often they are not prepared to pay a price higher than the intrinsic value of the offer.
- Value-based pricing: the approach uses data on the perceived customer value of the product or service as the main factor for determining the final selling price. This approach is driven by a deep understanding of customer needs, customer perceptions of value, price elasticity and customers' willingness to pay. The big disadvantage is that this information is usually hard to find and interpret. Furthermore, a customer value-based pricing approach may lead to relatively high prices, especially for unique products. Though that will have a positive impact on the customer profitability in the short run, this pricing approach may spur market entry by new entrants offering comparable products at slightly lower prices. Finally, it is important to note that it is an error to assume that customers will immediately recognize and pay for a truly innovative and superior product. Marketers must educate customers and communicate superior value to customers before linking price to value. Customers must first recognize value in order to be willing to pay for value, rather than basing their purchase decision solely on price (Hinterhuber and Liozu 2012). In the context of strategic account management it is often the uniqueness of the combined offer of products and services that creates an added value for which the customer is willing to pay a supplement (Woodburn et al. 2004).
- Risk-based pricing: this pricing strategy has already been used for years in the financial sector. Engagement with customers or assets with a higher risk profile has to be compensated by higher returns. In the context of strategic account management, the risk element is represented by the stability of the relationship, both commercially (e.g. has this company already been a customer for many years?) and financially (e.g. does this customer always respect payment agreements?). The more ‘stable’ a customer is, the better the pricing conditions that can be awarded. However, risk-based pricing also brings a perverse effect, which occurs because higher-risk customers are charged a higher margin on products and services, so revenue from them is higher than from a lower-risk customer. If not properly managed, account managers could become motivated to promote deals with customers that offer higher risks.
- Competitor-based pricing: this approach uses price information from actual or potential competitors as a primary source to determine appropriate price levels. The strategy should be used only if price is one of the most important purchase criteria for customers. The main advantage of this approach is that the competitive situation is taken into account, while the main disadvantage is that aspects related to the customer's demand function are ignored. Competitor-based pricing should be used with caution, to avoid a price war (which has happened in both the car and the airline industries).
Allocation methodology
The biggest challenge in calculating customer profitability is reliably measuring and assigning the costs to the customers. Unlike revenues and direct costs, indirect costs require a method to allocate them to individual customers. Management accounting systems often treat these indirect costs coming from marketing, finance, IT, facility management, HR, and customer service as a layer of overheads to be spread evenly over all customers. It is simply not true that customers buying the same amount of goods or services need the same amount of time and attention (Ryals 2002). Costs of different types will be influenced by a number of customer-specific elements (see Table 3).
Table 3: Cost type influencers
| Cost type | Influencers |
|---|---|
| Pre-sale costs | Different entities of the customer that need to be visited can be spread over multiple locations which are geographically dispersed and located far from the salesperson's home base. Some customers require seemingly endless sales calls, while others place their orders without delay. Some must be courted with top-level executives backed up by sophisticated account management techniques, while others need little special effort. |
| Production costs | Order size influences cost, as do set-up time, scrap rate, custom designs, special features and functions, unusual packaging, and even order timing. Off-peak orders cost less than those made when demand is heavy. Some orders call on more resources than others. A company that stores products in anticipation of orders, however, will have difficulty tracing production costs to particular orders and customers. |
| Distribution costs | Fast delivery costs more. Costs vary with the customer's location. Shipping via preferred transportation mode. Lack of back-haul opportunities. Special logistics support such as a field inventory entails cost. |
| Post-sale service costs | Post-sales is completely customer specific and these costs must certainly be individually monitored. |
A uniform spread of indirect costs over all customers can be triggered by the faulty impression that prices and costs are correlated, but research (Berger et al. 2006) suggests that usually they are not, which produces a broad dispersion of account profitability. Instead of valuing customers based on an arbitrary cost distribution, installing a cost-allocation method that assigns the indirect costs based on a rationally supported methodology allows much better assessment of the value of a customer (Gupta and Lehman 2007). Cost-management systems have to be used to determine the activities, costs and profit associated with serving particular customers (Hilton 2008). Different cost-allocation methods are possible, but each of them will lead to a different result and thus different estimates of customer profitability. Establishing reliable profitability figures for customer accounts is not straightforward, but the following methods are in use:
- Cost/Income ratio: all indirect costs are spread proportionally over all customers according to their gross revenue.
- Standard unit costing: this method allocates the company's fixed costs over a given period of time to the items produced during that period. The standard unit costing method can provide added value in a production environment, but it will not be very effective in those organizations where non-standardized products are manufactured and services are rendered.
- Volume-based costing (also called traditional costing): this product-costing system allocates overhead costs to a single cost pool (e.g. factory overhead) and then volume-based cost drivers are used to allocate the overhead costs to individual products or services. The cost drivers mostly depend on the number of units manufactured. Cost drivers, which can be plant-wide or departmental, often include labour hours, machine hours and labour costs. This method is best applied where large, unique, high-cost items are built to order rather than mass produced, and when many costs can be directly traced to each job.
- Activity-based costing: ABC, described by Cooper and Kaplan (1991), is a costing model that identifies all activities performed in an organization and assigns the costs linked to each of these activities to all products and services, to the extent of their actual consumption of these activities. As such, ABC translates indirect costs into direct costs. In this way an organization can establish the true full cost of its individual products and services. The ABC methodology assigns all of an organization's resource costs, through activities, to the products and services provided to its customers. ABC is generally used as a tool for understanding product and customer service costs, and has predominantly been used to support strategic decisions such as pricing, and identification and measurement of process improvement initiatives. It enables companies to have a better understanding of their cost structures and the profitability of their customers. Armed with this information, companies are better able to drive down the cost of sales and focus on those customers that are profitable (Sheth and Sharma 2008).
Choosing a method
To calculate trustworthy customer profitability, revenues and cost must be correctly allocated to the right accounts. The main difficulty lies in the assignment of indirect costs to individual customers on a reliable basis, which is essential for changes in customer behaviour to be translated into costs assigned to them. The first three cost-allocation methods (cost/income ratio, standard unit costing and volume-based costing) allocate costs without sufficiently taking into account customer behaviour and individual customer characteristics. The correct costs of a customer can be calculated only by determining all activities and costs associated with serving particular customers (Hilton 2008). The ABC method is the only method where different consumption of services directly influences the costs allocated to the customers. Moreover, a change in behaviour of the account will only be reflected in the costs allocated to the account via ABC and not via any of the other allocation methods (Benson et al. 1987; Nachnani 1998; Woodburn et al. 2004). Even though implementing ABC is time consuming and thus expensive, it is the only methodology that returns a meaningful cost at customer level which can be used in a strategic account management approach. Alternatively, time-driven ABC also provides a meaningful cost at customer level but at a lower level of complexity and thus at a lower cost.
What are the shortcomings of using customer profitability?
The idea that customers are to be considered as assets is gaining acceptance, which leads to the development of literature on how to measure customer value (Berger and Nasr 1998; Gupta et al. 2004; Jain and Singh 2002; Mulhern 1999; Reinartz and Kumar 2002; Rust et al. 2001). The most important responsibility of key account managers is to retain and develop their accounts in order to maximize the value of the customers to the supplier organization. But what is the value of a customer? How can we use customer profitability as a measure of current and future value?
Calculating the value of a customer is not possible with financial metrics based on past performance, such as accounting-based profitability (Gupta et al. 2006; Stahl et al. 2003). Estimation of the total value of all customer assets, also called customer equity (CE), is made by taking the sum of the current and projected future cash flows of all customers (Blattberg and Deighton 1996). Future-oriented customer profitability calculates the net present value (NPV) of future expected costs and revenues associated with serving a customer over their entire future life. This is also known as customer lifetime value analysis (e.g. Berger and Nasr 1998; Dwyer 1989; Hoekstra and Huizingh 1999; Jain and Singh 2002).
Measuring customer lifetime value
What is customer lifetime value?
CLV is a central metric for assessing the profitability of customers: it equates to the present value of all future profits generated by a customer. The idea of CLV is derived from NPV analysis, where the NPV of a financial asset is the sum of the discounted future cash flows that will be generated from the asset. Effectively, CLV is the NPV of a customer's future profits. One common approach is to assume that we know the duration of a customer's lifetime, and then calculate a discounted cash flow for that time period (Berger and Nasr 1998; Blattberg and Deighton 1996; Gupta and Lehman 2007; Jain and Singh 2002).
The CLV measure incorporates the probability of a customer being active in the future, the future contribution margin and the future costs required to retain the customer. All these factors, used to calculate CLV, are essential for designing account management strategies. It is important to understand that CLV is a method to predict or forecast future customer behaviour.
Other methods such as recency, frequency and monetary value (RFM), share of wallet and past customer value also allow the prediction of customer behaviour. RFM is a technique widely used in marketing to predict future customer buying behaviour based on the customer's past purchasing patterns, and therefore requires a past purchasing history database in order to forecast future customer behaviour. The share of wallet of a customer consists of comparing the level of spend of an existing customer on a particular product or service category with the supplier versus the complete spend of a customer, which requires an estimate of the customer's complete spend in a particular product or service category. Past customer value is based on past cumulative customer profitability adjusted for the time value of money.
These techniques rely on past data and performance to predict future performance and are based on the assumption that the customer will be active in the future. They lack the probability of the customer being active in the future, as well as an estimate of the costs required to retain the customer. They also rely on the availability of a lot of historical data from which they compute averages. Key accounts are not average accounts and therefore none of these techniques is appropriate for valuing key accounts.
Why is customer lifetime value relevant?
By using CLV an organization can rank its customers or classify them into tiers based on their expected profitability, so firms can appropriately allocate resources across high- versus low-value customers (Reinartz and Kumar 2003; Rust et al. 2004; Venkatesan and Kumar 2004). An analysis of customer profitability may well show that some of the large customers are in fact unprofitable customers (Cooper and Kaplan 1991; Niraj et al. 2001). CLV may also help in revising existing discounting structures to improve profitability (Kalafatis and Denton 2000), and it may be used for making customer acquisition decisions so that a firm does not spend more on acquiring a customer than the CLV of that customer (Gupta and Lehmann 2003; Gupta and Zeithaml 2006). It allows firms to balance their resources between customer acquisition and customer retention (Reinartz et al. 2005). Recent studies also show that CLV can provide a link between customer value and firm value (Gupta et al. 2004). The CLVs of all the current and potential customers form a firm's customer equity (e.g. Rust et al. 2004; Villanueva et al. 2008), which has been found to be a good proxy measure of the firm's equity-market valuation (Gupta et al. 2004). Thus, the CLV framework helps bridge marketing and finance metrics.
How can the CLV of an individual customer be measured?
Traditionally, CLV is calculated by discounting future cash flows over the lifetime of the customer.
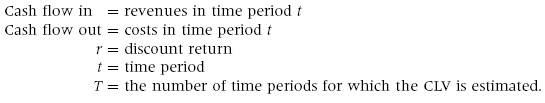
The discount rate is based on the cost of capital of an organization. The minimum discount rate of an organization is its weighted average cost of capital (WACC). WACC is defined as the weighted average cost of debt and the cost of levered equity (Gallagher 2000) and is calculated as follows:
![]()
The WACC is the cost of equity (Costeq) multiplied by the proportion of equity funding and the cost of debt (Costdeb) multiplied by the proportion of debt funding reduced with corporate tax benefits (t) (see Tables 4 and 5).
Table 4: Example of calculation of WACC (assuming corporate tax rate of 20%)
| Amount | Cost | |
|---|---|---|
| Equity | 75,000 | 10% |
| Debt | 50,000 | 5% |
| Tax | 20% | |
| WACC | 0.076 |
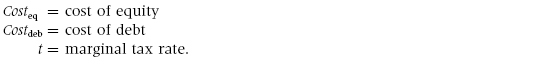
Table 5: Example of calculation of CLV using WACC (assuming WACC of 7.6%)
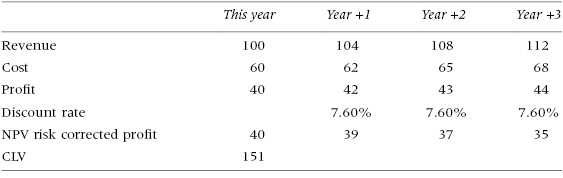
The feasibility of making accurate estimates for revenue and cost is most significant in setting a realistic time horizon. According to Gupta et al. (2004), a time period from three to five years is appropriate for the following reasons:
- Estimates further in the future will be less reliable and therefore undermine the confidence that is put in the resulting measure.
- Information of later years will have significantly less impact on the customer value due to the applied discount factor.
Further, in most cases the majority of a customer's lifetime value is captured within the first three years (Gupta and Lehmann 2005).
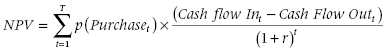
Traditionally, CLV calculations assumed a contractual setting between the customer and the supplier whereby future cash flows are known. While it is reasonable to assume that relationships between an organization and its key customers are based on contractual agreements, it is not reasonable to assume that therefore all future cash flows are known. Key account relationships often comprise a multitude of products and services that are sold in the form of projects and contract agreements. Although existing projects and agreements come to an end, new ones are constantly being formed based on new business opportunities at the account. Even existing contracts are often renegotiated through the contracts life cycle. For these reasons a supplier needs to know the probability of its future cash flows:
where: p(Purchaset) = probability the customer will purchase or continue purchasing in period t.
The formula assumes that there is only one project or contract agreement with the customer, which is often not the case with key accounts. Therefore, we first need to calculate NPV of each individual project or contract, taking into account the purchasing probability. CLV is then the sum of the probability-adjusted individual NPVs for the account:
where: NPV = net present value of an individual project or contract at the customer p(Purchaset) = probability the customer will purchase or continue purchasing in period t.
The current formula includes the sales/account management costs as part of the outgoing cash flows. However, a large amount of these costs will be generated regardless of whether the customer purchases or not. Costs related to the acquisition, development and retention of key accounts need to be included in the overall CLV, which raises the question of whether to include these key account management costs at the level of the individual project or contract, or at the overall customer level. The answer depends on how the key account management programme is organized.
As explained in Gupta and Zeithaml (2006), depending on the use of model, acquisition costs have to be included implicitly where the lifetime value of an as-yet-to-be-acquired customer is considered. If, however, expected residual lifetime value is calculated, the acquisition cost should not be included. For example, large matrix organizations, such as IBM, have dedicated key account managers and technical architects for specific customers, whose costs are attributed at individual customer level. However, when they are selling a particular solution they include product experts who are salespeople working in specific IBM business units. If there is no opportunity, these specialist salespeople will not be called upon, so their costs are specific to each individual business opportunity.
Following Reinartz and Kumar (2003), we can adjust the formula as follows:
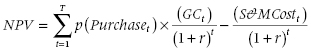
where: GC = Gross Contribution Margin
S&MCost = Sales and Marketing Costs.
CLV is the sum of the NPVs of all existing and potential projects and contracts minus the costs associated with developing and retaining the key account.
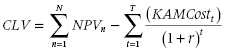
where: N = number of existing and potential projects and contracts
n = current project or contract
KAMCost = costs of managing the key account as whole.
Several methods exist to calculate the probability that a customer will purchase or continue to purchase. Choosing a method depends on the characteristics of the customer exchange process. In the context of managing strategic accounts, the knowledge available from the account managers takes precedence over statistical calculation based on averages.
Scoring is a qualitative way of measuring specific types of probabilities based on understanding of the accounts. The scorecards usually consist of a set of opportunity qualification criteria which, when weighted, provides a probability of success. The advantage of this method is that it makes it very clear what are the drivers for winning the opportunity.
Example
A highly simple form of scoring opportunities is to assign probabilities to each stage of the sales process. The total value of the opportunity is multiplied with the probability factor, resulting in a forecast value:
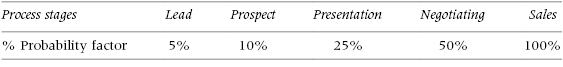
For existing contractual business it is common to take a probability of 100% for the duration of the contract. The renewal of the contract can be considered as a new opportunity for which probability can be scored based on the ‘strength of the relationship’. Strength can be measured based on a number of weighted relational elements, where the most important are longevity of relationship, number of different products/services that are bought, quality of relationship and number of contacts between supplier and customer (in both directions). This approach to measuring the ‘strength of the relationship’ refers to the customer portfolio strategy matrix developed by McDonald et al. (1997), which can then be used as a basis for determining the probability of retention.
Defining the drivers of CLV
According to Srivastava (2001) there are four key financial drivers through which a strategic account manager could create shareholder value:
- Enhancing cash flows by selling more or reducing costs. Strategies to increase the share of wallet, increase pricing and increase cross-selling to existing customers lead to higher sales. Costs can be reduced by improving the efficiency of internal processes or by leveraging external resources, such as involving the customers in completing certain parts of the value-creation process.
- Accelerating cash flows, as earlier cash flows are preferred because of the risk and time adjustments of later cash flows.
- Reducing vulnerability and volatility of cash flows. Vulnerability of cash flows can be reduced by increasing customer satisfaction, loyalty and retention. Cash flow vulnerability can also be reduced by cross-selling products and services less vulnerable to competitive actions.
- Augmenting the long-term value of the account by carefully investing in servicing processes and value propositions that will provide a platform for future cash flows.
A strategic account manager can influence these drivers by developing better relationships, adding more value and reducing the time to money of future business opportunities.
Developing better relationships
Beside calculating and knowing the lifetime value of a customer, key account managers need to know how they can actually influence it. So far we have looked at the probability of purchase at an opportunity or contract level. However, a key account is more than the sum of the underlying opportunities and contracts. The relationship is often cited as the additional element that keeps all the individual business opportunities together.
A number of researchers have identified a series of relationship stages associated with different levels of intimacy (Dunn and Thomas 1994; McDonald et al. 1997; Palmer and Bejou 1994). Specific drivers of customer relationships are interdependence, trust, joint planning, dedicated teams and multi-level contacts. These relationship levels are defined by the frequency of interaction, the depth of the interactions and their scope. The more people from both the seller and the customer organization in communication with each other over a wide range of issues, the higher the level of intimacy that will develop. According to Oliver and Winer (1987), customers who buy more, more frequently and across different categories will have a better relationship with their suppliers. While selling across different categories will help to build relationships, so will selling across different departments or business units within a single customer. According to Srivastava and Shocker (1997), a customer's switching costs increase with multiple relationships with the same supplier. When these relationships are satisfactory and frequent they lead to a greater level of trust, which again leads to longer and more intimate customer–supplier relationships (Morgan and Hunt 1994).
Reinartz and Kumar (2003) researched the drivers of CLV. While their research focused on a business-to-consumer setting, their findings are, to some extent, transferable to a business-to-business setting. They categorized the drivers as exchange characteristics and customer heterogeneity. Exchange characteristics describe the process and nature of the exchange between the supplier and the customer, including elements such as cross-selling, spending levels and customer royalty levels. Customer heterogeneity describes the type of the customer, such as industry sector, size or other demographic variables (see Table 6).
Table 6: The drivers of CLV
Source: Reinartz and Kumar (2003)
| Drivers | Impact | Impact on customer profitability |
|---|---|---|
| Spending level | Average monthly spending level over a given period | (+) |
| Cross-buying | Number of different products/categories purchased | (+) |
| Focused buying | Purchase within one category | (−) |
| Inter-purchase time | Average number of days between purchases | (∩) |
| Loyalty instrument | Customer's ownership of company's loyalty instrument (B2C) or availability of line of credit (B2B) | (+) |
| Mailing effort by the company | Number of mailing efforts of the company (B2C) or the number of contacts (B2B) | (+) |
| Income | Income of the customer (B2C) or income of the firm (B2B) | (+) |
| Population density | Number of people in a two-digit zip code (only B2C) | (−) |
Adding more value
In a business-to-business setting, relationships are built only if they add value to both parties. According to Grönroos (2008), value for customers means that they are or feel better off than before after having been assisted by the provision of resources or by a process or a set of processes. So what can strategic account managers do in order for their customers to feel better during and after purchasing their products and services? According to Prahalad and Ramaswamy (2000), customers want to exercise their influence and interact with their suppliers and thereby co-create value. They argue that by implementing co-creation the customer is being involved in marketing and product development activities to strengthen a sustainable relationship. Increasing customer loyalty or reducing market research costs are other examples of drivers for companies to engage in the process of co-creation (Nambisan 2002; Payne, Storbacka, and Frow 2008).
Suppliers in co-creation also benefit from productivity gains, whereby customer labour substitutes for supplier labour (Fitzsimmons 1985; Lovelock and Young 1979; Mills and Morris 1986). In all cases, transforming the customer into an active participant is the central concept, in order to be able to deliver them maximum value. The process relies on a meaningful dialogue between the customer and the supplier whereby both gain access to knowledge and transparency of information. In return, customers will also bear more responsibility for dealing with the risks associated with the co-creation process. Prahalad and Ramaswamy (2005) conceptualized the co-creation process in a model called the DART (dialogue, access, risk–benefits, transparency), which allows strategic account managers to add value to their customers by:
- Enhancing the dialogue, which means more than listening to the customer, and involves sharing information and learnings across the whole co-creation process, not only with the customer but also with other parties involved.
- Ensuring that all parties involved in the process have complete access to all the necessary information and tools.
- Ensuring that all parties are fully aware of the risks associated with the co-creation process.
- Ensuring transparency between all parties involved.
Reduce time to money
The time horizon is an important element in CLV, whereby earnings today are more valued than earnings tomorrow. What can a strategic account manager do to shorten the length of time before earning any revenues?
The more people involved in making a purchase decision, the more complex the decision-making process and the longer it will take. Often in a B2B context the person or department who experiences the problem is not the same as those who can make the purchase decisions: a decision-making unit analyses the problem and the proposed solutions in order to make a purchase decision. The ‘time to close’ for business opportunities can be shortened by selling high into the customer organizational hierarchy. Often the higher people are in the hierarchy, the more authority they have to make purchase decisions. By focusing the sales effort on demonstrating how the supplier's products and services can solve their problems, strategic account managers can shorten the sales cycle.
The amount of risk the customer perceives with the purchase also causes long purchasing cycles. According to Shapiro (2001), perceived risk levels can be reduced by offering:
- A trial or pilot project to demonstrate the benefits of the value proposition.
- A ‘Trojan Horse’, which is a limited module of the whole value proposition, so the customer gets better acquainted with the system and what it can mean for them. This can be a module with one of the most popular features which make the initial first module purchase attractive.
- Usage- or performance-based pricing.
- Special introductory discounts.
Define the optimal account development strategy
Most studies focused on the value of calculating CLVs in order to segment customers and allocate resources accordingly. This raises the question: ‘What is the value of calculating the CLV for an account manager who manages only a few key accounts?’
Calculating customer profitability and CLV for key accounts is really useful only if account managers use them to manage their accounts. In our view, the value lies in the insight provided by the analysis of the CLV and how it can be improved. We compared our approach with an existing key account planning approach used in a large international systems integrator. While their approach encompassed most of the components of CLV, they did not calculate it into a single value. In their view the benefit of calculating the CLV of their strategic accounts would not be the value itself but to provide a framework of how all these components relate to each other. To that extent we further developed an account development framework linking all the financial and non-financial drivers of CLV (see Table 7). We proposed this framework as a tool to help strategic account managers to analyse their accounts and develop optimal account development strategies.
Table 7: Framework linking financial and non-financial drivers of CLV
| Drivers | Impact | Impact on customer profitability |
|---|---|---|
| Increase share of wallet | Increase in the customer share of wallet enables a supplier to sell more and to reduce their costs through economies of scale. | Increase cash flows |
| Increase cross-selling | Cross-selling products enables a supplier to sell more, to establish more revenue streams from one account, thereby reducing their vulnerability and volatility of their revenues. Number of different product/categories purchased (Reinartz and Kumar 2003). | Increase cash flows Reduce vulnerability Reduce volatility |
| Increase co-creation with customer | Involving the customer in the design, production and delivery of the value proposition offers the possibility of reducing costs for the supplier and increasing value for the customer. | Reduce vulnerability Reduce volatility |
| Changes in pricing model (volume based, usage or performance based pricing) | Introducing new pricing models such as volume, usage or performance based pricing reduces the customer perceived risk in the purchase. Some business buying has converted to a subscription model already in order to reduce the perceived risks of their customers. | Accelerate cash flows Reduce vulnerability |
| Offer special discounts | Cash flows can be accelerated by offering special discounts (Shapiro 2001). | Accelerate cash flows |
| Offer pilot projects or paid proof of concepts | The financial exposure of a customer can be reduced by scaling down the size of the purchase. A pilot project or even proof of concept can help the customer to reduce their perceived risk in the purchase (Shapiro 2001). | Accelerate cash flows |
| Gain access higher up the customer's organizational hierarchy | Selling directly to people higher up in the organization's hierarchy can lead to shorter and less complex (costly) sales cycles. | Increase cash flows Accelerate cash flows |
| Provide more customized solutions | Providing customized solutions allows suppliers to become more embedded in their customers' operations, which increases customer loyalty and decreases the probability that customers can replace the firm with a competing supplier (Sawhney 2004). | Reduce vulnerability Increase long-term value of the account |
| Increase multi-level contacts | Increasing contact frequency across multiple levels of both organizations leads to higher customer profitability (Reinartz and Kumar 2003). Dialogue between different levels in the organization is essential to promote co-creation and to develop a climate of trust (Prahalad and Ramaswamy 2000). | Reduce vulnerability Increase long-term value of the account |
| Introduce a joint planning process | Joint strategic planning process, where the customer is actively involved, increases the commitment levels of the customer and is linked to customer satisfaction and loyalty (Woodburn et al. 2004). | Reduce vulnerability Increase long-term value of the account |
| Increase customer satisfaction levels | Customer satisfaction influences repeat purchase behaviour (Bolton 1998), ‘word of mouth’, (Anderson 1998), cross-selling rates (Verhoef et al. 2001), purchase of premium options (Ngobo 2005) and price premiums (Homburg et al. 2005). Highly satisfied customers are likely to recommend the firm's products to other consumers (Anderson 1998), generate additional business at a lower cost for the firm (Villanueva et al. 2008) and reduce suppliers' operating costs associated with defects and complaints (Fornell and Wernerfelt 1988). | Reduce vulnerability Increase long-term value of the account |
Conclusions
There is mounting evidence that organizational structures are evolving towards closer alignment with their markets (Day 2006). This development has been applauded by organizational theorists who endorse smaller, customer-responsive units, in which focus is shifted from products to service and from products to solution. In this customer-focused selling or consultative selling model (Arnett and Badrinarayanan 2005), the sales organization owns the relationship with the customer and is responsible for its own balance sheet.
In strategic account management, firms increasingly need to assign sales/profit responsibilities to the sales organization (Millman 1996). Sales directors realize that long-term profitable relationships with customers ask for long-term investments. The multi-year customer lifetime value approach is the only method to determine whether these long-term investments in customers are paying off. CLV analysis needs to be included in account management processes and, more specifically, in the account planning process. In this paper we have presented a framework through which strategic account managers can use customer profitability and CLV as a framework to define their account strategy.
Besides the financial value, captured in the CLV calculation, customers have a relational value. According to Ryals (2008), there are four sources of relational value. The first is the reference value, which is generated by associating with customers (hence high-profile customers shown in business brochures, for example). The second is the referral value, which is created when existing customers recommend the supplier to a potential new customer. Third, the learning value comes from the process and quality expertise customers pass back to their supplier. The last is the innovation value which is triggered by customers who push their suppliers to participate in their joint product or process innovation. The first two types will simplify the attraction of new customers and therefore reduce the costs for acquiring new customers, while the last two result in a cost decrease and even a revenue increase. This explains why customers with negative CLV can be retained, because of the relational value generated. Future research will show how to calculate the relational value of a customer and include it in the calculation of their lifetime value.