
Account portfolio management: optimizing the customer portfolio of the firm
Abstract
The account portfolio management (APM) process deals with grouping customers and developing meaningful strategies for each group incorporated into resource allocation decisions to meet marketing objectives. Portfolio techniques offer a convenient and comprehensible framework for strategic decision-making. This paper presents a comprehensive guide to developing customer portfolios using variables identified in previous studies. The paper also illustrates implications for marketing strategies and future resource allocation for the strategic account portfolio. A portfolio approach may reveal necessary actions for important relationships and may streamline the decision-making process for suppliers' account portfolios. Each customer relationship requires different types and degrees of investment and produces different outcomes (Cannon and Perreault 1999). Hence the paper emphasizes customer heterogeneity in the business-to-business (B2B) marketing context and arrives at sound evaluations of individual customers.
Introduction
The APM approach divides customers into subgroups, evaluates each group and suggests a strategic group of customers as a major output of its analysis. Such strategic groups have been variously termed ‘major accounts’, ‘national accounts’, ‘key accounts’, ‘strategic accounts’ and ‘global accounts’. Pardo et al. (2006) argue that key account management originates in suppliers' recognition of the fact that not all customers are equal, as some typically represent an extremely high percentage of sales or profits (Håkansson and Snehota 1995).
Issues of strategic accounts in industrial markets have been studied for a number of years, originally in the sales management context (e.g. Churchill et al. 1993; Comer 1991; Dalrymple and Cron 1992; Kirkby 1988; Rackham 1988; Shapiro and Moriarty 1982). Both in the literature and in practice, the terms ‘national accounts’, ‘major accounts’ and ‘major sales’ have been used interchangeably to refer to the special clients of B2B suppliers. Early studies on the topic emphasized geographical spread and size of customers. Millman (1996) defined key accounts as those customers in industrial and B2B markets that selling companies identify as of strategic importance. This strategic importance is generally determined by volume-related considerations (Millman and Wilson 1996) and profit (McDonald et al. 1997). However, other customer characteristics can also identify an account as ‘strategic’. These include accounts that provide access to new markets, technologies and/or quality systems and can give their suppliers the competitive advantage of being the first in their market, with a specific new know-how or application (Pels 1992). In some cases, a customer's referral value can be critical to the selling company's motivation to win their business, because, as a reference account, the customer can deliver a great deal more business to the company indirectly.
Account portfolio management
Increasing competition, technological change and many well-known environmental factors have encouraged companies to move away from fragile relationships between salespeople and buyers and to pursue customer retention and long-term customer relations. For the last three decades, customer relationships have been evaluated as a strategic asset for companies, particularly those competing in the B2B context, and many companies hope to gain a competitive advantage by forming stronger relationships with fewer customers and suppliers.
In recent years, the nature of buyer–seller relationships has become one of the most discussed topics in the marketing literature (e.g. Campbell 1997; Dwyer et al. 1987; Ganesan 1994; Holmlund 2004; Meehan and Wright 2012; Palmer and Bejou 1994). Unlike producers of consumer goods and services, most industrial sellers rely on a small number of key customers, and losing one may radically affect the survival of the company. Hence there is a strong link between customer portfolio management strategies and overall business strategies of B2B suppliers. Account portfolio analysis (APA) is a concept of B2B marketing used for analysing supplier–customer relationships, in order to help managers allocate scarce organizational resources (Ford 1997). Account portfolio approaches assess customer composition and develop relevant strategies for different groups of accounts. Hence, portfolio techniques offer a convenient and comprehensible framework for strategic decision-making. Johnson and Selnes (2004) argue that the relationship marketing literature recognizes the need to build portfolios of relationships or relational resources to increase a firm's return on relationships.
The portfolio approach was first studied by Markowitz (1952) to evaluate the risks of investment decisions. Following Markowitz's portfolio theory, portfolio models have been applied to strategic planning for decades (Ansoff and Leontiades 1976; Wind and Douglas 1981). Other portfolio models have been studied in business domains related to customer relationships (Campbell and Cunningham 1983; Fiocca 1982; Johnson and Selnes 2004; Krapfel et al. 1991; Yorke 1984), supplier relations (Cunningham and Homse 1982; Kraljic 1983; Wagner and Johnson 2004), technology (Capon and Glazer 1987) and new product development (Cooper et al. 1999).
Broadly defined, customer portfolio analysis refers to a company's analysis of the current and future value of its customers in order to develop a balanced customer structure through effective resource allocation to different customers or customer groups. Balancing a customer portfolio can be regarded as the central goal of customer portfolio analysis (Terho and Halinen 2007). Customer portfolio analysis has the potential to provide valuable insights for evaluating account relationships and making more efficient resource allocation decisions.
The use of a portfolio model often suggests several possible action plans from which the company must choose due to limited resources (Olsen and Ellram 1997). Hence, the value of portfolio approaches to customer relationships is strongly linked to the company's business strategies and resource allocation decisions. Portfolio analysis can therefore enhance and promote marketing planning and communication (Dubinsky and Ingram 1984). Kotler et al. (1996) point out that portfolio analysis is useful in evaluating customer relations for development and control purposes, and also in ensuring the long-term profitability of customer relationships. The portfolio concept encourages the analysis of a supplier's needs and requirements from the proposed relationship before committing resources towards these objectives (Eng 2004).
Prior portfolio studies have addressed companies' account portfolios and grouped their customers to make the relationship portfolio efficient and balanced. Fiocca (1982) suggested a two-step customer portfolio analysis: first, all customers were classified according to their strategic importance and the difficulty of managing the account; second, strategic accounts were analysed using a second portfolio, including the dimensions of customer attractiveness and strength of the buyer–supplier relationship. Fiocca (1982) then suggested marketing strategies according to the positions of customers in the two matrices. Campbell and Cunningham (1983) classified customer relations into four life cycle segments: ‘yesterday's customers’, ‘today's regular customers’, ‘today's special customers’ and ‘tomorrow's customers’. Dubinsky and Ingram (1984) offered a profitability perspective and developed a portfolio that considered the present and potential profit contribution of customers. In addition, Krapfel et al. (1991) suggested a path to operationalize the constructs of relationship value and interest commonality, and then offer classifications for relationship types and management modes in a theoretically grounded structure.
In their case study, Yorke and Droussiotis (1994) based their portfolio dimensions on Fiocca's analysis but also included the factor of customer profitability, and offered a convenient portfolio approach. Zolkiewski and Turnbull (2002) evaluated relationship portfolios in the context of network theory and proposed that such portfolios might be a key factor in successful relationship management. Eng (2008) also presented a network approach to APA, suggesting that a firm can better enhance its competitive position with the knowledge of network effects and the interdependence of strategic actions in a business network context. Johnson and Selnes (2004) introduced a value-based approach to APA and proposed a model that links individual customer value with a firm's overall value creation and classified customers as acquaintances, friends or partners.
Some authors (Dhar and Glazer 2003; Ryals 2002, 2003; Tarasi et al. 2011) have attempted to apply financial portfolio theory to customer portfolio analysis and to formulate the risk and return characteristics of customer relationships. It is possible to conceptualize customers as financial assets, which assumes the option of applying the value concept in financial theory to marketing and customer portfolio value. Although this is a legitimate argument, marketing managers tend to take a broader view of customer portfolio value than just financial assets (Selnes 2011). Hence, identifying customer relationships as financial assets can be problematic in some ways. Marketing functions and managers have multi-faceted objectives and priorities when evaluating their customer relationships, rather than the mechanistic outcomes of financial portfolio techniques. A fruitful debate on the applicability of the financial portfolio approach to customer portfolio analysis seems likely to continue in further research in the near future (see Selnes et al. (2011) for further discussion).
Another recent stream of research in account portfolio analysis deals with software-induced analytic approaches (Ang and Taylor 2005; Gopalan 2007; Homburg et al. 2009; Jouini et al. 2004; Zhiyuan et al. 2010). This research stream, which combines mathematical modelling, data-mining techniques and customer data generated by customer relationship management (CRM) software, suggests a dynamic portfolio analysis approach. Indeed, increasing the use of software technologies allows companies to store extensive customer data, and this trend is setting the stage for the implementation of analytic approaches and modelling techniques for account portfolio analysis.
Account portfolio analysis and development of customer strategies
Ford et al. (1998) suggested that relationship management is the most critical marketing challenge, particularly in a B2B situation, where firms often rely on a small number of customers and suppliers; where markets are relatively static; and where maintaining relationships is often essential to ongoing business success. In such situations, where the addition or loss of a key customer can have dramatic effects on the company's turnover, profitability and viability, portfolio analysis can act as a very useful tool by identifying key strategic relationships (Zolkiewski and Turnbull 2002). Portfolio management tools, in addition to aiding strategic planning, can potentially help businesses fine-tune their customer offerings and develop competitive advantages (Dibb and Wensley 2002).
APA involves grouping customers on a portfolio grid and developing meaningful strategies for each group incorporated into resource allocation decisions. The concept of customer portfolio analysis is similar to the concept of segmentation, but there are significant differences between the two. Portfolio analysis focuses on the value of existing customers from the focal company's point of view, whereas segmentation generally focuses on dividing the market into distinct subsets of homogeneous customers, either on the basis of specific customer needs or buying behaviours, or more generally on customers' expected response to marketing mix stimuli (Terho and Halinen 2007).
Portfolio analysis and management can be applied from multiple perspectives, at various levels of aggregation, and with different strategic variables or portfolio components, depending upon the company's objectives and specific situations (Turnbull 1990). The portfolio concept's flexibility for use at different levels of management and with different levels of sophistication makes it a powerful management tool (Turnbull 1990). Account portfolio analyses apply sound portfolio dimensions and significant indicators in order to provide a convenient and strategic framework for a company's customer relationships. The strategic variable or customer portfolio dimension may correspond to an independent variable or form part of a composite dimension (Pardo and Salle 1995). Olsen and Ellram (1997) point out the importance of complexity in the dimensions used to categorize the elements in the portfolio. On one hand, if the dimensions are overly complex, a company may focus on developing measures that do not utilize the full potential of the portfolio approach in terms of improved resource allocation and communication; on the other hand, if the dimensions are too simple, important variables may be overlooked.
Two company cases presented here demonstrate a framework for customer portfolio analysis and propose tailored relationship strategies through a convenient managerial approach. Company case studies on portfolio analysis, which have been conducted in prior research (Campbell and Cunningham 1983; Wagner and Johnson 2004; Yorke and Droussiotis 1994), have the potential to produce valuable outcomes.
Company case I: Logistics services1
The company used in this case study is a medium-sized logistics services provider serving 62 customers from various industries. In order to avoid disclosing customers' names, they were randomly labelled with numbers from 1 to 62 at the beginning of the portfolio analysis. The models developed by Campbell and Cunningham (1983), Fiocca (1982) and Yorke and Droussiotis (1994) are used here as a point of departure in the development of portfolio models.
Our approach employs a two-step APA. First, 62 customers of the logistics company were rated according to their strategic importance and the difficulty of managing the relationship. The resulting matrix reveals the company's strategic account portfolio and also the least strategic ones. Next, the company's strategic accounts were analysed using a second matrix, including the dimensions of customer attractiveness and strength of the buyer–supplier relationship. Simultaneous consideration of both dimensions may reveal the current situation of relationships, suggest directions for allocating resources, and generate sound strategies for strategic account relationships. Such a concurrent evaluation exposes not only the strengths and weaknesses of the company's customer relationships, but also guides accurate directions for and investments in relationships.
Variables used for portfolio analysis
Generally, industrial suppliers have a group of customers that convey much more strategic importance than others. These customers require individual attention and customized solutions throughout business relations. A customer's strategic importance might result from the dollar value of that customer's purchases, the potential of business with that customer, new market opportunities that are or may be gained by serving that customer or the prestige of the account. In addition to the account's strategic importance, the selling company should consider the difficulty of managing each customer relationship. This dimension reveals relative levels of effort and resources required for each customer relationship. Such levels of difficulty may be indicated by the complexity of a customer's product/service requirements, the intensity of competition in the account, payment problems, the customer's claiming attitudes and complaint severity/frequency, or frequent order cancellations or modifications. These variables have been used in earlier portfolio studies (Campbell and Cunningham 1983; Fiocca 1982; Yorke and Droussiotis 1994).
The account portfolio studies considered used the strength of the relationship as another portfolio dimension and proposed several indicators for measuring this dimension, such as customer share, length of the relationship, power, geographic distance, magnitude of purchases, frequency of contact, trust and cooperation. Additionally, in the light of future-related strategic considerations, companies should consider customers' business attractiveness for effective resource allocation decisions. Business attractiveness is indicative of the status/position of the customer's business in the light of future orientations. Variables used to measure a customer's business attractiveness are the dollar value of the customer's purchases, competitors' share of the customer's purchases, the growth rate of the customer's purchases, future capacity expansions, contribution margins, account prestige and the customer's sensitivity to price.
Some of the data related to the variables of the dimensions were collected from the logistics company's marketing department's reports (i.e. dollar value of purchases, age of relationships and growth rate of purchases), and the customers were categorized along a five-point scale. The remaining variables were independently rated on a five-point scale by two top managers in the company, i.e. the general manager and assistant general manager, who are the key decision-makers for managing customer relationships and who also define weighting scores for each portfolio variable. The averages of these two managers' ratings were used for analysis. All variables in the analysis were rated using a five-point scale. At the first stage of the analysis, strategic importance and the difficulty of managing each customer relationship were examined on a grid. At the second stage, only strategic accounts were positioned on another portfolio matrix with respect to the strength of the relationship and their business attractiveness. A summary of the variables used for the measurement of all four portfolio dimensions is shown in Table 1.
Table 1: Summary of the variables used for measurement
| Variables | Weighting | Summary of the variable |
|---|---|---|
| Strategic importance of the account | ||
| Dollar value of purchases | 0.40 | Average of monthly sales turnovers in the previous year. |
| Potential of the account | 0.25 | Future potential of the customer's purchases. |
| Open new markets | 0.25 | New market opportunities that are or will be gained by serving the customer. |
| Prestige of the account | 0.10 | Reputation of the customer. |
| Difficulty in managing the account | ||
| Complexity of customer's service requirements | 0.40 | Complication of the customer's logistics services requirements. |
| Customer's tendency to create competition | 0.30 | Customer's attitude towards competition and tendency to create competition between logistics suppliers. |
| Payment problems | 0.10 | Customer's bad debts and delayed payment attitudes. |
| Claims put forward | 0.10 | Customer's claiming attitudes and complaint severity and frequency. |
| Frequent order cancellations or modifications | 0.10 | Frequency of order cancellations and modifications. |
| Relationship strength | ||
| Dollar value of purchases | 0.30 | Average of monthly sales turnovers in the previous year. |
| Length of relationship | 0.20 | Age of the customer relationship. |
| Customer share | 0.20 | Company's share of the customer's total logistics services purchases. |
| Frequency of contact | 0.10 | Communication and contact frequency with the customer. |
| Degree of cooperation | 0.10 | Frequency and depth of cooperational business practices between parties. |
| Trust | 0.10 | Mutual trust between parties. |
| Customer's business attractiveness | ||
| Competitors' share of customer's purchases | 0.20 | Competitors' share of the customer's total logistics services purchases. |
| Dollar value of purchases | 0.20 | Average of monthly sales turnovers in the previous year. |
| Growth rate of purchases | 0.15 | Average of percentages of increases/decreases in sales turnovers for the previous year's monthly figures. |
| Future capacity expansions | 0.15 | Capacity expansion plans of the customer and planned investments for expansion in buildings and machinery. |
| Contribution margins | 0.15 | Contribution margins of services sold to customer. |
| Prestige of the account | 0.10 | The reputation of the customer. |
| Sensitivity to price | 0.05 | Hard-bargaining attitudes of the customer and price-related tensions in the relationship. |
Analysing the general account portfolio of the firm
At this first stage, the supplier company rates the strategic importance and the difficulty of managing each customer relationship. This analysis provides a meaningful framework for the supplier in which customer relationships require individual concentration and in-depth analysis, which will result in revealing the company's strategic account portfolio. In addition to sales and volume considerations regarding the customers, the customer's business potential, prestige value and access to new markets and technologies are also substantial variables in identifying an account as ‘strategic’.
Following calculations, each customer was positioned in one of Fiocca's (1982) four quadrants as shown in the difficulty–importance grid in Figure 1. The lines dividing the quadrants represent the mean scores of all customers for each dimension. After examining the position of the customers on the matrix, the supplier can decide which accounts deserve a more in-depth analysis. Normally, the customers in Cells 2 and 4 are considered ‘strategic accounts’ worthy of further analysis.
Figure 1 Difficulty–importance grid
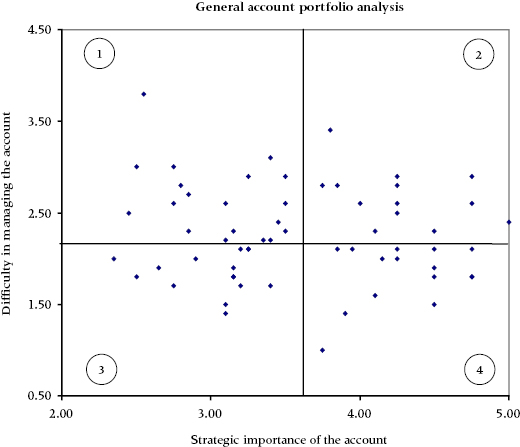
Cell 4 of the matrix in Figure 1 shows 14 strategic and easily managed customers who can be considered major contributors to the company's profits. The company gains larger revenues from these customers with relatively lower administration costs. Cell 2 includes 13 key customers that are relatively difficult to manage, sometimes problematic and complicated. Like those in Cell 4, these customers can have significant strategic importance for the company, but the company expends more effort to gain and retain these customers' orders. Such customers may be open to competitors' offerings, though they may not be involved in a persistent search for alternative suppliers for each logistics service requirement.
Cell 1 includes difficult/non-key customers of the company. Although some of them are profitable to some extent, company managers might conduct in-depth analyses on the contribution margins of Cell 1 customers and consider terminating some of the relationships with these customers in order to allocate scarce resources more effectively. Customers in Cell 3 are easy/non-key accounts, whose business the company may prefer to continue to enjoy without any additional marketing or managerial expenses.
Analysing the key account portfolio
The second part of the analysis focuses on evaluating strategically important account relationships with customers from Cells 2 and 4 of the first matrix. For this purpose, the strength of the supplier–customer relationship and the customer's business attractiveness are plotted for each strategic account, which appears with its code number in the second matrix (Figure 2).
Figure 2 Relationship strength–business attractiveness grid
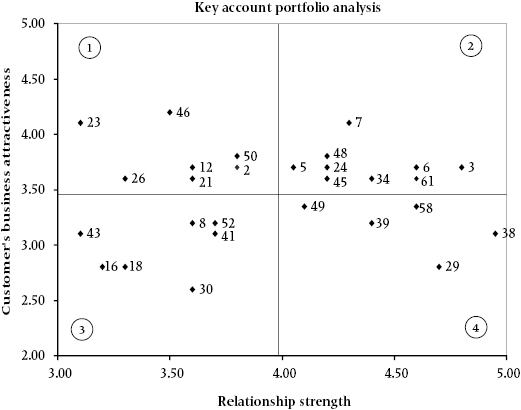
In Cell 1, there are seven key customers of the company with relatively high attractiveness and low relationship strength. Since the relationships are weak, customers in Cell 1 lack information about the selling company and perceive a high risk for the relationship. These fairly immature but promising relationships require more attention and tailor-made solutions for their logistics service requirements. Considering the future business potential of such key accounts, the logistics company should focus on the specific needs of these customers in order to advance the relationship regarding the social variables. Hence, the company's strategy for these accounts could be to allocate resources to relational dimensions and trust-creating activities, such as information sharing, timely feedback, frequency of contact, fast response to complaints and friendship.
In Cell 2, the supplier company has nine strategic accounts with relatively high business attractiveness and relationship strength. These customer relationships can be considered reasonably mature and stable in addition to their attractiveness. The easily managed accounts of this quadrant are the company's most valuable customers. The relevant strategy for this group of customers could be to defend and monitor current levels of relationship strength. The company is already strong relative to the competition for this group of customers, and the managers should focus on protecting the relationships without additional resource allocations. Maintaining strong personal relationships and levels of trust is a central course of action for the supplier. The company should pay attention to external developments related to these customers, such as competitors' actions and insistent proposals, new services and the customer's new logistics requirements.
In Cell 3, the company has seven customer relationships with low attractiveness and low strength. The recommended strategy here is to avoid allocating additional resources for these relationships. If some of them have the difficult-to-manage characteristics identified in the first analysis, resource allocation for these customers could safely be reduced, and the accounts even might be changed from strategic account status to a regular customer.
In Cell 4, the company has five customer relationships that are well established but have low attractiveness. The logistics company would be well advised to maintain the current levels of resource allocation for these accounts and refrain from marketing expenses or other additional investment in these relationships. The easily managed customers of this quadrant are cash generators for the company.
If company managers integrate the difficulty dimension into strategic account portfolio analysis on an individual customer basis, they can reach more comprehensive evaluations for strategic accounts. For instance, Customer 46, which shows low strength, high attractiveness and difficult-to-manage characteristics, requires more time, effort and resource investment to strengthen the relationship than does Customer 23, an easily managed, low-strength, high-attractiveness customer. Additionally, Customer 30, which shows low strength, low potential and highly difficult characteristics, could be another noteworthy example for further evaluations. Closer examination of this account's scores reveals that the customer has relatively low growth potential, prestige and profitability scores as well as high price sensitivity. Hence, the most suitable strategy for this customer should be withdrawal of its key account status and retreat on the resource allocation. Customers 6, 7, 24, 34 and 45, meanwhile, represent high strength, high attractiveness and easily managed characteristics, indicating robust, promising and profitable strategic account relationships for the company.
The analysis approach employed here suggests the use of portfolio analysis as a strategic management tool for decision-making, and illustrates how the customer portfolio technique can be developed by a B2B service supplier. The approach attempts to reach valuable insights for the overall customer portfolio of the logistics company and facilitates evaluation of strategic account relationships. Considering the vital importance of customer relationships for B2B suppliers, account portfolio analysis can create significant guiding principles for supplier companies' strategic business decisions. Simultaneous evaluation of the four dimensions for each customer will provide plenty of information about the customer's status, but it is important to remember that such an effort requires analysing a large amount of data. The company managers should combine their knowledge of their customers with extensive portfolio data in order to arrive at an advanced level of benefit from a portfolio approach.
The method presented here provides insights into the general framework of account relationships and forces managers to adopt a future-oriented perspective on customer relations, by evaluating customers' business attractiveness as well as the strength of the relationship, leading them to prioritize resource allocation. While the first grid shown above provides information regarding strategic and non-strategic considerations for the overall customer portfolio, the second grid points out the appropriate actions for potentially promising customer relations. Simultaneous consideration of both matrices has the potential to reveal valuable strategic insights for the company's customer portfolio. Outcomes of the method may reveal necessary actions for specific relationships and may streamline the decision-making process for suppliers' account portfolio management.
If the selling company does not have a great number of key accounts, managers ideally should evaluate their strategic customers on an individual basis in order to reach significant outcomes of portfolio analysis. If the selling company has many customers in the portfolio, the company can limit the number of accounts for the first level of analysis. It is important to note that the second step of account portfolio analysis, which involves analysing strategic accounts on an individual basis, can be costly and time consuming, particularly for big industrial sellers.
Company case II: automotive industry
Using an automotive-industry battery supplier's original equipment manufacturers (OEM) customer portfolio, this case study2 focuses on the company's strategic accounts and explores the use of customer satisfaction (CS) metrics for managing customer relationships in the context of the portfolio approach. The case company has 12 OEM customers, who typically have a great amount of purchase volume and significant referral value for an automotive supplier.
The models developed by Fiocca (1982) and Yorke and Droussiotis (1994) were used in this case as a point of departure in the development of portfolio models. Fiocca employs the dimension of ‘customer's business attractiveness’ in analysing a company's key account portfolio. Since this dimension is heavily associated with the supplier's future business expectations from a customer, we have termed it ‘business potential’.
Many companies today periodically measure the CS levels of their customer base. The CS score is a composite variable involving key aspects of the relationship and is a relevant dimension for portfolio analysis. The overall CS score calculated for each customer is a fundamental indicator of the firm's performance, owing to its links to behavioural and economic consequences for the firm (Anderson et al. 1994). The CS questionnaire used by the case company consists of 35 items and five dimensions: products and prices, quality and technical processes, sales personnel, order handling and services, and customer relationships. The satisfaction scores of the key accounts are based on weighted averages calculated from importance versus performance ratings measured on a seven-point Likert scale.
Because CS metrics convey cumulative evaluations of customers up to the time of the survey and also involve future oriented clues of customers' relationships with the supplier, it could be more significant to combine the metrics with the two relevant dimensions of the previous portfolio study. Hence, customers are positioned on grids with respect to their business potential and the strength of their relationships with the supplier along with the CS scores. These two matrices may uncover the current stability of the relationships and also provide meaningful signals in terms of strategic reallocation of resources to enhance specific relationships in order to achieve future growth.
Relationship strength–CS matrix
Prior account portfolio studies have proposed several indicators for measuring the relationship strength dimension, including customer share, magnitude of purchases, length of the relationship, frequency of contact, trust, cooperation and friendship (Campbell and Cunningham 1983; Fiocca 1982; Yorke and Droussiotis 1994). Information sharing has been cited as an indicator of relationship strength and quality in industrial supply relationships (Brennan 1997; Eckerd and Hill 2012; O'Toole and Donaldson 2002; Purdy and Safayeni 2000) and is used as a measure of strength in this study. Hence, the variables used to measure relationship strength in the present study (see Table 2) are consistent and in balance with the variables proposed by previous portfolio studies.
Table 2: Variables used to measure relationship strength
| Variable | Weighting |
|---|---|
| Customer share | 0.20 |
| Length of the relationship | 0.15 |
| Dollar value of purchases (sales volume of previous year) | 0.15 |
| Management distance (frequency of contact) | 0.10 |
| Degree of cooperation | 0.10 |
| Friendship | 0.10 |
| Trust | 0.10 |
| Information sharing | 0.10 |
The data related to the first three variables of relationship strength were collected from the company's internal reports, and the customers were categorized along a five-point scale. The remaining five variables were independently rated on a scale from one to five by four managers who are key decision-makers for managing customer relationships in the company: i.e. the general manager, assistant general manager, sales manager, and key account manager. The averages of these managers' ratings were used for the analysis. The variables listed in Table 2 were weighted collectively by the four managers. It should be emphasized that this part of the implementation process, which has also been used by previous portfolio researchers (e.g. Olsen and Ellram 1997; Yorke and Droussiotis 1994), is very subjective. Although weighting the scores of indicators is also subjective and context-dependent, it is a plausible method of determining the constructs and it provides realistic evaluations.
In Figure 3, Cell 1 includes Customers B, C and F, who all have high relationship strength and low satisfaction levels. Although these customers have established relationships with the supplier, they are relatively dissatisfied with the relationship and thus might well be open to competitors' offerings. The selling company is a preferred supplier for these customers, but they still feel the need for alternative suppliers. While they might not be actively in search of such alternatives, it would still be overly optimistic to expect a significant increase in customer share for these customers in the near future.
Figure 3 Relationship strength–customer satisfaction grid
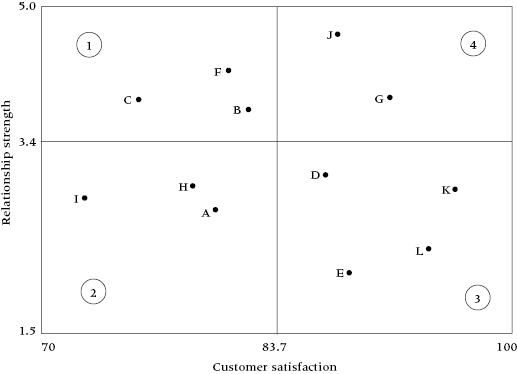
Customers A, H and I, located in Cell 2 of the grid, have low relationship strength and low CS. Hence, these customers might be seen as less committed to the relationship and therefore as ‘competitors’ customers'. The supplier has gained some of these customers' business, although it is not the major supplier and relationships are fragile. It could be posited that their positions in the grid reflect an arm's-length relationship between parties and signify possible disloyalty in forthcoming years.
Cell 3 of the grid includes Customers D, E, L and K, all of whom have high CS levels but low relationship strength. Hence, these relatively new relationships of the company can be expected to become loyal customers in the near future as a result of their high satisfaction levels. In such relationships, volume has begun to increase and the buyer has been evaluating the supplier's performance, so the selling company needs to avoid problems and conflicts and solve them rapidly. A deeper knowledge of the customer's buying centre and an understanding of the problems that relate to the value-adding process are vital in these relationships. The supplier should offer customized solutions to the buyer's problems by concentrating on product, service and intangibles.
Since Customers G and J in the fourth quadrant of the grid have both high CS and high strength scores, they can be considered loyal customers, representing established and evolved relationships. These relationships are relatively mature, and the supplier is seen by the customer as a preferred supplier. Almost all of these customers' supply requirements are fulfilled by the selling company, and both the supplier and the customers have achieved a level of satisfaction from the relationship.
Customer's business potential–customer satisfaction matrix
Understanding both the short-term industry factors and the long-term positioning value of the customer mix is important for the management of customer portfolios (Eng 2004). As Campbell and Cunningham (1985) state, such an analysis is designed to give prominence to customers to whom the company allocates strategic funds in the hope of developing future business, as well as to emphasize those customers on which the company is dependent. Business potential refers to the status/position of the customer's business in the light of future orientations. The competitors' share of the customer's purchases represents a portion of the available business for the supplier that could be captured in the future. Obviously, if a customer has high capacity utilization, weak export links, no expansion plans, and/or low growth rate, the business potential of the customer is likely to be relatively low. If a low-potential customer has a high CS score, the selling company may decide not to spend additional resources on the customer. However, if a high-potential customer has a low satisfaction score, the selling company should pay immediate attention to the reasons for the customer's dissatisfaction and take action to correct the problem. Hence, the business potential–CS matrix might help companies to prioritize investment and resource allocation decisions in order to improve CS elements of account relationships.
Variables used to measure customers' business potential are listed in Table 3. The figures related to competitors' customer share and customer purchase amounts were obtained using the previous year's sales data and industry statistics. The growth rate of customers' purchases was calculated as an average of the figures of the most recent three years. Information on capacity utilization, export sales, and investment and expansion plans of customers were externally gathered from the statistics issued by authoritative sectoral bodies, governmental institutions and customers' annual reports for the previous year. Using these numerical inputs, customers were grouped into intervals representing a five-point scale for each variable. Account prestige and price sensitivity were used as subjective measures, and the customers were independently rated on a scale from one to five by the four company managers.
Table 3: Variables used to measure customers' business potential
| Variable | Weighting |
|---|---|
| Competitors' share of customer's purchases | 0.15 |
| Dollar value of customer's purchases | 0.15 |
| Growth rate of customer's purchases (per year using dollars) | 0.15 |
| Customer's capacity utilization (i.e. unemployed capacity) | 0.10 |
| Future capacity expansions (in volume terms) | 0.10 |
| Links with export markets (% exports of total turnover) | 0.10 |
| Contribution margins (of products sold to customer) | 0.10 |
| Account prestige (reputation) | 0.10 |
| Sensitivity to price | 0.05 |
Figure 4 shows the dispersion of the customers according to their business potential and CS scores. Customers B, C and I, located in Cell 1 of the business potential–CS grid, have relatively high levels of business potential and low levels of CS. All details regarding their satisfaction need to be examined, and corrective actions (i.e. resource allocations) should be taken for key problematic areas of the relationship. In Cell 2, Customers A, F and H have relatively low potential; thus management should not allocate additional resources for CS aspects of these accounts.
Figure 4 Account's business potential–customer satisfaction matrix
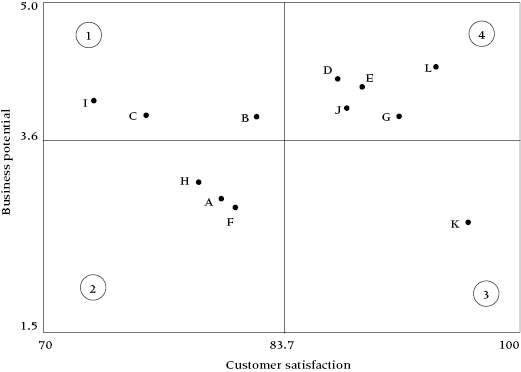
Cell 3 of the grid includes only Customer K, which has the highest CS score and the lowest potential in the account portfolio. Management should not invest extra resources in this relationship and might even consider withdrawing some resources from this account. Finally, customers D, E, G, J and L, located in Cell 4 of the grid, have both high potential and high CS scores. The relevant strategy for this group of customers could be to defend and monitor current levels of satisfaction and take moderate corrective actions if necessary to deal with significant gaps in key aspects of CS.
Analysis of portfolio matrices and development of marketing strategies
The two matrices proposed above offer significant insights into the customer relationships of the selling company and provide a basis for more customer-centric key account analysis. The first grid provides noteworthy indications regarding the current composition of customer relations, while the second grid forces managers to adopt a future-oriented perspective on relationships by evaluating the business potential of customers as well as their CS information, leading to prioritization with respect to resource allocation. Simultaneous consideration of both matrices has the potential to reveal valuable strategic insights for individual customer relationships and to provide pertinent managerial applications. This approach also guides accurate directions to, and investments in, relationships while improving the effectiveness of marketing decisions. It is important to note that, as pointed out by Spencer (1999), strategic account management (SAM) does not translate to ‘building good, strong relationships at all costs’. Rather, it encourages companies to give each relationship the attention it merits, which might well mean reducing investment in some cases.
As shown in the results above, customers B and C are positioned in Cell 1 of both matrices, where the customer has high relative business potential and relationship strength but a low CS score. Since these customers may be open to competitors' offerings and have higher business potential, the relevant strategy for these relationships could be to allocate resources among the most unsatisfactory aspects of CS dimensions in order to increase satisfaction. A detailed examination of these customers' CS information indicates that Customer B is dissatisfied primarily with product-related technical issues, whereas Customer C is dissatisfied with complaint handling, return policies, processing of urgent orders and information sharing. Since the efforts intended to enhance the CS of these customers are likely to pay off, company managers should take corrective actions and monitor the results, especially on the dimensions of CS that are most unsatisfactory to each specific customer. For instance, the selling company's managers should enlarge the product-related interaction with Customer B, perhaps in the form of increasing technical personnel visits to the customer, providing more comprehensive product information and/or extending technical services. The relevant strategy for Customer C could be to enhance the scope of some customer service elements specific to this customer, such as expanding product return conditions, fast response, timely feedback to its complaints, and/or keeping some extra inventory for the customer.
Customers A and H are positioned in Cell 2 of both matrices. These customers are low-commitment accounts that have stronger relationships with the major competitor of the company. Since these customers also have relatively low business potential, the company should maintain their current levels of satisfaction and refrain from corrective actions or additional investment in trying to satisfy these customers. Although closer examination of these accounts' CS scores reveals that the customers are particularly dissatisfied with price levels, frequency of customer visits and sharing sensitive information, under the current circumstances the company may maintain current price ranges, communication and visit frequency with these customers.
Customer F has a longstanding relationship with the supplier but a relatively low business potential and CS score. However, examination reveals that the dissatisfaction is primarily with commercial issues and prices, so the payoff from this relationship will likely remain constant. Considering the low business potential of this price-sensitive account, the managers may decide not to take any corrective actions for CS dimensions of this relationship.
On the other hand, in the case of Customer I, relationship strength is low, CS score is low, but business potential is relatively high. The situation of Customer I should be considered exclusively in terms of key satisfaction issues, and resources should be allocated for corrective actions in order to gain future business from this potentially lucrative customer. The CS measures for this customer show greater gaps in the issues of products, quality, sales personnel and complaint handling. Managers' comments verify that in recent years there have been several conflicts on these issues between the two parties, as reflected by the satisfaction score. An advisable course for the selling company is to increase technical interaction with the customer and apply some exclusive procedures for the relationship (e.g. handling the complaints and orders at top-management levels for a reasonable period).
Customers D, E and L have relatively low relationship strength scores but high business potential and CS levels. They have no major complaints about the technical or commercial aspects of the relationships. Since these relationships are not established, the customers lack information about the selling company and perceive a high risk for the relationship. These fairly immature but promising relationships require more attention and tailor-made solutions for their product and service requirements. The strategy for these accounts could be to allocate resources to relational dimensions and trust-creating activities, such as information sharing, timely feedback, frequency of contact and friendship. The company should pursue all means of communication with these customers through regular reports, customer visits, exclusive sales promotions and meetings involving top management.
In contrast, Customer K is located in Cell 3 of both matrices. This customer has the highest CS level, but both business potential and relationship strength are low. The recommended strategy for this customer is to avoid allocating additional resources for this relationship and divest the customer's key account status. Having the highest CS level may indicate an over-allocation of resources to this relationship. Thus this allocation can safely be reduced, and the account can be removed from the key account manager's responsibility as a regular customer.
Today's loyal customers, G and J, are located in Cell 4 of both grids. Relationship strength and CS scores suggest that these relationships are mutually perceived as strong and established, making it easy for the supplier to maintain these customers' current levels of satisfaction. Because these customers already prefer the company over the competition, managers should focus on protecting these relationships without considerable resource allocations. If there are noticeable gaps in some satisfaction dimensions, the company should rectify only those issues. For example, since Customer J has somewhat lower scores in frequency of customer visits and ease of doing business, the managers could rearrange the customer visit schedule to allow for more frequent communication. Similarly, although Customer G is satisfied with almost all factors in the relationship, there is moderate dissatisfaction about delivery lead times. To rectify this, the selling company could organize new delivery schedules or retain some extra stock for the customer. In addition, the company should be mindful of external developments related to current loyal customers, such as competitors' actions and proposals and new products and service requirements.
Conclusions
This paper has attempted to present the APM approach through a comprehensive analysis of the account portfolios of two case companies, and it has also suggested strategic inferences for better CRM. The portfolio approach to account management, which emphasizes similarities and interdependencies among different customer relationships, serves as a guide for resource allocation problems pertaining to these relationships. When appropriate variables are used, portfolio analysis can reveal a company's competitive position and allow management to reconsider which customers and relationship dimensions require the most attention. The outcomes of the analysis can be used as one of the marketing metrics to support customer analysis in the strategic account management process and to design customized relationship strategies. Depending upon the company's objectives and specific situation, portfolio analysis and management strategies can be applied from multiple perspectives, at various levels of aggregation and with different strategic variables or portfolio components (Turnbull 1990). Previous portfolio models reveal that investments in a customer portfolio should be a function of underlying firm, customer and industry characteristics (Johnson and Selnes 2004), and it is likely that any specific evaluation will be context dependent.
The APM approach presented here tries to emphasize customer heterogeneity in business markets and offers managerial guidelines embracing customer-specific marketing actions instead of a one-size-fits-all approach. Since account analysis and development of customized relationship strategies are the intrinsic elements of SAM, the proposed approach can be used in SAM applications as a decision support tool. In this sense, a summarized set of the analysis outputs can be combined with marketing dashboards which present a synopsis of key performance and operational metrics of the company. In order to facilitate the analysis and accelerate reporting, data and analytical tools might be integrated with CRM software.
The normative use of CS measurement methodologies advises corrective actions for all customers and for virtually every dissatisfaction aspect of the customer in light of control theory. Similarly, account portfolio studies propose resource allocation for high-potential and high-attractiveness customers; however, such suggestions are rather naive in terms of addressing the actual direction of allocation and investment decisions. Since CS information is indicative of the customer's perspective on problematic areas in the relationship, evaluating this information in the context of the portfolio approach can provide valuable strategic inferences regarding the action necessary in specific relationships. This may lead to more efficient resource allocation decisions for suppliers.
The method proposed here involves some of the same limitations that have been acknowledged in prior portfolio studies. Inevitably, managers' ratings on some variables are subjective; however, they are based on experienced evaluations. In addition, one can offer several other criteria for measuring strategic importance, relationship strength and other dimensions in the portfolio grids.
However, account portfolio analyses are context dependent, and the variables used may differ. As Olsen and Ellram (1997) point out, using more complex measurement approaches in portfolio studies shifts the focus from decision-making to mechanistic measurement. Account portfolio analysis can provide more objective and accurate results depending on the comprehensiveness of the company's marketing intelligence data and technologies.
Notes
1 This company case is partly a modified version of a proceedings paper: Gök, O. (2007) Using customer portfolio analysis for strategic business decisions: case study of a logistics company. 3rd International Strategic Management Conference, Antalya, Turkey, 757–765.
2 This company case is partly a modified version of a published journal article: Gök, O. (2009) Linking account portfolio management to customer information: using customer satisfaction metrics for portfolio analysis. Industrial Marketing Management, 38(4), 433–439.