
ORIGIN
THE GOAL OF OUR CRAFT
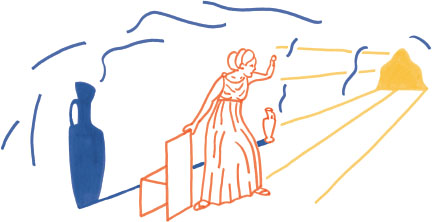
This art takes as given that sight is there, but not rightly turned nor looking at what it ought to look at…
THE ALLEGORY OF THE CAVE PLATO'S REPUBLIC, c. 380 BC
Once upon a time, the tree was our home. Snakes and big cats were our enemies. Detecting one would send us into high alert.
I once got to witness this kind of predator-induced chaos, standing on the muddy banks of the Mara River in Kenya. Across the water, a distant herd of wildebeests approached. Perhaps they will attempt a river crossing? Then, we spotted the back of a juvenile lion in the grass, halfway between us and the herd. The cat was on the hunt, moving toward the wildebeests. We could see the lion's trap, but we were not the only ones watching.
Suddenly, a shriek rang out across the savanna. Atreetop baboon had spotted the lion too. Baboons hate lions. They keep watch and alert their troop with a distinctive howl that warns: Beware! Lions! The wildebeests heard the baboon's message. They stopped, abandoned the crossing, and retreated back up the ridge.
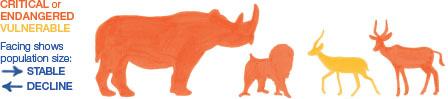
Safaris introduced me to a dizzying diversity of life. Some of the animal names—kudu, duiker, colobus—were as unfamiliar as the names of the national parks—Elgon, Nakuru, Baringo. How many species are there? Where did they live? Which ones are common? Which ones are endangered? How did they all relate? I was adrift. A question that launches a search reminds me of a scientist who wishes to test a hypothesis. Something fantastic might result from our hunch, if only we had the data that could help us see.
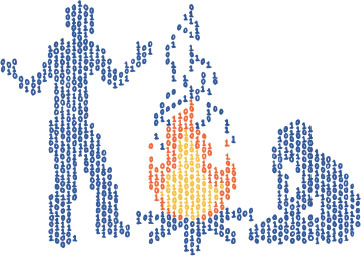
I dove into learning about African wildlife, beginning with a dusty field guide. It introduced me to the nuances of taxonomy and threatened species status. Then, I discovered an international organization that studies and works to conserve biodiversity. I paired its data on hundreds of large African mammals with maps and illustrations to show myself, and eventually the world, a new view. A portion of this interactive project, titled Endangered Safari, is drawn below. It helped orient me to the wildlife I encountered.
Other kinds of data adventures have more exploratory origins.
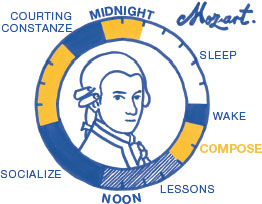
I first heard about author Mason Currey listening to the radio driving down a North Carolina highway. He was promoting his 2013 book, Daily Rituals. It chronicles how 161 painters, scientists, and other creative people spent their productive days. Before the radio segment was over, I already knew I wanted to map its contents. There was no motivating question or expectation. There was only eagerness to see what was going on inside the world that Currey had assembled. That was excitement enough.
It took only a few days to get Currey's book, catalog different types of activities, and arrange sixteen of its rituals into 24-hour cycles. A poster, called Creative Routines, soon materialized. Mozart's routine from 1781 is adapted above. Immersing yourself in a new world to get a sense of it all, reminds me of ethnography. Its fieldwork embeds ethnographers within a culture. There, they record observations for later synthesis and interpretation. You can see the originals of both projects, safari and routines, at InfoWeTrust.com. Sometimes a question leads us to data. Sometimes data makes us question. These are only two of the many ways ideas take shape.
We will soon submerge into the practical mechanics of how it all works. Writing this book gave me the opportunity to develop new data stories, which I am excited to share with you. But first, I want to equip you with a mythic perspective that empowers the creative. I will also attempt to answer some questions you might have. For example, what is “info we trust?”

Data Stories
Conveying information we trust is a dynamic activity that puts our world into forms that are strong and true. Absolute truth is a tricky thing. At our outset, we are most concerned with truth's pursuit, as an arrow shot straight toward its target is an arrow shot true. As a creator, I consider the making of information to be a craft. It is a rational and optimistic way to grow our knowledge and elevate our ability to take action.
Our craft is often referred to by its artifacts: charts, maps, diagrams, and so on. The lively exchanges these items produce is what makes them meaningful. We see the map, a noun, but the verb of seeing is what matters most. Meaning is attained while making and perceiving. Without our action, the map is stale. It has no life.
Meaningful information is often made with data. Data is like water. With effort, both data and water are captured from the environment, pooled in reservoirs, and delivered to where they are needed. The same water could irrigate a farm, spout from a palace fountain, or mix concrete for a new building. Likewise, we use data to revive, entertain, and build. Data may be a frozen snapshot, like an Antarctic ice core sample, but it may also be a dynamic stream, always rushing past.
Early peoples had a serious regard for large bodies of water, and for good reason. The sea's depths were impenetrable and storms arrive from the sea; to venture out to sea is daring. Many storied sea monsters turned out to be real. An entire class of ancient creation myths told that the universe emerged from a watery chaos that was dark, formless, and void-like.

Today, this watery vision reminds me of the cosmic soup that appeared immediately after our universe's Big Bang. Mysterious, and sometimes foreboding, water is also the symbol of hope and rebirth. From chaos springs creation and life. The chaos of the cosmos, water, and data are each formless and full of potential. The power of water anchors our conception of data as a wellspring of creation that deserves respect. We thirst for water, but too much drowns.
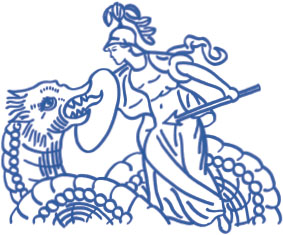
The world of myth is threatened from the deep. The epic poem of Beowulf faces the title hero with writhing sea-dragons, wolfish swimmers, and a bewildering horde of sea-beasts found at the heaving depths. Undeterred, Beowulf confronts the threat. Beowulf got ready, donned his war-gear, indifferent to death; his mighty, hand-forged, fine-webbed mail would soon meet with the menace underwater.
The watery dragons of chaos represent all that threatens to overwhelm us. We do not know the real world. How could we? Our capacity to understand is minuscule compared to the vast complexity of reality. Despite our limited capabilities, we do not drown. We have thrived. Our perceptions and explanations of what is going on carry us through the chaos that is really out there. Across our journey through reality, we must depend on one another. We cannot each grasp it all, so we trust in the knowledge of others. We sense that this knowledge, our ability to help one another navigate, can always be improved.
The hero is the one who confronts the unknown, learns how to better navigate the chaos of reality, and shares the lesson with all. Imagine a monster invades your community. If you are strong and clever, you confront the brute, win the encounter, and deliver everyone out of danger. If you are lucky, you learn how to navigate that kind of threat. By facing the unknown, you gain some knowledge that will be useful in future encounters, and share the lesson. Everyone learns and advances by virtue of your heroic action.
The heroes who dive into chaos to grapple with reality can gain great rewards. The mythical dragon is often portrayed as guarding gold or pearls. In mythology, the individual hero wins the treasure, is celebrated by the people, then parents future generations. Rescuing fair maidens is a dated trope, but we can still get the message: Across our evolution, those who figured out how to better manage reality are the ones who thrived. More importantly, the real treasure is not what is lavished upon the triumphant hero. The boon is the learning that the hero delivered to people. True heroes expand our collective body of knowledge.
Dark and mysterious, but full of potential, data is the primordial soup of our age. It is the pool we must dive into, just as Beowulf dove underwater. Ancient heroes benefited from having brute strength and clever wits. Today, we have even more abilities to encounter and wrangle new understanding from chaos. But, like old mythology, for our gains to have meaning, they must be shared.
There is a superficial contradiction between the archetypal images of data and story. Data evokes cinematic binary code falling down a computer screen. Story kindles memories of wisdom shared around the compfire. Story is easily understood as entertaining anecdotes. The word evokes predictable narrative arcs, the kind used in serial fiction to attract and hold attention. The same clichéd story is the sugar that makes lessons palatable. At its worst, the word puts objective rationalists on alert. We know story can be used to manipulate emotions and deceive. This conception of story is not incorrect, but it is incomplete. Story has a lot more to teach us about conveying information than mere conflict, climax, and resolution. We call narrative discourse “story,” but it is really only an input to the real story playing inside our heads. Our experience of time, and our ability to identify what matters, are two extraordinary aspects of our lived experience. On a timescale too short for us to discern, we perceive the world in sequence, and infuse it with significance. Story is how we make sense of these stimuli to our self: We perceive the world in the ordered moments that our senses detect and we assign meaning as we go. A coherent personal reality emerges and we act in relation to this inner monologue. Story is our believed truth. Without this reality-generating story, we would drown in the chaos of sensory overload.
On a timescale too large for us to survive, story is also how we transmit knowledge and know-how across generations. Before I am gone, here is what you need to know. We exist somewhere between these meaningful moments and long arcs across millennia.

The hero's journey, to adventure and back again, is one fitting metaphor for our encounters with data. Each time you wade into a dataset, make some sense of it, and relay that information to the world, it is like 2 a micro-dose of the hero's journey. You choose to confront the chaos of the unknown in hopes of delivering some order to society. The thrill of the adventure is always possible. Yet, the allure of the reward does not supersede the journey. We do not seek absolute order. The finitude of authoritarianism denies the richness of chance, diversity, and the ephemeral nature of being. Instead of arriving at some final order, we seek to straddle chaos and order to become conduits of meaning. In 1961's The Impact of Science on Myth, comparative mythologist Joseph Campbell described bringing scientific order to the world as a never-ending journey:
And is there no implied intention, then to rest satisfied with some final body or sufficient number of facts? No indeed! There is to be only a continuing search for more—as of a mind eager to grow. And that growth, as long as it lasts, will be the measure of the life of modern Western man, and of the world with all its promise that he has broughtand is still bringing into being: which is to say, a world of change, new thoughts, new things, new magnitudes, andcontinuing transformation, not of petrification, rigidity, and some canonized found “truth.”
Before we get too lost in the abstracts of adventure, I want to show you one of my favorite data stories. It is an incredible example of how a single image can arrange a complex topic into meaningful order. Take a moment to study the evolution of European armor shown on this page. See it through your own eyes, then we can examine how it works.
The illustrations let us know at a glance that the topic we are dealing with is the age of knights. The dots that link the helmets suggest some logical relationship between them. Further inspection reveals that connected helmets look similar to one another. The graphic's branched structure looks like a biological evolutionary tree, reminding us that technology morphs over time too.
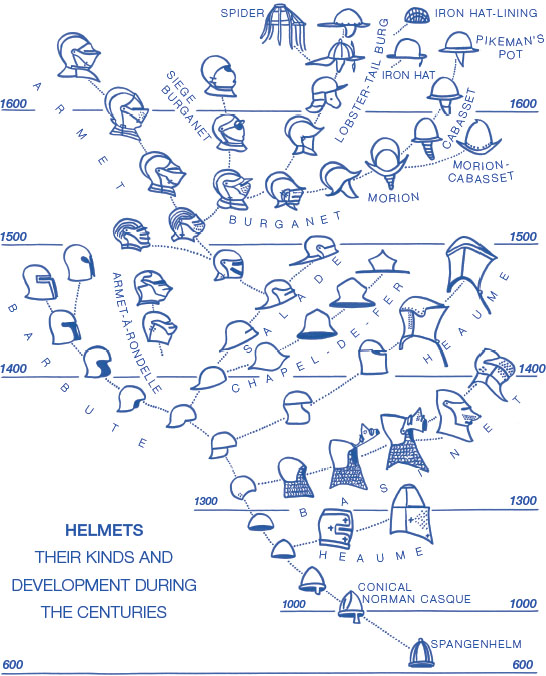
This illustration is based on a hundred-year-old graphic by Bashford Dean, curator of The Metropolitan Museum of Art's arms and armor collection. I believe it is an elegant and effective composition because it has engaging depictions, a strong conceptual map, and enough marks (the helmets) to encourage confidence with the information. A tree with only eight helmets, each represented simply with a labeled circle, would not resonate with the same kind of power.
The helmets open a door to the history of armor, a field I never gave much thought to before seeing this graphic. Now, I wonder if the helmets changed because of new weapons, advances in metalworking, or changing fashion. How did helmets outside of Europe influence this evolution? Did variation result from countless warriors customizing their own gear, or the designs of a few centralized armorers? How did helmets continue to evolve toward those used by today's soldiers, builders, and athletes? Plenty of keywords afford opportunities to search and learn more.
I can barely fathom the knowledge, creativity, and skill it took to produce this work. To complete data-driven hero cycles you must straddle fields that are far apart. You will need to study hard and soft sciences and the visual and communication arts. Any of these alone may not be enough to seize and deliver the treasure. History is littered with facts and figures that failed to convey understanding.
The interdisciplinary nature of data storytelling is quantitative and poetic, machine and human. It is a character profile that reminds me of the scientific explorers of the 1800s. Aspiring to the image of polymath Alexander von Humboldt or medical pioneer Florence Nightingale makes data storytelling seductive. A certain zeal comes with knowing that so many of humanity's tools are at your fingertips. It is your role to determine how to wield them in concert.
All this excitement also reveals why the craft is as formidable as it is enticing. Becoming functional in an assortment of disciplines is hard. Data processing is hard. Scientific discovery is hard. Awakening others to new realities is hard. The battle against the chaos of data is complex. And that is the magic of it all. When you venture into the craft of data storytelling, you are doing so with the knowledge that you cannot be an expert in all the skills it demands. Proceeding despite these deficiences takes some real heart.
You may call the craft something else. Perhaps you prefer data visualization, data journalism, dashboard design, or infographic creation. The craft waves many banners across various communities. What matters is that you are courageously confronting the chaos of it all to improve how people see the world. That is the goal.
Our Plan of Adventure
This book is not an anthology of past projects nor is it a singular “big insight” book. It is not a history book, textbook, or handbook—although aspects of these genres play their roles. So, what kind of book are you holding?
Info We Trust is a multi-sensory voyage through the craft of data storytelling. It is organized by a philosophy of information. This understanding connects fundamentals of experience to the great saga of civilization. We will begin with numbers. Then, step-by-step, stretch all the way to creating new knowledge. One consequence of this elemental approach is that the character of the first chapters is relatively stark. They focus on the bare-bones contrast between data and information. Do not despair at the initial abundance of antiquity. We are merely setting the table for the feast that follows. Read the book straight through to appreciate the narrative of the data storyteller as a hero of the information age.
This book is empowering. It is rich with practical details that you can use to construct new ways of seeing the world. When you flip through, on your first glance or later on, this is the knowledge that jumps out. Individual chapters and many page spreads can stand on their own as helpful references. Information consumers, information operators, and veteran data storytellers will all discover new ways to bring meaning into our lives. I hope to embolden you to take action and do great things with data.
This book elevates enduring principles of information design. It grew over the last decade of my work as a data storyteller and my study as devoted disciple of the craft. The book's implicit dialog is between hundreds of years' worth of visual information pioneers and me, drawing on my own experience producing many data projects. The point of this intersection is not to chronicle history or peer at dusty charts. The aim is to elevate timeless principles for creating new ways of looking at the world. Many lessons learned while informing past generations still rule. Today, these enduring principles can guide us in an age where information is so unconstrained that it can be overwhelming.
Without spoiling any of the surprises, I would like you to know that we are going to travel to some marvelous places together. If you would like to read additional chapter-by-chapter signposting, I encourage you to return to the table of contents, which maps the sequential journey ahead. By the book's end, I hope you join me in pursuit of wonderful ways of looking at the world.
We can all be heroes who embrace the chaos and potential of data for the greater benefit. It is now time for us to step forward together. As J.R.R. Tolkien's grey wizard beckoned, standing at the threshold: I am looking for someone to share in an adventure.
