
8. Financial Analysis of Human Resource Initiatives
Obviously, making good HR decisions does not always require developing spreadsheets and utilizing their built-in financial functions. However, it does always require thinking logically and carefully about the financial implications of your recommendations and actions. It is neither possible, nor desirable, for this chapter to provide plug-in templates for all the kinds of decisions your HR department will make. Instead, this chapter has three goals. The first is to highlight situations in which financial analyses can improve HR decision making. The second is to provide examples of how you can apply the simple financial tools discussed in the previous chapter in these situations. The third is to convince you that even if you have had no formal training in finance you can use these tools and concepts to develop useful financial models tailored to the specific HR issues your firm faces.
These tools and models can also do more than just improve your own decision making. They can be extremely valuable for packaging and communicating your “bright idea” to others. The ability to support your recommendations or resource requests with the kinds of analyses and metrics that management is used to seeing can dramatically increase the probability that you will get the approvals you are seeking. If every $1,000 that the HR department spends doesn’t produce a greater return on investment (ROI) than that amount could have earned in some other functional area, then those funds should be shifted out of the HR budget. This chapter provides a number of examples of how to think through HR issues from a ROI perspective. Later chapters make use of many of these same financial tools to analyze other HR topics such as pensions, stock options, and incentive pay.
Decisions Involving Cash Flow That Occur at Different Points in Time
Almost all the decisions that an HR department makes involve cash flow that occurs at different points in time. You spend money now, and if things go well, you reap the benefits months or years later. Few, if any, of the expenditures your HR department makes for recruitment, selection, training, and compensation can be properly analyzed without being sensitive to, if not to actually calculating, the net present value of the associated cash flows. Remember the discussion in Chapter 7, “Capital Budgeting and Discounted Cash Flow Analysis,” of Chrysler’s choice between offering its employees either one immediate payment or a series of three future payments? In that example, you saw that without calculating the present value of each alternative, it was impossible to know which one would cost Chrysler more.
Decision About Overtime Usage
For an example of how you should incorporate present value considerations into your HR decision making, look at the question of whether to ask employees to work overtime. Having employees work overtime usually means paying them time and one-half. That’s a 50% increase in wage costs. Why would you ever do that instead of hiring additional workers who would receive the base wage but not the overtime premium? The answer is obvious. Bringing on new workers would require to you incur additional recruitment, selection, and training cost and quite possibly additional health insurance and other employee benefits costs. You would pay the overtime premiums when its cost is less than the cost of hiring the additional workers. To make that determination you need to first express the cost of both alternatives in present value terms.
Exhibit 8-1 contains a spreadsheet that illustrates an analysis of this type. Assume that one of your manufacturing units has 2,000 employees working 40 hours per week. Your firm has just signed a large contract that will mean for the next 3 years the output of this unit will need to be expanded by 10%. You quickly realize that you could expand output in one of two ways.
1. You could keep hours per week constant and expand the workforce by 10%. That would mean hiring 200 new employees. In addition to their wages, each new employee would receive a benefits package costing $8,850 per year.
2. You could hire no new employees but have the current employees increase their workweek by 10%. That would mean each worker would work 44 hours instead of 40, with the last 4 being paid at time and one-half. If the current average hourly wage in this unit is $18.50, the overtime premium would be $9.25 per hour.
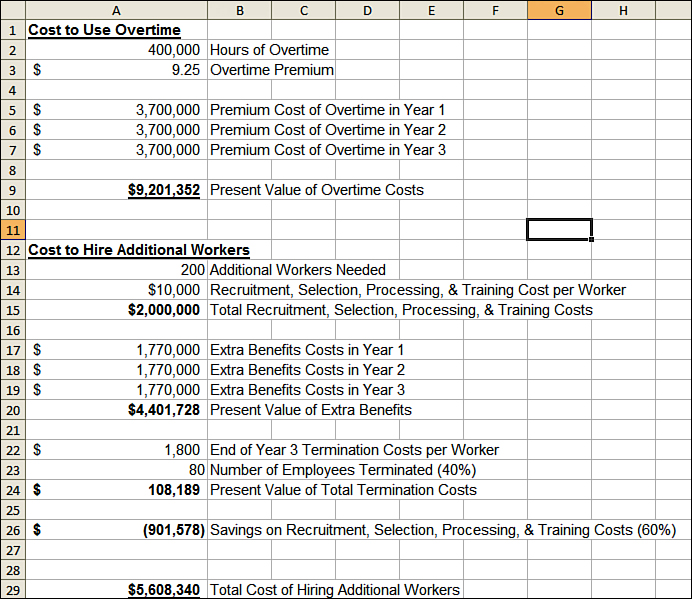
Exhibit 8-1. Using present values to make decisions about overtime usage
Begin by costing out the overtime option. Because the overtime costs will be spread over 3 years, you cannot simply sum them. You must first express them as present values. Cell A2 in this spreadsheet shows the number of overtime hours that would be needed per year ((10% of 40) × 50 weeks × 2000 workers). Multiplying this number by the overtime premium in cell A3 produces the annual overtime costs shown in cells A5, A6, and A7. If you thought wage rates would rise in the second and third years, it would be easy to increase the amounts in cells A6 and A7 by the appropriate percentages. Because the firm’s WACC is 10%, the formula in cell A9 is =NPV(0.1,A5:A7). You see that the present value of the 3 years of overtime premiums is $9,201,352. Note that following the with-without logic described in the previous chapter, you must consider only the premium costs of the overtime, not the base wage costs. The base wage will be paid whether the additional work is done by new employees who would receive no overtime premium or by current employees who would receive an overtime premium. It is therefore not relevant to the choice between using overtime or hiring new employees.
Now cost out the hiring alternative. If you assume that recruitment, selection, processing, and training costs would average $10,000 per new hire, the cost for 200 hires would be $2,000,000, and this amount is shown in cell A15. If 200 new employees were hired, the firm’s benefits costs would rise by $1,777,000 per year (200 × $8,840). These amounts are shown in cells A17, A18, and A19. If you project benefits costs to rise in years 2 and 3, you could easily multiply the amounts in these cells by the appropriate percentages. Entering the formula =NPV(0.1,A17:A19) into cell A20 reveals that the present value of the 3 years of benefits costs is $4,401,728.
This spreadsheet model also assumes that at the end of the 3-year spike in demand it will be necessary to terminate some of the recently hired workers. If 80 employees must be terminated at an average termination cost (processing, unemployment insurance, and so on) of $1,800, the total would be $144,000. However, because that amount would be spent 3 years from now, you enter the present value of that amount ($108,189) into cell A24. The formula in cell A24 is =+(A22*A23)/(1.1^3). The present value adjustment was accomplished by dividing by (1+i)t, in this case (1.103).
The final assumption incorporated into this spreadsheet was that the remaining 120 of the recent hires would be moved into vacancies elsewhere in the firm. That would avoid having to spend an additional $10,000 to fill each of those vacancies, saving the firm $1,200,000. The present value of that amount, $901,578, was entered into cell A26. The formula in cell A26 is =(-120*10000)/(1.1^3)
You can now sum the values in cells A15, A20, A24, and A26 to find that the total cost of the additional hires option is $5,608,340. With this set of assumptions, hiring 200 additional employees for 3 years would cost the firm almost $3.6 million less than having all current employees work an extra 4 hours per week at time and one-half. Of course, had the additional work effort been needed for only a short period of time, the overtime option would have been the cheaper alternative. It would not be difficult to do a sensitivity analysis to determine the minimum period of increased labor demand required before the hiring option becomes the more cost-effective one. This example was not intended as a one-size-fits-all template but rather as an illustration of how HR decisions involving cash flow over a period of time could be modeled. Certainly you could improve this model by changing the assumptions or incorporating additional factors that would make it more appropriate for use in your organization. The important thing is that you understand that this and all other choices between alternatives involving cash flow at different time periods should not be made without first adjusting for the time value of money. In each case you must draw upon your knowledge of HR to identify the factors and cash flows that need to be considered. After you have done that, it is relatively easy to build a spreadsheet and let Excel do the present value calculations.
Using NPV and IRR to Guide HR Budget Allocations
Before looking at examples to calculate the NPV of specific HR initiatives, consider the use of NPV and IRR as budget allocation tools. Suppose you are the training manager for a large firm with a division in each of the four states, as shown in Exhibit 8-2. That figure also shows your estimates of the cost to train the workers in each state and the net present value and internal rate of return that you believe the training would produce. The total cost to train the workers in all four divisions would be $8,500,000. How would you allocate a $4 million training budget across these four divisions? The answer is that you shouldn’t need to. You have already generated data that show that increasing the training budget to $8,500,000 would be in the best interest of the firm and its shareholders. A firm should undertake every investment that has a positive NPV. The NPV is an estimate of how much value will be created and how much shareholder wealth will be increased, as a result of that project. If your firm can raise the funds necessary to train all four groups at its 10% cost of capital, it should do so. HR managers need to make that kind of reasoned and documented argument to the CFO or others who make the budgetary decisions. Value creation consistent with the firm’s business strategy, not fixed operating budgets, should determine which projects to undertake. Nevertheless, the planning requirements in large organizations do often constrain investments, at least in the short term, to the amount available in a fixed budget. So assume that in spite of your well-reasoned and well-documented arguments your training budget remains fixed at $4 million. What’s the most you can do for the shareholders within this constraint? More specifically, what’s the maximum NPV you can generate with this $4 million budget?
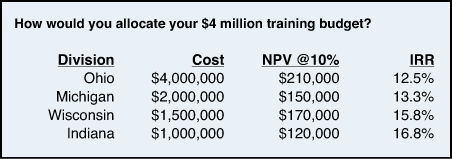
Exhibit 8-2. Four divisions whose employees could benefit from training
Before making that determination you must answer one additional question. Is it practical to train just some of the workers in a division, or will the training be useful only if everyone in that division is trained? Suppose your answer was that it would be useful to train some individuals even if it is not possible to train everyone in that division. In that situation you would maximize the return on your $4 million budget by ranking the divisions in terms of IRR. Allocate your budget first to the division offering the highest IRR and then work down the list until your budget is exhausted. In this example that would mean training the Indiana division, the Wisconsin division, and 75% of the Michigan division. The combined cost of training the Indiana and Wisconsin divisions would be $2.5 million. That would leave you with $1.5 million in unallocated funds. That $1.5 million would be enough to train only 75% of the Michigan division ($1.5 million available / $2 million cost). When partial investments are practical, you can fully utilize your budget. You can maximize the NPV generated by the total budget by allocating that budget over the projects that offer the highest rate of return.
If it were not practical to train just a portion of the employees in a division, you would maximize the return on your budget by comparing all clusters of investments that are possible within your budget constraint and then selecting the cluster that produces the largest NPV. This approach is illustrated in Exhibit 8-3. After reviewing the cost estimates in Exhibit 8-2, you can realize there are four possible ways to allocate your $4 million budget. You could train just the Ohio division, the Michigan and Wisconsin divisions, the Wisconsin and Indiana divisions, or the Michigan and Indiana divisions. Of these four possibilities providing the training to the Michigan and Wisconsin divisions produces the largest total NPV and would be the most effective use of your training dollars. Note that the Indiana division, which was the highest priority allocation when partial investments were practical, would not be among the divisions trained if partial investments were inappropriate.
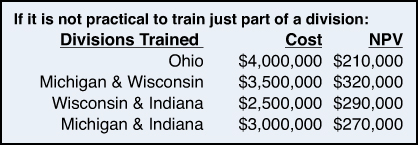
Exhibit 8-3. Budget allocation if partial investments are not practical
To review, when partial investments are not practical, it may not be impossible to fully utilize the funds in your budget. You can, however, maximize the achievable return on your budget by selecting the bundle of affordable investment opportunities with the highest NPV. The goal is the same as in the case when partial investments were practical. The difference is in the way you should go about identifying the projects to achieve that goal. In the first case you would rank projects by IRR and then allocate your budget over those offering the highest rates of return. In the second case in which partial investments were not practical, you should select the bundle of projects that offer the highest NPV.
Allocating Budgets When There Are a Larger Number of Alternatives
In the previous example there were only four bundles of projects that could have been undertaken within the $4 million budget. That made it relatively easy to do the calculations (refer to Exhibit 8-3) and identify the bundle that would produce the largest total NPV. Suppose however that you must allocate your budget not just across four divisions but across the 15 potential projects. The logic is exactly the same, but the number of different bundles of projects to be considered is extremely large. Fortunately, Excel has a built-in function that simplifies tasks such as this. Exhibit 8-4 shows the estimated NPV and cost of these 15 projects. Column F will be set to 1 for each project you choose to fund out of this budget, and to 0 for each project you choose not to fund. Only three cells have formulas entered into them:
C20: =SUMPRODUCT(C4:C18,F4:F18)
C21: =SUM(F4:F18)
C22: =SUMPRODUCT(E4:E18,F4:F181)
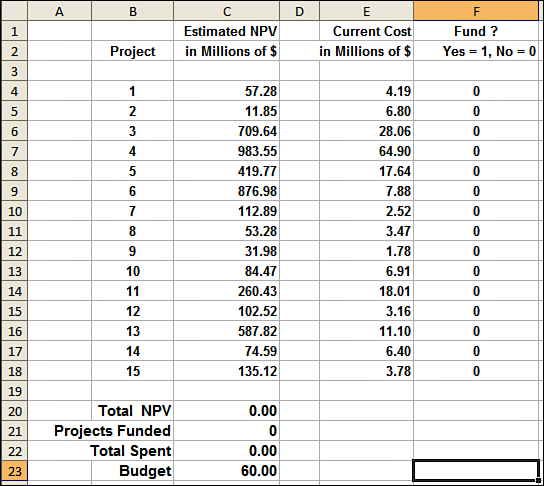
Exhibit 8-4. How would you allocate a $60 million budget across these 15 projects?
The total NPV is calculated in cell C20, which multiplies each project’s NPV by 1 if the project is funded and by 0 if it is not. These products are then summed. Obviously, NPVs multiplied by zero add nothing to the total. The total cost is calculated in C22 using the same approach. Each project’s cost is multiplied by 1 if the project is funded and by 0 if it is not. Costs multiplied by zero add nothing to the total. You can now use Excel’s Solver function to select the projects to pursue.
The Solver function can be accessed by clicking the Data tab at the top of an Excel spreadsheet. (If Solver is not visible on the right side of the Data menu, you must enable this add-in. The Excel Help function describes the steps for doing that.) When the Solver window opens, you can enter the parameters shown in Exhibit 8-5. These parameters instruct Excel to find the bundle of projects that will maximize the total NPV shown in cell C20. Excel will do this by comparing all possible combinations of ones and zeros in the range F4 to F18. The values in F4 to F18 are restricted to one or zero by the constraint defining this range as binary. The other constraint simply says the total cost in C22 must be less than or equal to the $60 million budget shown in cell C23.
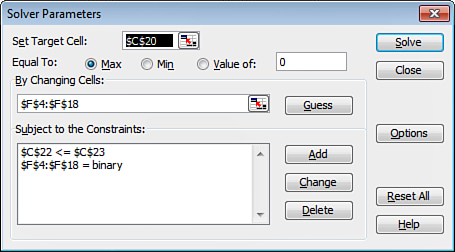
Exhibit 8-5. Setting parameters in Excel’s Solver function
As soon as you click the Solve button, the spreadsheet is adjusted, as shown in Exhibit 8-6. Pursuing the seven projects identified by 1s in column F produces the largest total NPV achievable within this budget. This is calculation is, of course, only as good as your estimates of the NPVs and the costs. Chapter 9, “Financial Analysis of a Corporation’s Strategic Initiatives,” illustrates techniques for incorporating risk and uncertainty into estimates of this type.
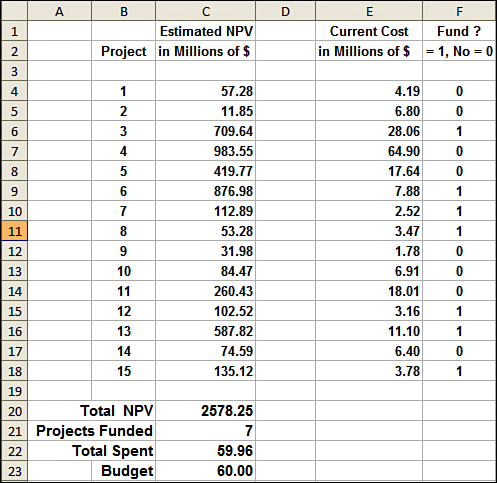
Exhibit 8-6. Optimal allocation of $60 million budget across these 15 projects
Are Models Such as the Previous One Really Useful for HR Managers?
There are potentially three benefits HR managers can gain from understanding models such as the previous one. First, they provide a framework for thinking about the choices managers must make. It is almost always the case that the number of plausible projects is larger than what can be accomplished within the available budget. Whenever this is true, some procedure will be used to determine which projects to fund. The objective of that procedure should be to select the bundle of projects that maximizes the total NPV that can be achieved within this budget. Even in a situation in which no numerical estimates of the potential benefits are produced, that principle should guide decision making. Second, on some occasions it will be useful to prepare a spreadsheet such as the one in Exhibit 8-6, even if the numbers plugged into it are only rough estimates. Suppose the numbers in column C of Exhibit 8-6 were your best estimates of the net benefit from each project. Without the spreadsheet, identifying the subset of projects that would maximize the return on your budget would require a trial-and-error process that could take hours to complete. Finally, HR managers must understand models of this type if they are going to be successful in their role as strategic partners. HR managers often encounter models of this type while working with colleagues in finance, R&D, manufacturing, or marketing.
Calculating NPV of Specific HR Initiatives
HR initiatives can, of course, take many forms. Examples could include enhancing the firm’s selection procedures, in-person or online training programs, job redesign, employee wellness programs, efforts to increase employee engagement, updating the HRIS system, changing the compensation mix, and countless other activities. Though quite diverse in their substance and perhaps significance, all these should be considered from an ROI perspective. Because it is not feasible in this chapter to provide dozens of templates each focused on a different HR activity, the discussion focuses on four examples chosen to illustrate a range of analytical issues. These four examples (purchasing HRIS software, cost-benefit analysis of a training program, a turnover reduction effort, and building a daycare center for the children of your employees) will hopefully contribute to your understanding of and comfort with approaches that you can then adapt to fit the specific HR initiatives that your firm is considering.
Mutually Exclusive Alternatives: Which HRIS Software to Purchase?
Your firm is considering a major investment in human resource information system (HRIS) software. After months of research you have narrowed the choice to the two alternatives described in Exhibit 8-7. The first is a basic HRIS package that would cost $1 million to purchase and install. You estimate that having that package would reduce your data entry and data processing costs by $250,000 per year for the next 10 years. The other alternative is a high-end HRIS package that would cost $3 million to purchase and install. This software, you estimate, would reduce your data entry and data processing costs by $650,000 per year for the next 10 years. You have estimated the IRR and NPV for both alternatives. The formulas in cells C16 and E16 are =IRR(C3:C13) and =IRR(E3:E13). The formulas in cells C18 and E18 are =C3+NPV(0.1,C4:C13) and =E3+NPV(0.1,E4:E13).
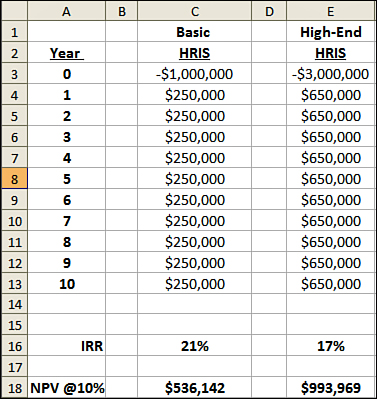
Exhibit 8-7. Use NPV, not IRR, to rank mutually exclusive alternatives.
Which software package will you recommend to your boss? The IRRs tell you the basic package can provide your company with a higher rate of return on the company’s investment. On the other hand, the high-end package will produce a larger NPV. You should recommend the high-end system. It will provide your firm with a much larger net benefit. Yes, it costs more, but the NPV calculation has already taken into consideration the 10% cost of raising those additional amounts. When alternatives are mutually exclusive (if you purchase one, you won’t purchase the other), you should rank them using NPV, not IRR. It’s true that if you could buy and use three of the basic systems, your total NPV would be even greater. Of course, that is not practical in this case.
Sunk Costs Are Irrelevant
Suppose the HRIS software your firm has purchased must be customized to fit your firm’s HR practices. Actually, in some cases you may need to modify your HR practices so that they can be accommodated using this software. Those are both time-consuming and expensive activities. At the time the project was approved, you estimated that process would cost $1 million and take 1 year. You were willing to make that investment because you believed that when implemented the new HRIS system would produce benefits with a present value of $1.5 million. In other words, you thought this HRIS project would have an NPV of $500,000. Things didn’t turn out exactly as planned. It’s now been 2 years. You have already spent $2 million, and the system is still not ready to go live.
When you ask the team leader what happened, he responds, “Well, we’ve learned a lot. With another $500,000 and another year, we can get the system up and running.” Should you fire the team leader and dump the project? Whether you should fire the team leader depends on whether you think the delays were his fault. Now focus on the second question: Should you dump the project? Assuming the latest forecast is an accurate one, 1 year from now you will have spent a total of $2.5 million for a project that provides benefits with a present value of $1.5 million. You will wish you had never started this project, but at this point you should continue it. The only cash flows relevant in making that decision are the additional $500,000 you must put in to complete the project and the $1.5 million benefit you will receive after it is completed. The $2 million that has already been spent is a sunk cost. That amount will be unchanged by what you decide today, so it should not influence what you decide today. Even if the sunk costs were $100 million (or any other number), you would continue the project if you thought spending $500,000 now would produce $1.5 million in benefits. At any given point in the life of a project, the only two things that should influence a continuation decision are the costs to complete the project and the present value of the cash flow that will be obtained if the project is completed.
Cost-Benefit Analysis of a Training Program
If training is successful it produces increases in employee performance in the months or years following the training program. To judge the ROI from training, you must determine whether the present value of the future performance increases is greater than the upfront training costs. It is easy to do this in a spreadsheet after the costs and benefits have been estimated. Obtaining useful estimates of the training costs is usually straightforward. You can begin by preparing a laundry list of cost components and attempting to put a dollar value on each of them. Exhibit 8-8 contains a checklist of potential training cost components. In your situation some of these may be insignificant, and there may be others not shown on this list that you will want to include.
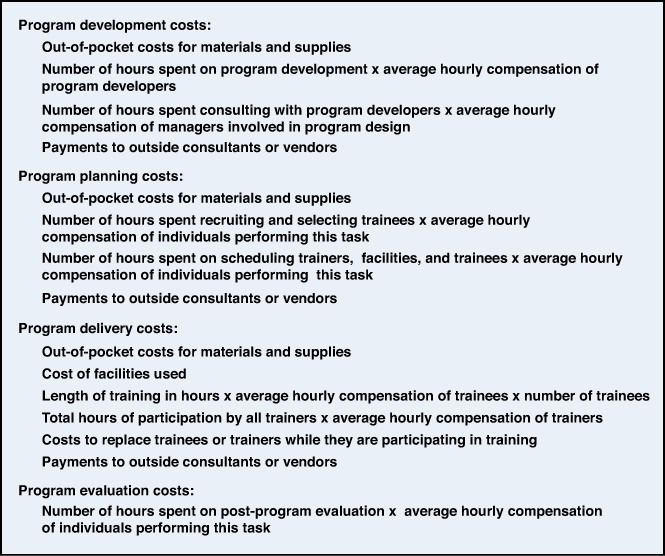
Exhibit 8-8. Examples of possible training program costs
Determining Program Impacts Using Pre-Post Changes
Estimating the cost of training is almost always easier than estimating the benefits from training. Conceptually, the benefit is the dollar value of the increased employee performance that results from the training. Measuring that requires you to determine how much performance has changed as a result of the training, and to place a dollar value on that performance change. In some cases direct measures of performance are available. Examples of directly measurable outputs might be the revenues generated by a group of sales reps or the number of manufacturing defects attributable to worker error. In both of these cases, it would be easy to determine how much performance changed between the pre- and post-training periods. It would also be relatively straightforward to calculate the profits resulting from the increased sales or reduction in manufacturing costs due to a lower defect rate. However, even in situations such as these, you must be extremely cautious about the assumption that the pre-post change was caused by the training. Is it possible that pre-post-changes were fully or partially the result of other factors? For example, could the higher sales during the post-training period be because external business conditions improved? Could the lower defect rate be because business conditions weakened allowing workers to operate at a less frantic pace? Or could the lower defect rate be because workers were more experienced in the post-period than during the pre-period? Only if you are comfortable ruling out alternative causes of the pre-post change, can you be confident using that pre-post change as a measure of the training effect.
Determining Program Impacts Using Comparison Groups
If you are not confident that most of the observed pre-post change was caused by the training, things become more complex. One option might be to compare the performance change of the trainees to the performance change in a group of similar employees who did not receive the training. If the trainees improved more than the nontrainees, this might be a reasonable measure of the training’s effect.
Even when a comparison group is available, the data needs to be interpreted cautiously. Suppose you send a group of managers to a week-long executive education program at a prestigious university. You observe that their performance ratings after participating in this program are substantially higher than they were in the past. That’s encouraging, but before reaching any conclusions, you decide to review the change in performance ratings during the same period for a group of managers who did not attend this program. You find that the average performance rating increase among the attendees was much larger than the average performance rating increase among the nonattendees. Is that solid evidence that the program was effective? Maybe. What determined why some managers attended the program and others did not? For example, if you selected your highest potential managers to attend this program, even if the training program had no effect, those high-potential individuals would have probably performed better than the nonattendees in the year after the training. Those differences in individual ability might be misinterpreted as program effects.
You should always ask yourself what caused some individuals to end up in the treated group and others to end up in the comparison group. The answer to that question may suggest there would be post-program differences between the participants and the nonparticipants even if the program itself had no effect. HR managers seldom achieve laboratory-like conditions for isolating the effect of training programs or other initiatives. However, you need to carefully think about the program impact numbers you enter into your NPV models. Hopefully, you can rule out alternative explanations and be relatively confident that the observed changes came about because of the program being evaluated. Unless that can be done, there is a danger that the financial analyses based on these numbers will be misleading.
...But What If Everybody Gets the Training?
Identifying a comparable group of nontrainees can be difficult in situations in which management wants everyone to be trained. However, if all employees do not receive the training at the same time, it may be possible to utilize the individuals who are trained in later periods as the comparison group for the individuals trained in earlier periods. In the following diagram, the Os represent observations about employee performance, and the Xs represent training or some other HR program.
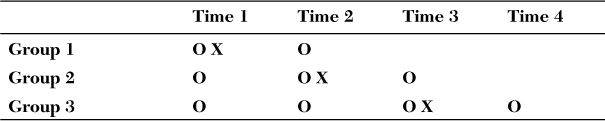
You could between Time 1 and Time 2 use the experience of Groups 2 and 3 as the comparison for the trainees in Group 1. Between Time 2 and Time 3, you could use the experience of Group 3 as the comparison for the trainees in Group 2. If it is not possible to construct a reasonable comparison group, managers will be forced to rely upon their judgment about what percentage the pre-post performance change was the result of the training.
Measuring the Dollar Value of Program Impacts
Determining what portion of the change in employee performance was the result of a training program or other HR initiative is only one of two challenges you will face. The second is putting a dollar value on the change that occurred as a result of this training. In cases like the manufacturing worker or sales rep examples previously discussed, calculating these values is relatively straightforward. At other times, such as sending managers for advanced training in strategic planning, quantifying and valuing the results is extremely difficult. What can you do when the dollar value of the performance change is not directly measurable? Some HR scholars1 have proposed statistical techniques for estimating the value of a high performer compared to an average performer. If an organization can measure, in financial terms, output at the workgroup level and has performance data on individual employees, regression analysis can be used to estimate the dollar value of a one standard deviation increase in performance. If the dollar value of a one standard deviation increase in performance was, say, $30,000 per year, then a training program that increased performance ratings on average by 0.5 standard deviations could be assumed to produce a benefit of $15,000 per worker per year. Of course, in addition to the possible imprecision in the estimate of the dollar value of one standard deviation of performance, this approach offers no assistance in answering the previous question: “By how much (or how many standard deviations) did the training increase performance?” That question still must be answered by looking at pre-post changes in performance ratings or comparisons to a group of nontrainees.
Using Breakeven Levels as a Planning Tool
In situations in which the dollar value of performance increases is not directly measurable, and where the data required to generate statistical estimates are not available, managers may find that the most practical approach is to work with breakeven levels. Suppose your best estimate is that a proposed training program will increase productivity by 10% to 30%. You realize that’s a large range but unfortunately do not have any sound basis to make a more precise forecast. One option would be to calculate the minimum increase in productivity necessary for the program to cover its own costs, that is, a breakeven level. If the breakeven level were 5%, you could approve the program, believing an impact of at least that size was likely. Had the breakeven level been 40%, you might have rejected the program because you felt a benefit of that magnitude was unrealistically optimistic. Making a judgment about whether a breakeven level can be reached is often much easier than making a point estimate of what a program’s effect will be.
Exhibit 8-9 provides an example of applying a breakeven approach within the context of an NPV analysis. Assume one of your high-potential managers approaches you and says she would like to enroll in an executive MBA program at a local university. The degree can be completed in 1 year. She will do the course work during evenings and weekends but wants the company to pay the $75,000 tuition costs. Would this be a cost-effective investment for your firm?

Exhibit 8-9. Estimating breakeven level benefits of a training program
Your experience has been that employees stay with your firm for on average 6 years after completing their MBA. For that reason, you decide to model the benefits over a 6-year time horizon. Columns B, C, D, and E calculate the NPV at a 10% discount rate under four different assumptions. The assumptions are that completion of her MBA would increase this employee’s value to your firm by 10, 20, 30, or 40 thousand dollars per year. This simple analysis reveals that paying these tuition expenses will not be cost-effective unless as a result of obtaining her degree the employee’s value to your firm increases by at least $20,000 per year. If you think that’s a realistic expectation, there is a solid basis for approving this employee’s request.
Training That Doesn’t Increase Productivity Could Still Be a Good Investment
When interpreting a specific NPV or IRR result, you must not lose sight of the broader context. Suppose that paying for this individual’s MBA did not have a large impact on her productivity at your firm but did signal to her that she was a highly appreciated and highly valued member of the organization. That signal might be important in her decision to stay with your firm rather than jump to a competitor. In that scenario the training served not to increase productivity but as a way to retain highly valued talent. If the MBA increased her productivity by only $10,000 per year, the NPV would be negative (refer to Column B of Exhibit 8-9). You must decide whether you are willing to pay $33,720 to increase your chances of retaining this employee. Note that the cost of this retention device would be the NPV of this training, not the full $75,000. There may be times when you know you will undertake a project even if its NPV is negative. That does not necessarily mean calculating the NPV is unimportant. A supermarket may sell string beans at a loss to make money on steak. It does, however, need to calculate how much it loses on the string beans to ensure it can more than make up that amount on the steak.
Benefit/Cost Analysis of a Turnover Reduction Program
Costing turnover presents methodological problems of a different type. If you knew that employee turnover was costing your firm $600,000 per year, it would be simple to determine the maximum you should spend per year to reduce turnover costs by 25% (.25 × $600,000 = $150,000). You could easily justify spending $100,000 per year to increase wages, restructure your benefits package, or undertake any other HR program you thought would reduce turnover by 25%. Obviously, before making such judgments you need an estimate of your current turnover costs. Think of turnover costs as the sum of the following five components:
• Separation costs
• Replacement costs
• Training costs
• Change in compensation costs
• Change in performance
The process for calculating separation, replacement, and training costs is relatively straightforward. You sum all the out-of-pocket costs for each activity plus the cost of the staff time devoted to each activity. Exhibit 8-10 provides a list of potential turnover cost components. The Society for Human Resource Management (SHRM) also provides a useful and free web-based tool designed by Wayne Cascio and John Boudreau2 for calculating separation, replacement, and training costs.
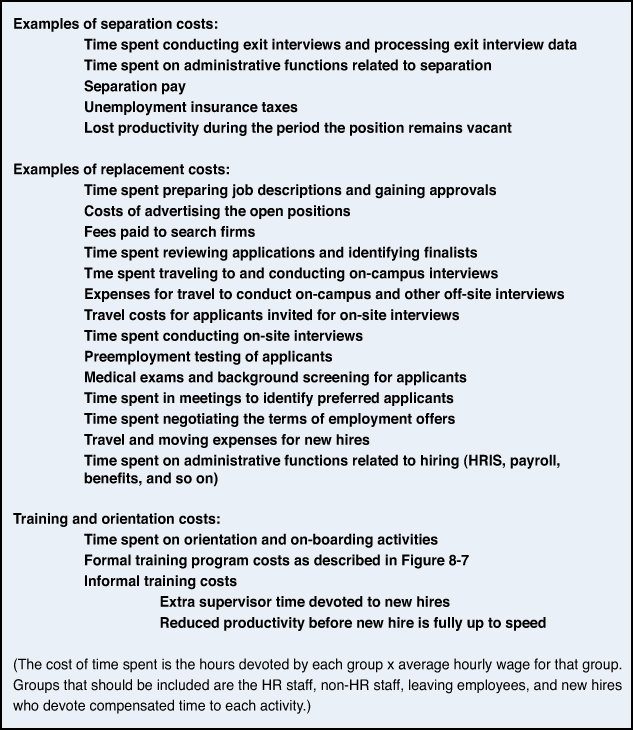
Exhibit 8-10. Examples of turnover cost components
The Composition of Turnover Can Be More Important Than the Level of Turnover
The change in performance between departing employees and their replacements is a factor that can be of far greater strategic significance than the types of costs listed in Exhibit 8-10. If departing employees are below average performers, replacing them with individuals who will perform at an average or above-average level can contribute dramatically to a firm’s competitiveness. You would actually want to increase turnover when the value of the increased productivity is larger than the increases in separation, replacement, and training costs. Conversely, if employees with above-average talent are disproportionately represented among those choosing to leave, the cost of turnover to your firm will be far greater than on the kinds of activities listed in Exhibit 8-10. In some positions productivity differences resulting from turnover will impact only a firm’s operating costs. Turnover in other positions, those that are critical to the successful implementation the firm’s business strategy, can be a primary determinant of a firm’s success or failure. Changing the composition of turnover (who leaves) can be more important than reducing the level of turnover (how many leave).
Comparing the Leavers and Their Replacements
If the difference in performance between employees who leave and their replacements is a critical factor, can the financial impact of this difference be measured? The SHRM website previously referenced includes a module designed by Casio and Boudreau that generates an estimate of the dollar value of the change in performance between employees who leave and their replacements. Cascio and Boudreau assume, “The difference in pay between leavers and their replacements is an indicator, although an imperfect one, of the uncompensated performance differential due to firm-specific human capital.”3 The idea is that employees who have firm-specific human capital, that is, knowledge or skill that is valuable only to their current employer, will not need to be fully compensated for the value of these skills. The employee does not have the bargaining leverage to demand full compensation for these skills because they could not be sold to other employers. That implies that when employees have firm-specific skills, employers are getting some value they don’t need to pay for.
Casico and Boudreau assume that the amount of firm-specific skill and therefore the amount of uncompensated performance is positively correlated with wages. In other words, if the replacement earns more than the leaver, the firm is gaining more of this uncompensated value. If the replacement is paid less than the leaver, they assume the amount of uncompensated value declines. The module they designed for SHRM assumes turnover costs go down when you pay the replacement more and go up when you pay the replacement less. For example, if an employee paid $65,000 leaves and is replaced by an individual paid $75,000, their model assumes turnover costs are $10,000 less than if the replacement had been paid $65,000. Their model assumes that a more highly paid replacement will have more (uncompensated) firm-specific skills. That may not be the case. In many organizations, replacement employees, regardless of wage level, will have limited or no firm-specific skills at the time they are hired.
Managers in many organizations would argue that paying replacements more has the opposite effect—it increases turnover costs. That argument would certainly be valid when replacements are paid more—not because they have more skills, but just because salary rates in the external job market have risen.
If you do not feel the replacement assumptions made by the Cascio-Boudreau model are appropriate for your organization, you can calculate turnover costs by adding to the sum of the separation, replacement, and training costs the actual change in salaries between the leavers and the replacements, and your own estimate of the dollar value of any increase or decrease in performance. In some situations firms can directly measure performance difference between the leavers and their replacements. In others, you may need to rely upon a judgment made by an appropriate supervisor. For example, suppose a group of employees earning on average $50,000 per year leave and are replaced by individuals earning on average $60,000. If the supervisor estimates that the replacements are 10% more productive than the employees who left, you could add to the sum of the separation, replacement, and training costs the salary increase of $10,000 per employee minus the productivity increase of $5,000 per employee (10% × $50,000). If the supervisor estimated that the replacements were 10% less productive than employees who left, you could add to the sum of the separation, replacement, and training costs the salary increase of $10,000 per employee plus the productivity decrease of $5,000 per employee.
Net Present Value of an Investment Involving Facilities and Equipment
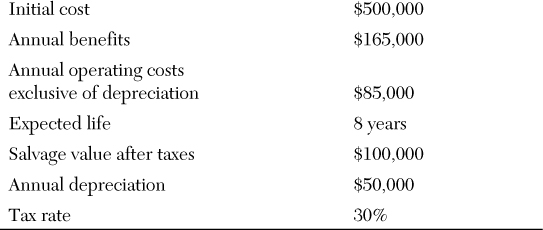
This example differs from the previous ones in that it involves investments in facilities and equipment. To analyze such investments properly, you need to consider depreciation expense and taxes and the differences between profit and cash flow. Suppose your firm is considering constructing a daycare facility for the children of your employees. You have carefully estimated that the new facility would have the following benefits and costs.
Your only remaining task is to draft a memo to your boss explaining what your estimates imply about the economic feasibility of the proposed childcare center. If your firm’s weighted average cost of capital is 11%, what is the expected net present value of this project?
As in all DCF analyses, you must begin by laying out the pattern of cash flow associated with this project. You know the initial cash outflow will be the $500,000 you estimated it will cost to build this facility. Exhibit 8-11 contains a spreadsheet that calculates the annual cash inflow for years 1 to 8. Cell B2 contains your estimate of the annual benefits. Factors you considered when deriving that estimate might have included decreased absenteeism because fewer employees will miss work because their childcare arrangements are disrupted; increased work effort if employees are less likely to arrive late or leave early because of childcare responsibilities; and perhaps increased productivity or lower required salaries if this childcare facility makes it easier for you to attract highly qualified employees. From your estimate of the annual benefit, subtract annual operating expenses and the depreciation expense. In this example the depreciation expense was calculated on a straight-line basis over 10 years ($500,000/10 years = $50,000 per year). If your estimates are correct, your firm’s pretax profit will increase by $30,000 per year and its after-tax profit by $21,000 per year.

Exhibit 8-11. NPV of proposed childcare center
DCF analyses, however, must be based on changes in cash flows, not on changes in profit. To properly analyze this investment, you must first determine how much cash is paid out in each year and how much cash will come in for each year. To convert your profit estimate in cell B7 to a cash flow estimate, add back the $50,000 depreciation expense. As you know the annual depreciation expense is not an additional cash outflow. It is an accounting reallocation of the $500,000 that was paid out initially. You may be wondering why you should subtract out the depreciation expense on row 4 if you are going to add it back on row 8. If you don’t subtract out the depreciation expense on row 4, you have overestimated the pretax income and therefore the amount of tax due. Taxes are a real cash outflow, so it is important to accurately estimate the tax payments.
Column F in this spreadsheet shows the pattern of cash flow associated with this project. Year zero is the $500,000 initial expenditure to construct the facility. The $71,000 annual cash flow you just calculated is shown in years 1 through 7. The year 8 cash flow is the sum of the final $71,000 annual cash flow net plus the $100,000 salvage value. In the interest of brevity, this example assumed the annual cash flow was the same in each of the 8 years. This is probably unrealistic, and you could easily expand this spreadsheet to model different benefits, costs, and therefore cash flow for each of the 8 year. The net present value of the nine cash flow amounts is calculated in cell F13 with the formula =F3+NPV(11%,F4:F11). If this project is evaluated on a standalone economic basis, it would not be good idea. It would produce no net economic benefit and would consume $91,233 of shareholder wealth. Of course, there might be other reasons, not reflected in your estimate of the annual benefits, for undertaking this project. If that is the case, you have demonstrated that it will cost your firm $91,233 (not $500,000) to pursue those other benefits.
What Is Your Firm’s HR Budget?
What does your firm spend per year to attract, develop, compensate, and retain its human resources? That seems like a simple question, but it’s surprising how many firms cannot answer it. If you don’t know the size of your total HR budget, how can you be sure you have allocated it optimally? If firm level aggregations are difficult, you might begin by thinking about the total HR budget for divisions or departments. The annual human resource cost for a firm or unit is far more than just the budget of the HR department. The total cost can be thought of as having the following four components: recruitment and selection, training and development, compensation, and administration. Typically, compensation costs and perhaps also some of the recruitment, selection, and training costs appear in the budgets of the operating units not in the budget the HR department. The HR department budget often consists primarily of administrative costs but may not include all administrative costs. Payroll processing costs, for example, are often not included in the budget of the HR department. Because HR costs are distributed across a range of budgets it is difficult to identify and sum them. More important, it makes it difficult to manage them from an HR systems perspective.
The complexities of managing total HR costs from a systems perspective is probably easiest to illustrate at the job level. Assume your firm’s IT department is recruiting to fill an applications engineer position. In your firm the average tenure in these positions is 7 years. The components of the total cost to fill this position for 7 years are calculated in the spreadsheet shown in Exhibit 8-12. If the cost of the individual’s starting salary and benefits is $100,000 and increases by 5% per year, the present value of the compensation cost discounted at a 10% cost of capital over 7 years is $555,870 (cell B11). The total cost is shown in cell A19. If your firm spends $633,000 to fill this position, is the allocation shown in Exhibit 8-12 the optimal one? Could performance have been improved or costs reduced by spending more on one component and less on another? Perhaps the $100,000 initial compensation was required because you needed an individual familiar with a particular software application. Could you have hired an individual without this specialized knowledge for $80,000 and then brought her up to speed through a carefully designed training program? At that lower compensation level, the present value of the compensation cost over the 7 years would be would be $444,696 (cell D11). You could have spent anything up to $111,000 on the training and still saved money.
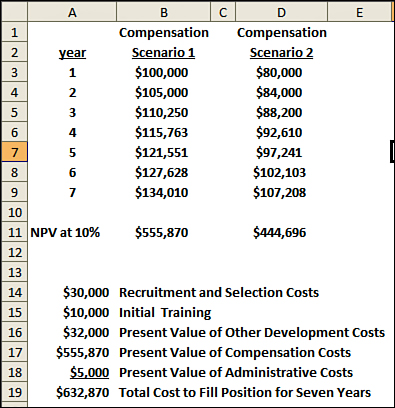
Exhibit 8-12. Cost of filling applications engineer position for 7 years
Is Your HR Budget Allocation Optimal?
Should a firm spend more on training to save money on compensation, or spend more on compensation to save money on training? Such make-or-buy choices are not the only possible trade-offs. As illustrated in Exhibit 8-13, there are trade-offs possible among all the HR budget components. Here are some examples. Should a firm spend more on selection to save money on training, or spend more on training to save money on selection? Spending $10,000 more on selection might enable a firm to identify individuals who can complete the training more quickly and therefore more cheaply. That would be a good idea if the reduction in training cost were greater than $10,000. On the other hand, spending $10,000 less on selection might be a good idea even if it meant the incoming employees were slightly less well-qualified. That trade-off would make sense if the reduction in new-hire quality could be more than offset by a $5,000 increase in training expenditures. Should a firm spend more on compensation to save money on recruitment and selection, or spend more on recruitment and selection to save money on compensation? Offering higher wages might attract more and better applicants and therefore reduce recruitment and selection costs. If so, that would be a good trade-off if the present value the extra wages were less than the savings in recruitment and selection. They are not highlighted in Exhibit 8-13, but there might also be trade-offs between administrative cost and these other factors. Spending more on any component of the HR budget could potentially save you money on the others. Those savings may or may not be large enough to justify the extra costs. Who in your organization analyzes questions like whether HR should shift money from A to B or from B to A?
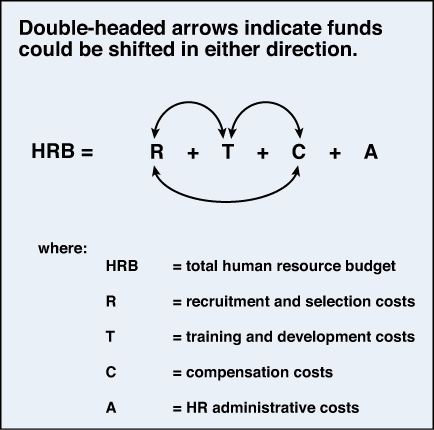
Exhibit 8-13. Trade-offs among HR budget components
For every position in your organization, there is a total cost to fill that position and a current allocation of that total cost across recruitment and selection, training and development, and compensation. Is that allocation optimal? How was that allocation determined? Too often it is the unplanned result of disjointed decisions by individuals responsible for unrelated budgets. Do the individuals setting compensation levels think about whether paying more could produce an even larger decrease in other HR costs? Do the individuals responsible for the recruitment, selection, training, and development of budgets think about questions such as whether increasing another unit’s expenditures by $10,000 would enable them to cut their own budget by more than $10,000? In many organizations questions like those fall through the cracks. It is possible to model these kinds of trade-offs formally, but in many organizations simply requiring managers to think about the allocation of the total HR budget (not the budget of the HR department) can produce major benefits. Those benefits can include substantial cost-savings or perhaps much more important, an increase in the quality of the workforce that can be achieved at a given budget level.
Maximizing the ROI on Your Analysis Efforts
A consideration of the potential financial costs and benefits is essential in all HR decision making. Not all decisions, however, require the development of spreadsheets or other quantitative models. You won’t want to spend a lot of time developing such models unless the issues you deal with are of financial or strategic significance. The criterion for assessing financial significance is clear; the dollar value of the potential costs and benefits is large. In making that determination you must consider which projects will have widespread impact. The individual case you analyze may not involve large budgets, but if it will set a precedent for companywide practice, its importance may be substantial. Projects of strategic significance (those that constitute a critical link in the firm’s value creation process) certainly warrant careful analysis. In these cases, however, successful execution may be more important than cost minimization. Spending additional funds to reduce the risk that the activity will not be completed properly and on time is often the appropriate course of action.
You won’t want to spend a lot of time on the analysis of projects that are not of financial or strategic significance. However, don’t overestimate the amount of time the analysis will require. The most time-consuming component of the types of analyses described in this chapter is the data collection. If you are fortunate enough to have an HRIS system that can generate the specific data needed, the amount of time required to analyze that data is often not large. When hard data is not available, models of the type described in this chapter may still be useful based on your own or your colleagues’ best estimates. Any time you decide to go ahead with a specific HR initiative, you are at least implicitly saying you believe the NPV from the activity will be positive. Any time you decide not to go ahead, you are saying you believe the NPV from that project will be negative. Plugging your own best estimates about potential costs and benefits into a spreadsheet can help you determine whether your gut feeling about whether to proceed with the project is consistent with your best estimates about the specifics. Constructing those spreadsheets is usually not a difficult or time-consuming activity.
When constructed, these models can also be useful for thinking through alternative possibilities. Before plugging in the numbers, it’s not always intuitively obvious how large the impact would be if one of the input variables turns is above or below what you anticipate. “What-if” models of this type are often a valuable planning tool. The bottom line is that the benefits from such models can be large, and the costs of creating them are usually low.