
14
Percentages
Introduction
In Chapter 11, percentages were related to decimals and fractions in an attempt to show the pattern of relationships between these concepts and, it is hoped, to make them mutually supportive in the development of the concept of numbers less than one. In this chapter, the work will be extended to all numbers, including those greater than one, but the key reference values of 50%, 20%, 10%, 5%, 2% and 1% will be used to build pre‐and post‐estimates and to check if an answer and/or the process used to solve the problem make sense. The main objective of this chapter is to provide concrete and visual images of percentages so that the formulae and algorithms are understood and that the understanding acts as an anchor for memory. This is achieved by focusing on a hundred and on one.
An Image of Percentage
Since percentage relates to 100, the image presented to the learner should involve a clear demonstration of 100. Further, it should demonstrate dividing the quantity up into 100 parts, thereby identifying one part out of the hundred parts. The 100 square (Figure 14.1) has been used throughout this book in several applications.

Figure 14.1 100%.
This chapter will deal with three types of percentage problems:
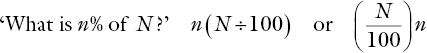
- Type 1 is ‘What is x % of N ?’ This is finding the percentage of a quantity.
- Type 2 is ‘What percentage of y is x?’ This is expressing one quantity as a percentage of another.
- Type 3 is ‘x is n% of which number?’ This is finding the original number.
Each type is explained in turn.
Type 1: ‘What is x% of N?’
An example can be used to show the hundred square in use. Start with an example where the pupil is likely to know the answer from the introductory work done in Chapter 11. The question chosen to set the procedure in familiar territory is, ‘What is 5% of 300?’
A general method that will be applicable to any percentage of any number uses 1%. So the first step is to calculate 1%. This is done by dividing the number by 100, so a knowledge of the role of place value when dividing by 100 is essential.
Example 1 5% of 300
1% is computed by using one hundredth,
, that is, dividing by 100
300 ÷ 100 is 3
5% of a number will be 5 times the 1% value
5% of 300 is 5 × 3.
5% of 300 is 15 (Figure 14.2)

Figure 14.2 The whole square represents 300. One square is 3. Five squares are 15. 5% of 300 = 15.
The 100 square can be pictured as representing the 100% of the number, in this example, 300. So each single square represents 3.
Alternatively the visual image could be of three 100 squares, where each single square represents 1.
Example 2 ‘What is 12% of 400?’
Again, start by finding 1%
1% is one hundredth, so divide 400 by 100
400 ÷ 100 = 4
1% is 4
12% will be 12 times the 1% value
12% = 12 × 4 = 48
This could be written as a flow chart (Figure 14.3):

Figure 14.3 Flow chart for 12% of 400.
The process is: dividing up into 100 (equal) parts to obtain 1 part (1%), use the 1% value to find any other percentage.
The answer can be checked against key values (see later).
Example 3 ‘What is 15% of 60?’
Again, start by finding 1%
1% is one hundredth, so divide 60 by 100
60 ÷ 100 = 0.6
15% will be 15 times the 1% value
15% = 15 × 0.6 = 9
(15 × 6 could be computed as 10 × 0.6 plus 5 × 0.6, where 5 × 0.6 gives half the answer of 10 × 0.6)
This could be written as a flow chart:
The work can be extended, depending on the age and ability of the learner, to lead to the general formula for the following question:
Whatever the question, learners should be encouraged to compare their answers with estimates based on the ‘easy’ numbers of 1%, 2%, 5%, 10%, 20%, 25%, 50% and 75%.
Type 2: ‘What percentage of y is x?’
This type of percentage is often presented as an examination‐score type of question such as the following:
‘If a learner gets 46 out of 85 in his maths examination, what is his percentage mark?’
A simple exemplar can be used to illustrate the procedure and act as a check, should the learner forget the procedure. So we could start with the following question:
What percentage mark is 40 out of 80?
The pupil should know that this is 50%, but is asked to write out the fraction, ![]() (‘40 out of 80’) and convert it (by dividing) into a decimal:
(‘40 out of 80’) and convert it (by dividing) into a decimal:
The pupil should convert this to a percentage, that is, a fraction out of 100, by multiplying by 100/100.
This format requires the learner to convert a fraction, x/y, into a decimal and then into a percentage. The decimal gives the score out of 1. To make this a score out of 100, that is, a percentage, multiply by 100.
So, in the example above, 46 out of 85 becomes 46/85 = 0.5412, or 0.5412 out of 1, which converts to a percentage of 54.12% or 54.12 out of 100.
Again the first step uses one percent.
If we refer back to Chapter 11, the procedure could also be seen as one of changing the fraction x/y to an equivalent fraction with a denominator 100. The learner has to appreciate that a percentage is a fraction with a denominator of 100, but where the convention is that only the value of the numerator is quoted and the symbol % tells us that this value is ‘out of 100’.
Again the result can be compared with key values. In this example, 46/85 is a little over a half and thus a little over 50%.
Type 3: ‘x is n% of which number?’
Again the focus is on 1%. So, in an example such as, ‘36 is 12% of which number?’ the first operation is to calculate 1%. Using the 100 square image again, the question is, ‘What goes into one small square?’
The student is asked, ‘If there are 36 objects shared into 12 small squares, can you work out how many there are in one square?’ The answer should be found by computing 36 ÷ 3, giving an answer, ‘three in each square’. The calculation of 100% is then a matter of multiplying three by a 100, providing the answer 300.
As another example, ‘10.5 is 15% of what number?’
If 10.5 is 15%, then 1% is 10.5 ÷ 15
10.5 ÷ 15 = 0.7
1% is 0.7, so 100% is
0.7 × 100 = 70
In all three types, 1% is the key to finding the answer.
Estimates from key values
In Chapter 11 we explained the relationship between fractions, decimals and percentages. In Chapter 7 we showed how all basic multiplication facts could be accessed by using the key numbers, 1, 2, 5 and 10. This principle can be extended to percentages for estimating and for many everyday applications.
The key facts are the following:
100% is 1, that is, all of the quantity.*
50% is ½, that is, half of the quantity, obtained by dividing by 2.
10% is
, that is, one‐tenth of the quantity, obtained by dividing by 10.
1% is
, that is, one‐hundredth of the quantity, obtained by dividing by 100.
These can then be extended by relationships such as:
2% is twice 1%
5% is half of 10%
2.5% is half of 5%
20% is twice 10%
25% is half of 50%
75% is 50% + 25%
Once again, interrelating these numbers to the target number can make many calculations much easier, provide estimates and enhance the learner’s understanding of the concept of percentages. It is yet another example of working from (and using) what the learner knows to take him to what he can know. In doing this, you are returning to previously taught facts and procedures and reinforcing work that has been covered earlier.
Consider the problems of the format ‘What is n% of N?’
Example
What is 50% of £88?
This value can be halved again to give 25% of £88 as £22.
50% gives a reasonable estimate for values from 45% to 55%.
Example
What is 10% of £88?
£88 ÷ 10 = £8.80 (You may have to explain that .8 translates to .80 for money and vice versa, that is, .80 keyed into a calculator will be displayed on the screen as .8).
The two values, 10% and 50%, can be combined to give 40% and 60%, for example 40% of £88 is 50% − 10%.
The 10% value can be doubled to give 20%:

To obtain 1% of £88, divide by 100:
This can be doubled for 2%.
So several key values have been obtained with just basic calculations, allowing the learner to combine values from a selection of: 1 %, 2 %, 5 %, 10 %, 20 %, 25 % and 50 %.
Summary
The one hundred square provides images of 1% and 100% in a way that allows the algorithm to be related directly to the image. The learner has to evaluate the data in each question and form a mental image of what goes into each one square in order to understand this concept and its procedures.
The estimation procedure allows the learner to check if his calculation is reasonable and also acts as a simple method for calculating percentages in daily life such as discounts in sales, which tend to be easy values, and tipping in restaurants.