
16
Teaching the Full Curriculum
Introduction
Faced with a dyslexic or dyscalculic child who at a young age is experiencing great difficulty with mathematics, many teachers will feel it is best to persevere with the basics of numeracy until the child has mastered them. The teacher might regard these basics as so fundamentally important that to proceed to other topics would not seem to represent the best use of time or effort. As time passes, and the child continues to experience many of the same difficulties, the temptation is to concentrate even harder on a narrow range of activities. Such a situation can continue over a period of years, during which the child is enduring constant failure and losing all confidence in himself and the learning process. The loss of confidence is a serious additional problem in a subject where confidence in performance is so important – mathematics is like walking a tightrope, in the sense that if you think you are going to fall, then you will probably fall.
Varying the mathematical diet for such a child is a course of action that may have beneficial effects of three kinds:
- It may provide him with experience of some success and bring back some confidence.
- Even more importantly, it may begin a process that gives him an alternative way of looking at the subject – a way around his problems, when there may be no way through them. If building a wall can be used as a metaphor for the learning of mathematics, then the wall of a dyslexic or dyscalculic child will have many bricks missing for parts of the subject he has not mastered. Of course, a wall can remain standing despite a few gaps, with the support of the bricks around the gaps. The wider the wall, the more missing bricks it can bridge. If the maths wall of a child with learning difficulties cannot be built directly upwards, it should be built across and then upwards, by widening his mathematical experience, especially at the foundation levels.
- It may give him abilities, such as telling and understanding the time, which can be regarded as social or ‘survival’ skills (Copeland, 1984), the lack of which can be embarrassing for the child or his parents. Widespread access to digital displays of time via mobile phones now makes it possible to read the time (but not necessarily understand it).
Maths is a wide mixture of skills and knowledge, far beyond arithmetic. Topics such as graphs and geometry may be far more encouraging.
The introduction of mathematical topics other than number can be achieved in such a way that it also reinforces numerical work by using different contexts. In a single chapter, it is impossible to cover much curricular ground, but it is possible to describe some general principles and give a number of illustrative examples.
Some General Principles
Sound foundations
‘Children who start behind, stay behind’ (Geary, 2013).
In an ideal world we would not have children who ‘start behind’, but we do. Early learning sets the foundations for a subject that is developmental. The early curriculum should be about understanding and not just about pouring information and facts into brains.
If those foundations are missing, or weak, future progress will be handicapped. Hence the need to build reviews and revisits into the curriculum.
Plan for the long term
It is extremely important that long‐term success should not be jeopardised for the sake of early gains through the use of short cuts that are not conceptually based. This can be taken to include reliance on special cases, mnemonics or too many rules, which dyslexics and dyscalculics are likely to forget, or remember inaccurately.
Examples
- When faced with the mixed fraction 3½, many secondary‐aged dyslexics will feel they know how to convert it into a top‐heavy fraction, because they remember a rule ‘multiply that by that and add that’. When challenged which ‘that’ should be multiplied by which, and which ‘that’ should then be added, some will choose three times one add two, some will choose two times one add three, and some will choose two times three add one (the correct version). That most of them remember the rule inaccurately is bad enough, but what is even more dangerous is when they have a total conviction that they can rely on what they remember.
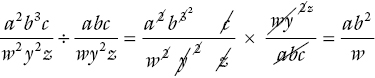
- In Chapter 12, the division of a fraction by another fraction was dealt with in two ways. One way was to make segment sizes the same and then divide the ‘like with like’. The other way suggested, which initially seems bizarre, was to invert the divisor fraction and then multiply. It may be the bizarre nature of this rule, but it is one rule that adults seem to retrieve from their school day memories of maths. For students who do progress mathematically, this particular rule extends much further and has great value in algebraic fractions such as:
Use illustrations of wide applicability
Once children understand the concept of area, and can fluently calculate the areas of rectangles, the area model can help in many ways. Towards the end of Chapter 9, the use of blocks for multiplications transforms into the use of scale drawings and then area sketches. For example, the single multiplication 38 × 14, viewed as (30 + 8)(10 + 4), performed as the four partial products 30 × 10, 30 × 4, 8 × 10 and 8 × 4 can be illustrated using the areas in Figure 16.1.
Figure 16.1 The area model for multiplying numbers.

This idea can be exploited in a very similar way, to perhaps even greater benefit, in algebraic multiplication. Figures 16.2 and 16.3 show how to work out two problems:
Figure 16.2 The area model for multiplying in algebra: (x + a)(y + b).

For (x – a)(y – b):
This is done in stages:
- Stage 1. Area (1) xy Figure 16.3a
- Stage 2. Area (2) y (x – a) = xy − ay Taking area B off area 1. Figure 16.3b
- Stage 3. Area (3) xy – ay – bx. Taking area C off area 2. Figure 16.3c
- Stage 4. Area (4) (x – a) (y – b). Adding back area D, which has been taken off twice.
Area (4) is for (x – a)(y – b) = xy – ay – by + ab
Figure 16.3a The area model for multiplying (x – a)(y – b). Stage 1.
Figure 16.3b The area model for multiplying (x − a)(y − b). Stage 2.

Figure 16.3c The area model for multiplying (x − a)(y − b). Stage 3.
Figure 16.3d The area model for multiplying (x − a)(y − b). Stage 4.
There are many other instances where the area model can prove invaluable. It is used elsewhere in this book, for multiplying fractions, for example.
‘Maths is easy – only writing it down is hard’
It is all too common to consider only the written form of mathematics, the most difficult form for many dyslexics and dyscalculics. In fact, the written form should be the last aspect considered. There follows another variation of algorithm for division:
Example: long division
Consider 425 ÷ 17:
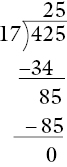
It might be taught as an algorithm or a series of steps to be learned and performed in sequence. This would make things very difficult for a dyslexic or dyscalculic, who has problems with short‐term memory, multiplication facts and sequencing. A better approach would be to consider the real mathematics happening when a physical division takes place. Then, the written version constitutes only the record of a common event that is well understood. Rather than trying to follow a badly remembered and badly understood list of steps, the student is better encouraged to imagine dividing £4.25 between 17 people, or indeed to actually perform the division with coins. The written steps will match the physical steps.
Consider the £4.25 as 425p, in the form of 4 one pound coins, 2 ten pence coins and 5 one penny coins. First, we would attempt to divide the 4 £1 coins between the 17 people:
Clearly there are not enough even to have one each, so the 4 pounds would be changed into 40 ten pence pieces, which would added to the existing 2 to give 42:
Now we would attempt to divide the 42 ten pence coins between the 17 people (a separate problem in itself). They would receive 2 each, and this would use up 34 of the ten pence coins:

This would leave 8 ten pence coins that could not be divided between the 17 people:

These would be changed into 80 one penny coins, which is added to the existing 5 to give 85:

Now we would attempt to divide the 85 one penny coins among 17 people. They would receive 5 each and this would use up all 85, with none remaining:
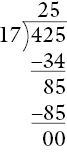
The written form, obtained here by recording the physical steps, is identical with the version achievable using a difficult algorithm. The difference is that this teaches the child how to understand what has happened, and how to repeat it.
Example: a rule for equations
Equations are a very important theme, a theme that runs all the way through maths. The highly stylised procedures to be followed for solving them are very likely to confuse many dyslexics and dyscalculics. Therefore it is necessary for a teacher to be extremely alert, sensitive and responsive as well as very careful about how this work is presented. Once again, the method that will be best understood is the method derived from physical experience.
For solving an equation like x + 3 = 8, there are various schools of thought. Pupils can be taught with flow charts. They can be taught that equations are like balance scales, pivoted about the = sign, and that any operation must be done to both sides to maintain the balance. For this example, it is possible to subtract 3 from both sides to leave x = 5. Although this method can be physically demonstrated with a special pair of balance scales, we have found that it can seem ‘artificial’ and lead to some awkward subtractions at times. Some pupils prefer another method, which they sometimes discover for themselves. The teacher covers up an ‘unknown’ number of counters, adds three more and then shows the result to be eight. If the pupils are then asked to describe how to find the original number, none of them have any doubt that the extra three must be subtracted (revealing the original five). In its written form, this appears as follows:
It looks as though the three has crossed over the = symbol and the + sign has changed to −. As the pupils describe it, the number that was added must now be subtracted. The written form has reflected what the pupils found self‐evident.
For solving the equation:
the teacher again covers up the ‘unknown’ number of counters, this time explaining that they are being divided into two equal groups and then showing one group to contain five. Now if the pupils are asked to suggest how to find the original number, they will suggest that the five should be doubled (multiplied by two) giving ten for the result. In its written form this appears as follows:
It looks as though the two has crossed over the = symbol and its sign changed from division to multiplication, as the pupils suggested. Again the written form reflects the pupils’ way of thinking.
Almost incidentally, the pupils have derived for themselves a rule (a mnemonic), which is easily remembered as:
Although there is insufficient space here to demonstrate further examples, this is the rule pupils will usually carry with them throughout their mathematical careers, no matter how far they advance in the study of equations, and they will remember it all the better because they have understood it by having related it to a multisensory experience.
Teaching the Other Parts of the Curriculum
Some examples of other topics from a typical maths curriculum are explained. They often involve arithmetic still, but in different contexts.
Using and applying mathematics
Two uses for this kind of work are dealt with in this chapter. The work helps by combining different skills and knowledge from different mathematical areas. The other use is in investigations, where children examine a new piece of curricular work and derive a hypothesis for themselves. This use is not as daunting for the children as it sounds, particularly if careful and empathetic guidance is given.
The first example is the angle‐sum of a triangle. This can start with a class activity where each child in the class draws a triangle, measures the angles and adds them up, then the result will be about 180o for all those who have not made a gross error. The gross errors might include mistakes in addition, or use of the wrong scale on the protractor. Once these have been corrected, there should be enough answers just above 180° to balance those just below 180o and persuade the children that 180o is the right answer. If the triangles are of many different shapes, then this will confirm the universal application of the result.
A more difficult, though related, example concerns the angle‐sum for any polygon. This used to be taught as 2n − 4 right angles, which is a difficult formula to remember and employs less familiar units. When asked to investigate this polygon problem, instead of being given the formula, children might need the hint that they should divide the polygon into triangles (preferably all from one corner). If they all draw several polygons, they can be guided to the generalisation that you can always draw two triangles less than the number of sides of the polygon.
For the pentagon in Figure 16.4, this would be 5 − 2 = 3 triangles. From what they already know, children would be able to work this out as 3 × 180o = 540o. Having worked on the theory for themselves, they are more likely to have understood it. They are also more likely to remember it, either using the easier formula (n − 2) × 180°, or in a form of words like ‘two triangles less than the size’, or simply resolving always to divide their polygons into as many triangles as it takes.
Figure 16.4 A pentagon divided as three triangles.
Algebra
It can be argued that for older children a significant portion of the study of mathematics involves not so much of an intellectual challenge as the acceptance and acquisition of conventions of mathematical syntax. Nowhere is this truer than in algebra. Of course, effective acquisition and retention requires thorough explanation and practice of every possible type of problem, based on understanding.
Two areas of major importance within algebra concern formulae and equations (Kitz and Nash, 1995).
Children will be expected to be able to derive formulae for simple situations. This is the skill of generalising. They will subsequently be expected to substitute values into given formulae, often to ‘find’ an unknown number. Algebra is often about generalising and finding. Many people only associate it with ‘finding’.
When a problem finishes with a formula, for example, a + b + c as the perimeter of the triangle in Figure 16.5, there are children who will be dissatisfied, based on their previous experiences in maths, with the lack of a numerical answer.
Figure 16.5 The perimeter of a triangle: a + b + c.
They can usually be convinced by the argument that a formula is an ‘instruction’ or a ‘generalisation’ about what to do when the values of a, b and c become known. In this sense a formula is superior because it applies to every triangle, while a numerical answer is only correct for one specific triangle. It is a generalisation for all triangles.
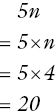
Example y = 5n
In this example, 5n represents ‘5 times n’, even though the multiplication sign is not shown (another one of the perceived inconsistencies of maths). If the question is to substitute n = 4 into the formula 5n, then the multiplication sign should be included before the substitution takes place, otherwise the common incorrect answer, 54, may be generated.
Children often ask why the multiplication sign is missed out, and a range of reasons can be given, including the fact that it resembles the letter x too closely or that we say ‘five pounds’ rather than ‘five times a pound’ in everyday language or that it simply saves effort.
Example y = 3n2
Children substituting y = 2 into the formula 3n2 can produce the incorrect answer 36, especially with casual use of certain calculators. What they have computed is (3 × 2)2 rather than 3 × (2)2. The ‘squared’ applies only to the n and not to the three.
An earlier passage described how to arrive at the rule for solving equations. There are further problems implementing the rule. At the beginning of the work on this topic, the numbers in an equation must be kept simple to avoid clouding the main issue, that is, understanding algebra. They allow the student to focus on the procedure and not be blocked by the computations. However, some children confronted with the equation x + 3 = 8 will often rush to guess the answer 5, and then be unhappy when their teacher insists (appearing pedantic) that they must set out all the steps properly. Ironically, using simple numbers can limit the children’s acceptance of the need for a careful procedure. It is necessary to convince them that the need will soon increase, and one way is to show them an equation, such as 31.2x − x(2.5 − x) = 0.654, which they cannot solve mentally but may have to solve in later years. This can be followed up by adopting the motto: ‘Look after your equations when they are young, and they will look after you, when you are older.’
Shape and space
Application of the Test of Cognitive Style in Mathematics (Chinn, 2017a) has indicated that the mathematical style adopted in this branch of the subject, which covers topics such as angles, volume and symmetry, can be different from the style adopted for arithmetic.
Furthermore, the misconceptions experienced by dyslexics and dyscalculics in this branch can produce some of the most confusing mistakes. For example, we have met children who argue long and hard that in the diagram in Figure 16.6 ‘y = 40, because both angles are the same’.
Figure 16.6 Angles on a straight line add to make 180°.
Our discussions about this with children have shown that the misconception seemed to derive from the perception that both angles were formed with the same pair of straight lines.
Handling data
The calculation of means, medians and modes always seems to be a very numerical process. Pie charts and histograms require visual presentations as well as numerical work. For example, we felt that dealing graphically with a table full of coordinates (from a quadratic equation, for example) is an example of handling and presenting data. The graph in Figure 16.7 for squares and square roots is such an example.
When covering squares and square roots, a curved graph may be plotted for the easy, whole number square root values (x) and the single digit whole number square values (y) in Table 16.1.
Table 16.1 Table of values for y = x 2.
| x | 0 | 1 | 2 | 3 | 4 | 5 | 6 | 7 | 8 | 9 | 10 |
| y | 0 | 1 | 4 | 9 | 16 | 25 | 36 | 49 | 64 | 81 | 100 |
When read from one scale to the curve and then from the curve to the other scale, the graph can provide much more data than the list of values. Broken lines on the graph show how this is done. Additional data is obtainable in at least two ways.
Figure 16.7 The graph for y = x2.
- Reading from the x scale to the y scale gives squares, while reading from the y scale to the x scale gives square roots. In view of this dual capability, the graph is providing one of the best ways to demonstrate that squaring and extracting the square root are opposite processes.
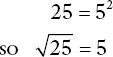
- Between the 11 plotted points, the curve contains an infinite number of other points, which may be used for values between those in Table 16.1. For instance, one of the broken lines shows that 6.72 = 45 to the nearest whole number and another shows that
 correct to one decimal place.
Combining the Parts of the Curriculum
This final section contains a short series of examples that increase in complexity, to show how different parts of maths combine. Arithmetic is a frequent contributor.
Examples 16.8.a and b
Addition in two digits can be illustrated by putting that operation in the context of combining of angles, as, for example, those shown in Figure 16.8a.
The idea of combining angles can be extended to the case where angles are represented by letters (Figure 16.8b). It should be a small increase in level of difficulty for children to add the above angles and obtain x + 35. It is also an option to create the equation x + 35 = 90, since the outer angle has been chosen as a right angle.

Figure 16.8 Working with angles.
Example 16.8.c
When children are practising subtraction of hundreds, tens and units, its application to an example such as that in Figure 16.8c can provide context and motivation.
Example 16.9
Sometimes a carefully chosen example from one part of the curriculum can help children to derive or confirm rules for another. If the topic of perimeter has been studied, the diagram in Figure 16.9 could lead to more topics.

Figure 16.9 ‘Finding’ x.
If asked, ‘How would you find a value for x?’ many children would have no difficulty in deciding that the sides with given values should be added, and the total subtracted from 20.
A written version of the problem and its solution:
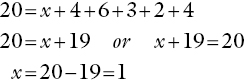
This illustrates how a quite difficult equation should be solved, and uses the rule derived earlier in this chapter.
Example 16.10
Figure 16.10 ‘Finding’ x.
The problem illustrated in Figure 16.10 can be regarded as a spatial problem. The calculation of the missing angle can be performed numerically, as 180 − 70, or interpreted algebraically in the form of the equation x + 70 = 180. An estimate would suggest an answer above 100.
If the problem was generalised to that shown in Figure 16.11 and the value of x was allowed to vary, between 0 and 180, then the corresponding values of y could be tabulated against it, as shown in Table 16.2.
Figure 16.11 Working out the relationship between x° and y°.
Table 16.2 Table of values for y = 180 – x.
| x | 0 | 20 | 40 | 60 | 80 | 100 | 120 | 140 | 160 | 180 |
| y | 180 | 160 | 140 | 120 | 100 | 80 | 60 | 40 | 20 | 0 |
Table 16.2 shows all possible pairs of values, for multiples of 20 that could be generated from the relationship y = 180 − x. The graph in Figure 16.12 shows a backwards‐sloping straight line, which can be used to show every possible pair of values, and thereby demonstrate the problem‐solving power of graphs.

Figure 16.12 The graph for x + y = 180.
Work on using and applying mathematics can, as mentioned earlier, bring together many parts of the curriculum.
An investigative and speculative example
Investigating the question, ‘Could a person walk a million miles?’ turns a child’s thoughts to distances and time, and requires him to make various judgements and estimates. The thoughts on time could range from how many minutes to eat a meal, through hours for sleep, how many days for a holiday, weeks, months and years, to decades and centuries. He may wonder how many times you would need to go around the world to travel a million miles or if it is a million miles to the moon. He will have to make judgements about how long the person would live and their walking speed or how far they could reasonably be expected to walk in a day. Children with a poor sense of quantity can give estimates that show wild misconceptions, which can then be discussed very profitably.
An example of a maths challenge
Using a challenge for a child to draw a square and a circle with the same area is an example of meta‐cognition. If a child chooses a radius, draws a circle first and works out its area, then to draw the square only requires him to take the square root of this area to find the length of the square’s sides. This exercise involves choosing a radius and drawing a circle, remembering and evaluating the formula for the area of a circle, reversing the formula for the area of a square to obtain the length of its sides, and then drawing the square. Should the child draw the square first he will have a considerably more difficult task reversing the formula for the area of the circle, but that is part of the learning experience students get from challenges.
Summary
The purpose of this chapter has been to argue the importance of a structure that organises the widest possible range of mathematical experiences for dyslexic and dyscalculic children. While complete coverage of this topic would take several books, the chapter covers some general principles and includes some illustrative examples.