Chapter 9. Fine-Tuning the Project Plan

In this chapter, you will learn how to: | |
✓ | Look at how resources are scheduled to work over the duration of a project. |
✓ | Edit a resource assignment to resolve a resource overallocation. |
✓ | Resolve resource overallocations automatically. |
✓ | See detailed and overall project costs. |
✓ | See tasks on the critical path that determines a project’s finish date. |
Tip
Do you need only a quick refresher on the topics in this chapter? See the Quick Reference entries in Fine-Tuning the Project Plan.
In the previous two chapters, you have focused on details about tasks, resources, and assignments. Now, you will examine the results of your previous work on the schedule and dive deeper into resource assignments. You’ll also observe the overall project duration and cost, as well as the sequence of tasks that determine its finish date.
Important
Before you can use the practice files provided for this chapter, you need to install them from the book’s companion CD to their default locations. See "Using the Book’s CD" for more information.
Examining Resource Allocations over Time
In this exercise, you will focus on resource allocation—how the task assignments you’ve made affect the workloads of the work resources (people and equipment) of a project. The relationship between a resource’s capacity and his or her task assignments is called allocation. Each work resource is in one of three states of allocation:
Underallocated. The resource’s assignments do not fill the resource’s maximum capacity. For example, a full-time resource who has only 25 hours of work assigned in a 40-hour work week is underallocated.
Fully allocated. The resource’s assignments fill the resource’s maximum capacity. For example, a full-time resource who has 40 hours of work assigned in a 40-hour work week is fully allocated.
Overallocated. The resource’s assignments exceed the resource’s maximum capacity. For example, a full-time resource who has 65 hours of work assigned in a 40-hour work week is overallocated.
In Microsoft Office Project 2007, a resource’s capacity to work is measured in units; the maximum capacity of a given resource is called maximum units. Units are measured either as numbers (such as three units) or as a percentage (such as 300% units).
Important
Concerning the scheduling engine in Project, cost and material resources do not do work; therefore, their assignments do not affect the overall duration of a project (although both cost and material resources can of course affect the overall cost of a project). When we focus on resource allocation, we mean work resources: people and equipment that do the work of a project.
In this exercise, you look at resource allocations and focus on two resources who are overallocated.
Important
If you are running Project Professional, you may need to make a one-time adjustment to use the Computer account and to work offline. This ensures that the practice files you work with in this chapter do not affect your Project Server data. For more information, see "Starting Project Professional“.
Note
OPEN Short Film Project 9a from the DocumentsMicrosoft PressProject 2007 SBSChapter 9 Advanced Plan folder. You can also access the practice files for this book by clicking Start, All Programs, Microsoft Press, Project 2007 Step by Step, and then selecting the chapter folder of the file you want to open.
On the File menu, click Save As.
The Save As dialog box appears.
In the File name box, type Short Film Project 9, and then click Save.
On the View menu, click More Views, click Resource Allocation, and then click the Apply button.
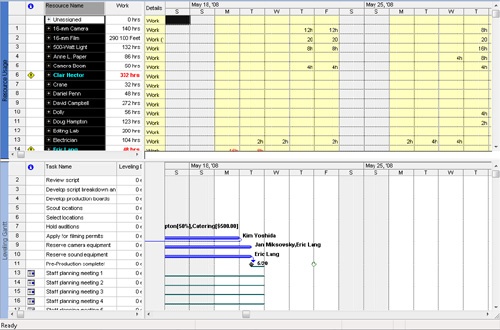
The Resource Allocation view appears. This is a split view, with the Resource Usage view on top and the Leveling Gantt Chart view on the bottom.
On the left side of the Resource Usage view is a table (the Usage table, by default) that shows assignments grouped per resource, the total work assigned to each resource, and each assignment’s work. This information is organized into an outline that you can expand or collapse.
The right side of the view contains assignment details (work, by default) arranged on a timescale. You can scroll the timescale horizontally to see different time periods. You can also change the tiers on the timescale to display data in units of weeks, days, hours, and so on.
The bottom pane shows the Leveling Gantt Chart view only for whatever resource or assignment (single or multiple) is selected in the upper pane.
On the Standard toolbar, click the Scroll To Task button.
Project scrolls the right side of the view to show some assignment details.
Next, you will collapse the outline in the table to see total work per resource over time.
Click the Resource Name column heading.
On the Project menu, point to Outline and then click Hide Assignments.
Project collapses the outline (assignments per resource) in the Resource Usage view. Resource assignments are hidden in the Usage table, and the resources’ total work values over time appear in the timescaled grid on the right.
Tip
Notice the name of the first resource, Unassigned. This resource lists all tasks to which no specific resources are assigned.
Next, you will look at two work resources and their allocations.
In the Resource Name column, click the name of resource 4, Anne L. Paper.
On the Standard toolbar, click Scroll To Task.
Project scrolls the timescaled grid to show Anne L. Paper’s earliest assignment on Wednesday.
Point to the W column heading (for Wednesday) at the top of the timescaled grid.
A ScreenTip appears with the date of the assignment: 5/28/08. Such ScreenTips are handy in any timescaled view, such as the Resource Usage view or the Gantt Chart view.
Currently, the timescale is set to display weeks in the middle tier and days in the bottom tier. You will now change the timescale to see the work data summarized more broadly.
On the Format menu, click Timescale.
Tip
You can also double-click or right-click on the timescale and select Timescale from the shortcut menu.
The Timescale dialog box appears.
The timescale can display up to three tiers, typically in descending order of detail, such as years, months, and days. However, the top tier is disabled by default.
Make sure that the Middle Tier tab is selected, and in the Units box under Middle tier formatting, click Months.
In the Show box under Timescale options, click One tier (Middle).
Click OK to close the Timescale dialog box.
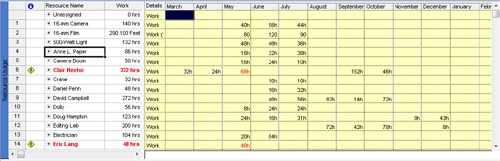
Project changes the timescaled grid to show work values per month.
As you can see in the timescaled grid, Anne L. Paper is underallocated in each of the three months in which she has assignments in the project: May, June, and July. Anne is one of the actors assigned to the scenes in which her character is needed, so this underallocation is really not a problem you need to address.
Notice that the names of Clair Hector and other resources appear in red. The red formatting means that these resources are overallocated: at one or more points in the schedule, their assigned tasks exceed their capacity to work. In the timescaled grid notice that Clair’s 68 hours in May is formatted in red. Even though 68 hours within a month isn’t an overallocation, at some point in May (perhaps even for just one day) Clair is scheduled to work more hours than she can accommodate.
You will focus in on Clair Hector first by changing the timescale settings.
On the Edit menu, click Undo Timescale Edit.
Project resets the timescale back to its previous setting.
In the Resource Name column, click the name of resource 6, Clair Hector.
On the Standard toolbar, click Scroll To Task.
Project scrolls the timescaled grid to show Clair Hector’s earliest assignments. It appears that Clair has no overallocations.
Click the plus sign next to Clair Hector’s name in the Resource Name column.
Project expands the Resource Usage view to show Clair Hector’s individual assignments.
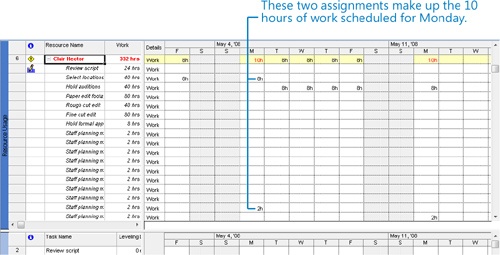
Scroll the Resource Usage view to the right to see both of Clair’s assignments on Monday, May 5. Use the horizontal scroll bar at the bottom of the Project window.
Clair’s total work that Monday, 10 hours, is formatted red, indicating the overallocation. Clair has two assignments on May 5: the two-hour task Staff planning meeting 9 (one instance of a recurring task) and the eight-hour task Select locations. If necessary, drag the horizontal divider bar down to show more of the Resource Usage view.
These two tasks have been scheduled at times that overlap between the hours of 8 A.M. and 10 A.M. (If you want to observe this, format the timescale to display days in the middle tier and hours in the bottom tier.) This is a real overallocation: Clair probably cannot complete both tasks simultaneously. However, it is a relatively minor overallocation given the scope of the project, and you don’t need to be too concerned about resolving this level of overallocation. However, there are other, more serious overallocations in the schedule that you will remedy later in this chapter.


Here are a few other things to keep in mind when viewing resource allocation:
By default, the Resource Usage view displays the Usage table; however, you can display different tables. On the View menu, click Table: Usage, and then click the table you want displayed.
By default, the Resource Usage view displays work values in the timescaled grid. However, you can display additional assignment values, such as cost and remaining availability. On the Format menu, point to Details, and then click the value you want displayed. To add to or customize the appearance of fields displayed in the Resource Usage view, click Detail Styles on the Format menu.
Instead of using the Timescale command on the Format menu to change the tiers of the timescale, you can click the Zoom In and Zoom Out buttons on the Standard toolbar. However, this method might not produce the exact level of detail you want. If it does not, use the Timescale command on the Format menu.
To see allocations for each resource graphed against a timescale, you can display the Resource Graph view by clicking the Resource Graph command on the View menu. Use the arrow keys or horizontal scroll bar to switch between resources in this view.
The Resource Management toolbar contains a handy collection of buttons when you’re looking at allocation issues, leveling resources, or performing other common activities that relate to resources. This toolbar is hidden by default. To display it, on the View menu, point to Toolbars and then click Resource Management.
Manually Resolving Resource Overallocations
In this exercise and the next, you will continue to focus on resource allocation—how the task assignments you have made affect the workloads of the work resources (people and equipment) of the project. In this exercise, you will manually edit an assignment to resolve a resource overallocation. In the next exercise, you will automatically resolve resource overallocations.
Manually editing an assignment is just one way to resolve a resource overallocation. Other solutions include the following:
Replace the overallocated resource with another resource using the Replace button in the Assign Resources dialog box.
Reduce the value in the Units field in the Assignment Information or Assign Resources dialog box.
Assign an additional resource to the task so that both resources share the work.
If the overallocation is not too severe (such as assigning 10 hours of work in a normal eight-hour workday), you can often leave the overallocation in the schedule.
In this exercise, you will use the Resource Allocation view to examine one overallocated resource’s assignments and edit the assignment to eliminate the overallocation.
In the Resource Usage view in the upper pane, scroll vertically through the Resource Name column.
Note that several names appear in red. These are overallocated resources.
In the Resource Name column, click the plus sign next to the name of resource 14, Eric Lang, to display his assignments.
On the Standard toolbar, click Scroll To Task.
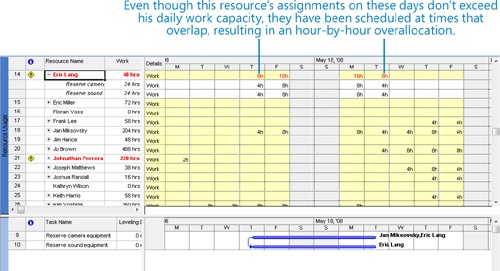
In the upper pane, you see that Eric is assigned full-time to two tasks that both start on Thursday, May 15. He is overallocated for the duration of both tasks. In the lower pane, you see the Gantt bars for the specific tasks that have caused Eric to be overallocated on these days. For tasks 9 and 10, Eric is assigned eight hours of work on each task Friday and Monday. This results in 16 hours of work per day, which is beyond Eric’s capacity to work.
You might also notice that Eric is assigned a total of eight hours of work on Thursday and then again on the following Tuesday. These values also appear in red, indicating that Eric is overallocated on those days as well. This is because the two tasks are scheduled to start at the same time on Thursday and end at the same time on Tuesday. Thus, even though Eric has a total of eight hours of work assigned on Thursday and Tuesday, he really has two four-hour assignments in parallel. This is an overallocation.
Next, you will manually resolve this overallocation by reducing the assignment units value.
In the Resource Name column, click Eric’s first assignment, Reserve camera equipment.
On the Standard toolbar, click the Assignment Information button.
The Assignment Information dialog box appears.
Click the General tab if it is not already visible.
In the Units box, type or click 50%, and then click OK to close the Assignment Information dialog box.
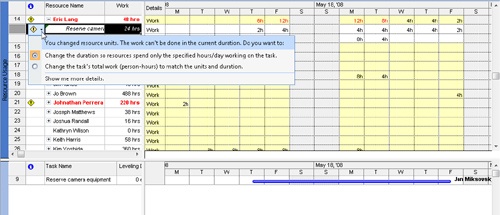
Eric’s daily work assignments on this task are reduced to two or four hours per day, but the task duration increased. You’d like to reduce the work but not extend the duration of the task. Note the Smart Tag indicator that appears next to the name of the assignment. You will use the Smart Tag to change the scheduling effect of the new assignment units.
Click the Smart Tag Actions button.
Look over the options on the list that appears.
On the Smart Tag Actions list, click Change the task’s total work (person-hours) to match the units and duration.
Project reduces Eric’s work assignments on the task and restores the task to its original duration.
However, Eric is still overallocated. To remedy this, you will reduce his assignment units on the second task.
In the Resource Name column, click Eric’s second assignment, Reserve sound equipment.
On the Standard toolbar, click Assignment Information.
The Assignment Information dialog box appears.
Click the General tab if it is not already visible.
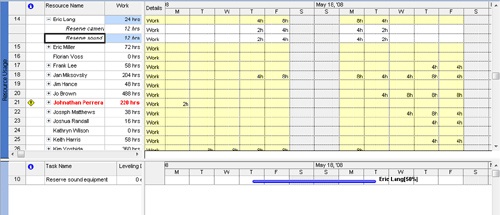
In the Units box, type or click 50%, and then click OK to close the Assignment Information dialog box.
Click Smart Tag Actions.
On the Smart Tag Actions list, click Change the task’s total work (person-hours) to match the units and duration.
Eric’s total assignments on Friday and Monday are now reduced to eight hours each day. He is fully allocated on these days. By manually editing Eric’s assignments to reduce his work on these days, you have resolved his overallocation. However, the manner in which you resolved Eric’s overallocation was not the most direct method. You could also have edited his assignment values for Friday and Monday directly in the timescaled grid from eight to four hours each. The end result would have been the same.


Eric’s overallocation on tasks 9 and 10 is a good example of the type of problem automatic leveling (described in the following section) cannot resolve. Automatic leveling can do many things to a schedule, but it cannot change resource assignment units as you did here or change assignment work. You should apply your best judgment to determine where automatic leveling can help and where you may need to manually adjust the schedule to resolve overallocations.
Next, you will look at other resource overallocations in the short film project that you can resolve automatically with resource leveling.
Leveling Overallocated Resources
In the previous section, you read about resource allocation, discovered what causes overallocation, and manually resolved an overallocation. Resource leveling is the process of delaying or splitting a resource’s work on a task to resolve an overallocation. The options in the Level Resources dialog box enable you to set parameters concerning how you want Project to resolve resource overallocations. Project will attempt to resolve such overallocations when you choose to level resources. Depending on the options you choose, this might involve delaying the start date of an assignment or task or splitting the work on the task.
Important
Although the effects of resource leveling on a schedule might be significant, resource leveling never changes who is assigned to tasks nor the total work or assignment unit values of those assignments.
For example, consider the following tasks, all of which have the same full-time resource assigned.
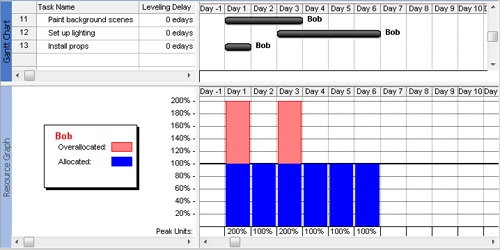
In this split view, the Resource Graph view appears below the Gantt Chart view. On day 1, the resource is overallocated at 200%. On day 2, the resource is fully allocated at 100%. On day 3, he is again overallocated at 200%. After day 3, the resource is fully allocated at 100%.
When you perform resource leveling, Project delays the start dates of the second and third tasks so that the resource is not overallocated.
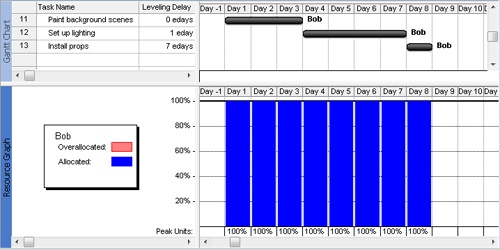
Note that the finish date of the latest task has moved from day 6 to day 8. This is common with resource leveling, which often pushes out the project finish date. There was a total of eight days of work before leveling, but two of those days overlapped, causing the resource to be overallocated on those days. After leveling, all eight days of work are still there, but the resource is no longer overallocated.
Resource leveling is a powerful tool, but it accomplishes only a few basic things: it delays tasks, splits tasks, and delays resource assignments. It does this following a fairly complex set of rules and options that you specify in the Resource Leveling dialog box. (These options are explained in the following exercise.) Resource leveling is a great fine-tuning tool, but it cannot replace your good judgment about resource availability, task durations, relationships, and constraints. Resource leveling will work with all of this information as it is entered into your project plan, but it might not be possible to fully resolve all resource overallocations within the time frame desired unless you change some of the basic task and resource values in the project plan.
Tip
To learn more about resource leveling, type Level resource assignments into the Search box in the upper right corner of the Project window.
In this exercise, you level resources and view the effects on assignments and the project finish date.
On the Window menu, click Remove Split.
On the View menu, click Resource Sheet.
The Resource Sheet view appears. Note that several resource names appear in red and display the Overallocated icon in the Indicators column.
On the Tools menu, click Level Resources.
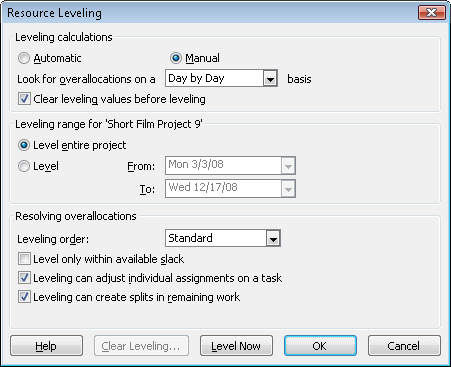
The Resource Leveling dialog box appears. In the next several steps, you will walk through the options in this dialog box.
Under Leveling calculations, make sure that Manual is selected.
These settings determine whether Project levels resources constantly (Automatic) or only when you tell it to (Manual). Automatic leveling occurs as soon as a resource becomes overallocated.
Tip
All settings in the Resource Leveling dialog box apply to all project plans that you work with in Project, not only to the active project plan. Using automatic leveling might sound tempting, but it will cause frequent adjustments to project plans whether you want them or not. For that reason, we recommend you keep this setting on Manual.
In the Look for overallocations on a ... basis box, make sure that Day by Day is selected.
This setting determines the time frame in which Project will look for overallocations. If a resource is overallocated, its name will be formatted in red. If it’s overallocated at the level you choose here, Project will also show the Overallocated indicator next to its name.
Tip
On most projects, leveling in finer detail than day by day can result in unrealistically precise adjustments to assignments. If you prefer not to see overallocation indicators for day-by-day overallocations, select Week by Week in the Look for overallocations on a ... basis and then click OK. Doing so will not level resources, but it will determine when Project displays overallocation indicators next to resource names.
Make sure that the Clear leveling values before leveling check box is selected.
Sometimes you will need to level resources repeatedly to obtain the results you want. For example, you might initially attempt to level week by week and then switch to day by day. If the Clear Leveling Values Before Leveling check box is selected, Project removes any existing leveling delays from all tasks and assignments before leveling. For example, if you previously leveled the project plan and then added more assignments, you might clear this check box before leveling again so that you wouldn’t lose the previous leveling results.
Under Leveling range for ‘Short Film Project 9’, make sure that Level entire project is selected.
Here you choose to level either the entire project or only those assignments that fall within a date range you specify. Leveling within a date range is most useful after you have started tracking actual work and you want to level only the remaining assignments in a project.
In the Leveling order box, make sure that Standard is selected.
You control the priority Project uses to determine which tasks it should delay to resolve a resource conflict. The ID Only option delays tasks only according to their ID numbers: numerically higher ID numbers (for example, 10) will be delayed before numerically lower ID numbers (for example, 5). You might want to use this option when your project plan has no task relationships or constraints. The Standard option delays tasks according to predecessor relationships, start dates, task constraints, slack, priority, and IDs. The Priority, Standard option looks at the task priority value before the other standard criteria. (Task priority is a numeric ranking between 0 and 1000 that indicates the task’s appropriateness for leveling. Tasks with the lowest priority are delayed or split first.)
Make sure that the Level only within available slack check box is cleared.
Tip
Remember that to clear a check box means to remove a check from the check box and to select a check box means to put a check in it. You toggle the selection state of a check box by clicking it.
Clearing this check box allows Project to extend the project’s finish date, if necessary, to resolve resource allocations.
Selecting this check box would prevent Project from extending the project’s finish date to resolve resource overallocations. Instead, Project would use only the free slack within the existing schedule. Depending on the project, this might not be adequate to fully resolve resource overallocations.
Make sure that the Leveling can adjust individual assignments on a task check box is selected.
This allows Project to add leveling delay (or split work on assignments if Leveling Can Create Splits In Remaining Work is also selected) independently of any other resources assigned to the same task. This might cause resources to start and finish work on a task at different times.
Make sure that the Leveling can create splits in remaining work check box is selected.
This allows Project to split work on a task (or on an assignment if Leveling Can Adjust Individual Assignments On A Task is also selected) as a way of resolving an overallocation.
Tip
This tip describes enterprise project management (EPM) functionality. If you are running Project Professional, you will see an additional check box, Level Resources With The Proposed Booking Type. Leave this check box cleared. For more information about Project Server, see Part 4.
Click the Level Now button.
Project asks whether you want to level the entire pool or only selected resources. Leave Entire Pool selected, and click OK.
Project levels the overallocated resources.
Notice that the Overallocated indicators are gone.
Tip
When leveling resources with Day By Day selected, you might see the overallocation icons disappear while some resource names still appear in red. This means that some resources are still overallocated hour by hour (or minute by minute), but not day by day.
Next, you will look at the project plan before and after leveling by using the Leveling Gantt view.
On the View menu, click More Views, click Leveling Gantt, and then click Apply.
Project switches to the Leveling Gantt view.
Click the name of task 8, Apply for filming permits.
On the Standard toolbar, click Scroll To Task.
This view gives you a better look at some of the tasks that were affected by leveling.
Notice that each task now has two bars. The green bar on top represents the preleveled task. You can see a task’s preleveled start, finish, and duration by pointing to a green bar. The blue bar on the bottom represents the leveled task.


Project was able to resolve the resource overallocations. For this particular project, leveling pushed out the project finish date by two days.
Examining Project Costs
Not all project plans include cost information, but for those that do, keeping track of project costs can be as important as or more important than keeping track of the scheduled finish date. Two factors to consider when examining project costs are the specific types of costs you want to see and how you can best see them.
The types of costs you might encounter over the life of a project include the following:
Baseline costs. The original planned task, resource, or assignment costs saved as part of a baseline plan.
Current (or scheduled) costs. The calculated costs of tasks, resources, and assignments in a project plan. As you make adjustments in a project plan, such as assigning or removing resources, Project recalculates current costs just as it recalculates task start and finish dates. After you start to incur actual costs (typically by tracking actual work), the current cost equals the actual cost plus remaining cost per task, resource, or assignment. Current costs are the values you see in fields labeled Cost or Total Cost.
Actual costs. The costs that have been incurred for tasks, resources, or assignments.
Remaining costs. The difference between the current or scheduled costs and the actual costs for tasks, resources, or assignments.
You might need to compare these costs (for example, baseline vs. actual) or examine them individually per task, resource, or assignment. Or you might need to examine cost values for summary tasks or for an entire project plan. Some common ways to view these types of costs include the following:
You can see the entire project’s current, baseline, actual, and remaining costs in the Project Statistics dialog box (on the Project menu, click Project Information, and then click Statistics).
You can see or print formatted reports that include cash flow, budget, overbudget tasks or resources, and earned value (on the Report menu, click Reports or Visual Reports).
Tip
Earned value is a powerful schedule analysis tool that relies on cost information in a project plan. For more information, see Chapter 18.
You can see task-, resource-, or assignment-level cost information in usage views by displaying the Cost table (on the View menu, point to Table: Entry, and then click Cost).
Tip
When printing usage views, you can include cost totals. You can include row totals when printing date ranges from a usage view (on the File menu, click Page Setup, and in the Page Setup dialog box, click the View tab and select the Print Row Totals For Values Within Print Date Range check box). You can also include column totals in usage views (on the File menu, click Page Setup; in the Page Setup dialog box, click the View tab and select the Print Column Totals check box).
In this exercise, you look at the overall project costs and at individual task costs.
On the View menu, click More Views, click Task Sheet, and then click Apply.
Project switches to the Task Sheet view. Next, you will display the project summary task to see the top-level or rolled-up values of the project.
On the Tools menu, click Options.
In the Options dialog box, click the View tab if it is not already visible.
Under the Outline options for label, select the Show project summary task check box, and then click OK.
Project displays the project summary task at the top of the Task Sheet view. Next, you will switch to the Cost table.
Tip
Wonder where Project got this project summary task name? Project uses the title entered in the Properties dialog box (File menu) as the project summary task name. Or, if nobody has entered a distinct title property, Project uses the filename as the project summary task name. If you change the project summary task once you’ve displayed it, Project updates the Title property and vice versa.
On the View menu, point to Table: Entry, and click Cost.
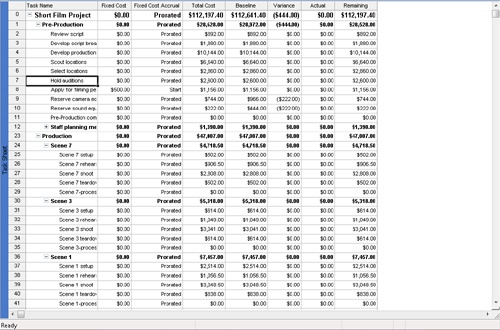
The Cost table appears.
If necessary, double-click the right edge of a column in the column heading to expand the column so that you can see the entire value.
Here you can see many types of cost values for the overall project, project phases (summary tasks), and individual tasks. At this point in the project life cycle, the project plan includes a baseline; therefore, you see values in the Baseline column. Some assignment adjustments were made earlier in this chapter, so you see some values in the Variance column; however, because it does not yet contain any actual progress, the Actual column contains only zero values.
Checking the Project’s Finish Date
A project’s finish date is a function of its duration and start date. Most projects have a desired, or soft, finish date, and many projects have a “must hit,” or hard, finish date. When managing projects like these, it is essential that you know the project’s current or scheduled finish date and understand how the adjustments you make in the planning stage affect the finish date.
In the language of project management, a project’s finish date is determined by its critical path. The critical path is the series of tasks that will push out the project’s end date if the tasks are delayed. For this reason, when evaluating the duration of a project, you should focus mainly on the tasks on the critical path, called critical tasks.
Tip
Remember that the word critical has nothing to do with how important these tasks are to the overall project. The word refers only to how their scheduling will affect the project’s finish date.
In this exercise, you look at the project’s finish date and critical path.
On the Project menu, click Project Information.
The Project Information dialog box appears.
Tip
This tip describes enterprise project management (EPM) functionality. If you are running Project Professional, you will see a slightly different dialog box. The Project Information dialog box in Project Professional includes an Enterprise Custom Fields section. Enterprise custom fields are used only with Project Server. For more information about Project Server, see Part 4.
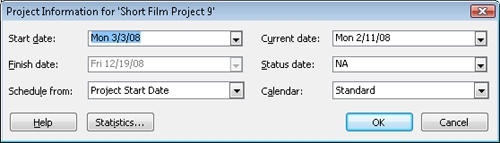
In the Project Information dialog box, you can see the current or scheduled finish date for the project: December 19, 2008. Note that you can edit the start date of the project here, but not its finish date. Project has calculated this finish date based on the start date plus the overall duration of the project. This project is scheduled from the start date, as the Schedule From box indicates. You might want to schedule a project from a finish date in some situations, in which case you enter the finish date and task information and Project calculates the start date.
Tip
It might sound tempting to schedule a project from a finish date, especially if it has a hard “must-hit” deadline. However, in nearly all cases, you should resist this temptation and instead schedule from a start date.
Next, you will look at the duration values for this project.
In the Project Information dialog box, click the Statistics button.
The Project Statistics dialog box appears.
Here you can see the project’s current, baseline, and actual start and finish dates, as well as its schedule variance.
This project currently has no actual work reported, so you see NA in the Actual Start and Actual Finish fields and zero values in the Actual Duration and Actual Work fields.
Click Close to close the Project Statistics dialog box. To conclude this exercise, you will look at the critical path.
On the View menu, click More Views, click Detail Gantt, and then click Apply.
The Detail Gantt view replaces the Task Sheet view.
On the Edit menu, click Go To.
In the ID box, type 42, and then click OK.
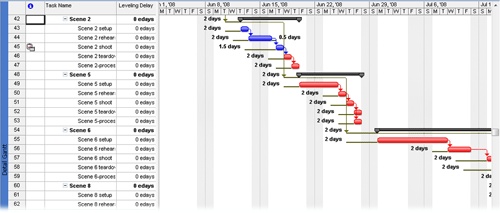
Project scrolls the view to show task 42, the Scene 2 summary task.
Here you can see both critical tasks (their Gantt bars are red) and noncritical tasks (blue). Any changes to the durations or timing of critical tasks will affect the project finish date. However, changes to the noncritical tasks won’t necessarily affect the project finish date, depending on available slack. When you make adjustments to the project plan, and especially after you start tracking actual work, the specific tasks on the critical path are likely to change. For this reason, you should frequently check the project finish date and the critical tasks that determine it.

Key Points
A work resource’s maximum units (Max. Units) value determines when the resource becomes overallocated.
The Resource Usage view enables you to view the details of assignments that cause resource overallocation.
You can manually or automatically resolve resource overallocations.
When editing a resource assignment value (such as assignment units), you can use a Smart Tag to change the scheduling effect of your action.
You can view cost details from the individual assignment level all the way to the entire project level.
The tasks on the critical path determine the project finish date.