Chapter 6. Tracking Progress on Tasks
In this chapter, you will learn how to: | |
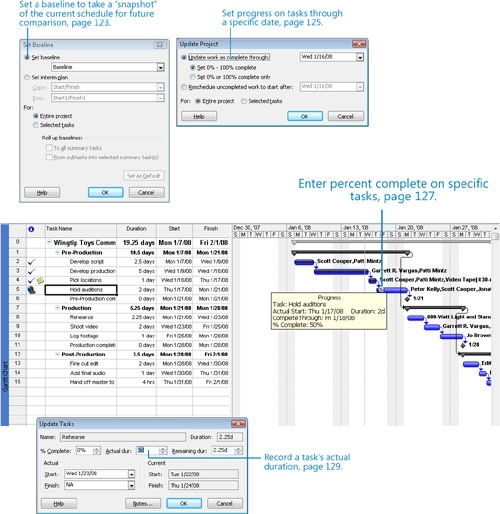
✓ | Save current values in a schedule as a baseline. |
✓ | Record progress on tasks through a specific date. |
✓ | Record a task’s percentage of completion. |
✓ | Enter actual work and duration values for tasks. |
Tip
Do you need only a quick refresher on the topics in this chapter? See the Quick Reference entries in Tracking Progress on Tasks.
Until now, you have focused on project planning—developing and communicating the details of a project before actual work begins. When work begins, so does the next phase of project management: tracking progress. Tracking means recording project details such as who did what work, when the work was done, and at what cost. These details are often called actuals.
Tracking actuals is essential to properly managing, as opposed to just planning, a project. The project manager must know how well the project team is performing and when to take corrective action. Properly tracking project performance and comparing it with the original plan allows you to answer such questions as these:
Are tasks starting and finishing as planned? If not, what will be the impact on the project’s finish date?
Are resources spending more or less time than planned to complete tasks?
Are higher-than-anticipated task costs driving up the overall cost of the project?
Microsoft Office Project 2007 supports several ways to track progress. Your choice of a tracking method should depend on the level of detail or control required by you, your project sponsor, and other stakeholders. Tracking the fine details of a project requires additional work from you and possibly from the resources working on the project.
Therefore, before you begin tracking progress, you should determine the level of detail you need. The different levels of tracking detail include the following:
Record project work as scheduled. This level works best if everything in the project occurs exactly as planned. Hey, it could happen!
Record each task’s percentage of completion, either at precise values or at increments such as 25, 50, 75, or 100%.
Record the actual start, actual finish, actual work, and actual and remaining duration for each task or assignment.
Track assignment-level work by time period. This is the most detailed level of tracking. Here you record actual work values per day, week, or other interval.
Because different portions of a project might have different tracking needs, you might need to apply a combination of these approaches within a single project. For example, you might want to track high-risk tasks more closely than low-risk ones. In this chapter, you will perform the first three actions in the preceding list; the fourth (tracking assignment-level work by time period) is addressed in Part 2. For users of Project Professional and Project Server, enterprise-level tracking is addressed in Part 4.
Important
Before you can use the practice files provided for this chapter, you need to install them from the book’s companion CD to their default locations. See "Using the Book’s CD" for more information.
Saving a Project Baseline
After developing a project plan, one of a project manager’s most important activities is to record actuals and evaluate project performance. To judge project performance properly, you will need to compare it with your original plan. This original plan is called the baseline plan or just the baseline. A baseline is a collection of important values in a project plan such as the planned start dates, finish dates, and costs of the tasks, resources, and assignments. When you save a baseline, Project takes a “snapshot” of the existing values and saves it in your Project plan for future comparison.
The specific values saved in a baseline include the task, resource, and assignment fields, as well as the timephased fields, which are shown on the following list.
Resource Fields | Assignment Fields | |
Start | Work and timephased work | Start |
Finish | Cost and timephased cost | Finish |
Duration | Work and timephased work | |
Work and timephased work | Cost and timephased cost | |
Cost and timephased cost |
Tip
Timephased fields show task, resource, and assignment values distributed over time. For example, you can look at a task with five days of work planned at the weekly, daily, or hourly level and see the specific baseline work values per time increment. In Part 2, you will work with timephased values.
You should save the baseline when:
You have developed the project plan as fully as possible. (However, this does not mean that you cannot add tasks, resources, or assignments to the project after work has started, for this is often unavoidable.)
You have not yet started entering actual values, such as a task’s percentage of completion.
The TV commercial project plan is now fully developed, and actual work on the project will soon begin. In this exercise, you save the baseline for the TV commercial project and then view the baseline task values.
Important
If you are running Project Professional, you may need to make a one-time adjustment to use the Computer account and to work offline. This ensures that the practice files you work with in this chapter do not affect your Project Server data. For more information, see "Starting Project Professional“.
Note
OPEN Wingtip Toys Commercial 6a from the DocumentsMicrosoft PressProject 2007 SBSChapter 6 Simple Tracking folder. You can also access the practice files for this book by clicking Start, All Programs, Microsoft Press, Project 2007 Step by Step, and then selecting the chapter folder of the file you want to open.
On the File menu, click Save As.
The Save As dialog box appears.
In the File name box, type Wingtip Toys Commercial 6, and then click Save.
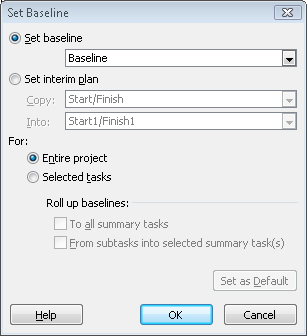
On the Tools menu. point to Tracking, and then click Set Baseline.
The Set Baseline dialog box appears.
You’ll set the baseline for the entire project by using the default settings of the dialog box.
Click OK.
Project saves the baseline, even though there’s no indication in the Gantt Chart view that anything has changed. You will now see some of the changes caused by saving the baseline.
Tip
You can set up to 11 baselines in a single plan. (The first one is called Baseline, and the rest are Baseline 1 through Baseline 10.) Saving multiple baselines can be useful for projects with exceptionally long planning phases in which you might want to compare different sets of baseline values. For example, you might want to save and compare the baseline plans every month as the planning details change. To clear a previously set baseline, click Clear Baseline on the Tools menu, Tracking submenu. To learn more about baselines in Project’s online Help, type create baseline.
On the View menu, click More Views.
The More Views dialog box appears.
In the Views box, click Task Sheet, and then click the Apply button.
Because the Task Sheet view does not include the Gantt chart, more room is available to see the fields in the table. Now you’ll switch to the Variance table in the Task Sheet view. The Variance table is one of several predefined tables that includes baseline values.
On the View menu, point to Table: Entry, and click Variance.
Tip
You also can right-click the Select All button in the upper left corner of the active table to switch to a different table.
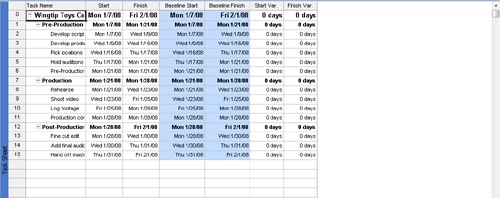
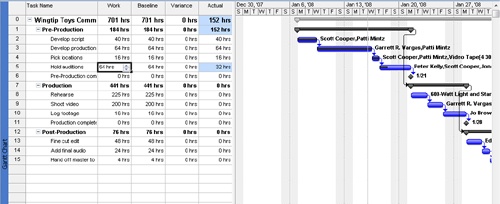
The Variance table appears. This table includes both the scheduled and baseline start and finish columns, shown side by side for easy comparison.
Because no actual work has occurred yet and no changes to the scheduled work have been made, the values in the Start and Baseline Start fields are identical, as are the values in the Finish and Baseline Finish fields. After actual work is recorded or later schedule adjustments are made, the scheduled start and finish values might differ from the baseline values. You would then see the differences displayed in the variance columns.

Now that you’ve had a look at some baseline fields, it is time to enter some actuals!
Tracking a Project as Scheduled
The simplest approach to tracking progress is to report that the actual work is proceeding exactly as planned. For example, if the first month of a five-month project has elapsed and all of its tasks have started and finished as scheduled, you can quickly record this in the Update Project dialog box.
In the TV commercial project, suppose that some time has now passed since saving the baseline. Work has started, and so far, so good. In this exercise, you record project actuals by updating work to a specific date.
On the View menu, click Gantt Chart.
The Gantt Chart view appears.
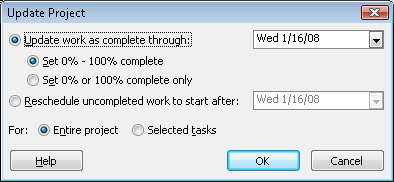
On the Tools menu, point to Tracking, and click Update Project.
The Update Project dialog box appears.
Make sure the Update work as complete through option is selected. In the adjacent date box, type or select 1/16/08.
Click OK.
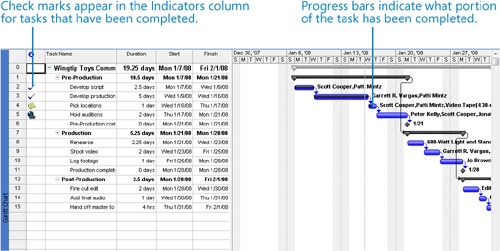
Project records the completion percentage for the tasks that were scheduled to start before January 16. It then displays that progress by drawing progress bars in the Gantt bars for those tasks.
In the Gantt Chart view, the progress bar shows how much of each task has been completed. Because tasks 2 and 3 have been completed, a check mark appears in the Indicators column for those tasks, and the progress bars extend through the full length of those tasks’ Gantt bars.
Entering a Task’s Completion Percentage
After work has begun on a task, you can quickly record its progress as a percentage. When you enter a completion percentage other than 0, Project changes the task’s actual start date to match its scheduled start date. It then calculates actual duration, remaining duration, actual costs, and other values based on the percentage you enter. For example, if you specify that a four-day task is 50% complete, Project calculates that it has had two days of actual duration and has two days of remaining duration.
Here are some ways of entering completion percentages:
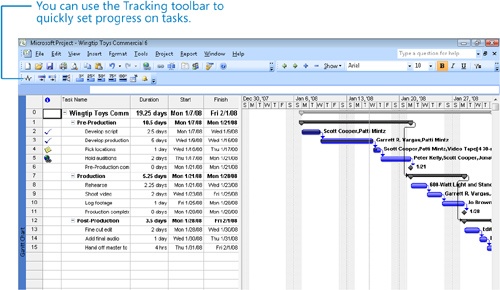
Use the Tracking toolbar (on the View menu, point to Toolbars, and then click Tracking). This toolbar contains buttons for quickly recording that a task is 0, 25, 50, 75, or 100% complete.
Enter any percentage value you want in the Update Tasks dialog box (on the Tools menu, point to Tracking, and then click Update Tasks).
Tip
If you can collect the actual start date of a task, it is a good practice to record the actual start date (described in the next section), and then record a completion percentage.
In this exercise, you record completion percentages of tasks via the Tracking toolbar.
On the View menu, point to Toolbars, and then click Tracking.
The Tracking toolbar appears.
Click the name of task 4, Pick Locations.
On the Tracking toolbar, click the 100% Complete button.
Project records the actual work for the task as scheduled and extends a progress bar through the length of the Gantt bar.
Next, you’ll get a better look at the task’s Gantt bar. You will enter a completion percentage value for a different task.
Click the name of task 5, Hold auditions.
On the Tracking toolbar, click the 50% Complete button.
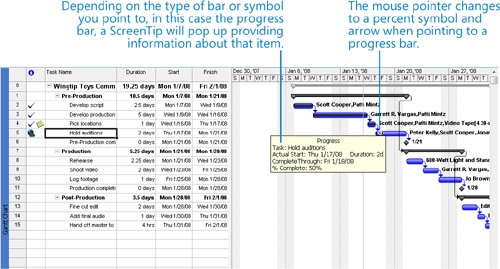
Project records the actual work for the task as scheduled and then draws a progress bar through part of the Gantt bar. Note that although 50% of task 5 is completed, the progress bar does not span 50% of the width of the Gantt bar. This is because Project measures duration in working time, but draws the Gantt bars to extend over nonworking time, such as weekends.
Tip
By default Project shows Gantt bars in front of nonworking time (such as weekends), like you see in this section. However Project can show nonworking time in front of task bars, visually indicating that no work on the task will occur during the nonworking time. If you prefer this type of presentation, click Timescale on the Format menu, and then click the Non-working time tab. Next to Draw, click In front of task bars.
In the chart portion (on the right) in the Gantt Chart view, hold the mouse pointer over the progress bar in task 5’s Gantt bar. When the mouse pointer changes to a percent symbol and right arrow, a Progress screentip appears.
The Progress ScreenTip informs you of the task’s completion percentage and other tracking values.
So far, you have recorded actual work that started and finished on schedule. While this might prove true for some tasks, you often need to record actuals for tasks that lasted longer or shorter than planned, or occurred sooner or later than scheduled. This is the subject of the next topic.
Entering Actual Values for Tasks
A more detailed way to keep your schedule up to date is to record what actually happens for each task in your project. You can record each task’s actual start, finish, work, and duration values. When you enter these values, Project updates the schedule and calculates the task’s completion percentage. Project uses the following rules:
When you enter a task’s actual start date, Project moves the scheduled start date to match the actual start date.
When you enter a task’s actual finish date, Project moves the scheduled finish date to match the actual finish date and sets the task to 100% complete.
When you enter a task’s actual work value, Project recalculates the task’s remaining work value, if any.
When you enter a task’s actual duration, if it is less than the scheduled duration, Project subtracts the actual duration from the scheduled duration to determine the remaining duration.
When you enter a task’s actual duration, if it is equal to the scheduled duration, Project sets the task to 100% complete.
When you enter a task’s actual duration, if it is longer than the scheduled duration, Project adjusts the scheduled duration to match the actual duration and sets the task to 100% complete.
Suppose that a few more days have passed and work on the TV commercial has progressed. In this exercise, you record actual work values for some tasks as well as start dates and durations for other tasks.
If it is not already selected, click the name of task 5, Hold auditions.
On the View menu, point to Table: Entry, and click Work.
The Work table appears. This table includes both the scheduled work (labeled “Work”) and actual work (labeled “Actual”) columns. You’ll refer to values in both columns as you update tasks.
In the chart portion of the Gantt Chart view, you can see that task 5 is partially complete. In the Work table, you can see the actual work value of 32 hours. You want to record that the task is now complete but required more actual work than expected.
In the Actual field for task 5, type or select 80, and then press
 .
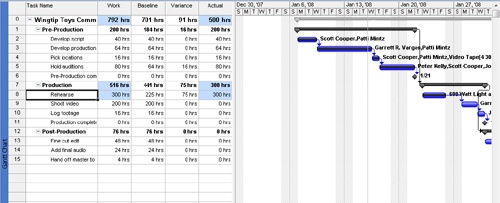
.Project records that 80 hours of work have been completed on task 5. It extends the Gantt bar of the task to indicate its longer duration and reschedules subsequent tasks.
Now suppose that more time has passed. To conclude this exercise, you will enter actual start dates and durations of tasks in the Production phase.
In the Task Name column, click task 8, Rehearse.
This task started one working day behind schedule (the Wednesday after its scheduled start date) and took a total of three days to complete. You will record this information in the Update Tasks dialog box.
On the Tools menu, point to Tracking, and then click Update Tasks.
The Update Tasks dialog box appears. This dialog box shows both the actual and scheduled values for the task’s duration, start, and finish, as well as its remaining duration. In this box, you can update the actual and remaining values.
In the Start field in the Actual box on the left side of the dialog box, type or select 1/23/08.
In the Actual dur field, type or select 3d.
Click OK.
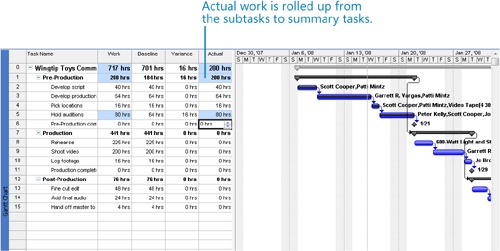
Project records the actual start date, duration, and scheduled and actual work of the task. These values also roll up to the Production summary task (task 7) and the project summary task (task 0), as indicated by the change highlighting.
To conclude this exercise, you will record that task 9 started on time but took longer than planned to complete.
In the Task Name column, click task 9, Shoot Video.
On the Tools menu, point to Tracking, and then click Update Tasks.
The Update Tasks dialog box appears.
In the Actual dur field, type or select 3d, and then click OK.
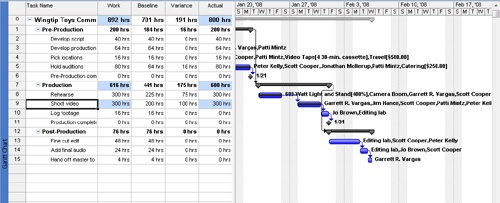
Project records the actual duration of the task.
On the Standard toolbar, click Scroll To Task.
Because you did not specify an actual start date, Project assumes that the task started as scheduled; yet, the actual duration you entered causes Project to calculate an actual finish date that is later than the originally scheduled finish date.
On the View menu, point to Toolbars and then click Tracking.
Project hides the Tracking toolbar.

Key Points
Before tracking actual work in a project plan, you should set a baseline. This provides you with a “snapshot” of your initial project plan for later comparison against actual progress and is one way to tell whether your project is on track.
The ability to track actual work in a project plan is a major advantage that a real project management tool, such as Project, has over a list-keeping tool, such as Excel. In Project, you can track actual work at a very broad or very granular level.
To properly evaluate a project’s status after you begin tracking requires a combination of recording accurate data in Project and using your good judgment when interpreting the results.