Chapter 11. Printing Project Information

In this chapter, you will learn how to: | |
✓ | Change page setup options for views and reports. |
✓ | Print a view. |
✓ | Print a report. |
Tip
Do you need only a quick refresher on the topics in this chapter? See the Quick Reference entries in Printing Project Information.
In this chapter, you work with some of the many views and reports in Microsoft Office Project 2007 to print your project plan. One of the most important tasks of any project manager is communicating project information to stakeholders, and that often means printing. To communicate project details in printed form, you can use the predefined views and reports as they are provided or customize them to better suit your needs.
Tip
This tip describes enterprise project management (EPM) functionality. Printing information from Project is a common means of communicating with stakeholders. If you are using Project Professional in conjunction with Project Server, you and your stakeholders have many additional options for communicating project information. For more information, see Part 4.
Important
Before you can use the practice files provided for this chapter, you need to install them from the book’s companion CD to their default locations. See "Using the Book’s CD" for more information.
Printing Your Project Plan
Printing information from a project plan to share with stakeholders is a common activity for most project managers. In Project, printing focuses on views and reports.
You’ve probably already seen several views and a few reports, such as the Gantt Chart view and the Project Summary report. Both views and reports organize the details of a project plan into specific formats for specific purposes. You can enter, read, edit, and print information in a view, whereas you can only print information in a report. Think of views as your general working environment in Project, and think of reports as specific formats for printing.
You can customize the way you print both views and reports; however, Project has fewer options for printing reports. When printing, many of the same options exist for both views and reports, as well as some specific options unique to views or reports. To customize printing for a view or report, you use the Page Setup and Print dialog boxes.
First, you will look at the Page Setup dialog box. To see the Page Setup dialog box for views, click Page Setup on the File menu. To see this dialog box for reports, first display a report in the Print Preview window, and then click the Page Setup button.
In the Page Setup dialog box, the Page and Margins tabs are available for both views and reports. However, the specific options you choose in the Page Setup dialog box for any view or report affect only that view or report; the settings are not shared between views or reports.
Some page setup options are unique to views or reports, and a few options are available to only specific views or reports. The following is a summary of unique page setup options:
You can use options on the Header, Footer, and View tabs in the Page Setup dialog box for all views. The View tab in particular includes options that vary depending on which view is currently active. For views that include a legend (such as the Gantt Chart, Network Diagram, and Calendar views), the Legend tab is also available.
You can use options on the Header and Footer tabs in most reports, but the View and Legend tabs are not available for any reports.
Tip
To learn more about which views or reports best convey specific project information, type Print a view or Create and print a basic report into the Search box in the upper right corner of the Project window. The Search box initially contains the text Type a question for help.
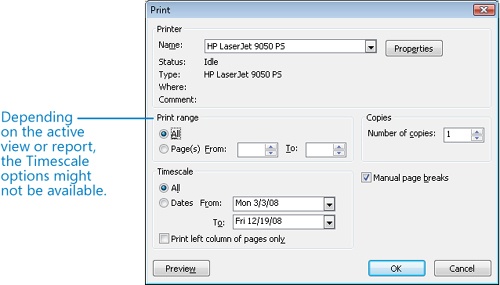
Next, you will look at the Print dialog box. To see the Print dialog box for views, click Print on the File menu. To see this dialog box for reports, first display the report in the Print Preview window, and then click the Print button.
Tip
Depending on the printer or plotter to which you are printing, you might have additional options unique to that device. To set these options, click the Properties button for your selected printer in the Print dialog box.
In the Print dialog box, most options available for views are also available for reports. For example, some views and reports support timescale options in the Print dialog box, but others do not. The Gantt Chart view and the Who Does What When report, for example, both include a timescale. In the Print dialog boxes for both, you can print specific ranges from the timescale if you wish.
In this exercise, you compare the page setup options of views and reports.
Important
If you are running Project Professional, you may need to make a one-time adjustment to use the Computer account and to work offline. This ensures that the practice files you work with in this chapter do not affect your Project Server data. For more information, see "Starting Project Professional" in Assigning Resources to Tasks.
Note
OPEN Short Film Project 11a from the DocumentsMicrosoft PressProject 2007 SBSChapter 11 Printing folder. You can also access the practice files for this book by clicking Start, All Programs, Microsoft Press, Project 2007 Step by Step, and then selecting the chapter folder of the file you want to open.
On the File menu, click Save As.
The Save As dialog box appears.
In the File name box, type Short Film Project 11, and then click Save.
Next, you will look at page setup options.
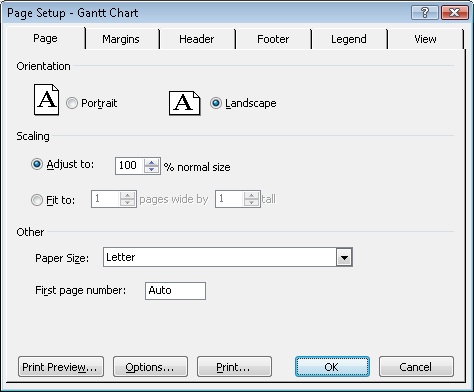
On the File menu, click Page Setup.
The Page Setup dialog box appears. Note the title of the dialog box: Page Setup – Gantt Chart. Because the Page Setup dialog box changes depending on the active view, Project includes the view name in the dialog box title bar.
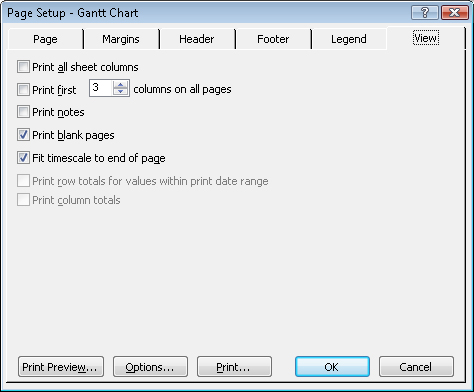
Click the View tab.
Because the Gantt Chart view includes a table, the View tab includes some options relating to columns. The Gantt Chart also includes a timescale, so you see an option relating to the timescale.
Click Cancel.
The Page Setup dialog box closes. Next, you’ll switch to another view and see how the page setup options differ.
On the View menu, click Calendar.
The Calendar view appears. This view lacks both the table and chart elements you saw in the Gantt Chart view and instead represents tasks in a month-at-a-glance arrangement.
On the File menu, click Page Setup.
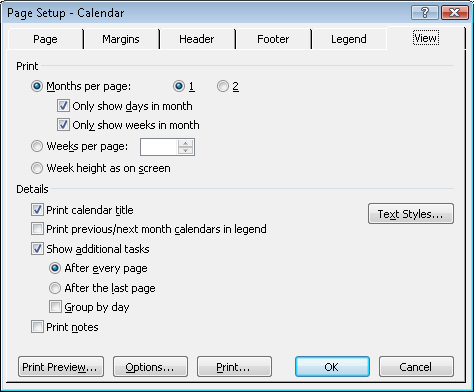
The Page Setup dialog box appears. Note again the title of the dialog box: Page Setup – Calendar.
Click the View tab if it is not already active.
The options available for the Calendar view are quite different from those of the Gantt Chart view. Here you have several options for controlling how details are organized in the Calendar view when printed.
The Print Notes check box, however, is available for both the Gantt Chart and Calendar views.
Click Cancel.
The Page Setup dialog box closes.
To conclude this exercise, you will see the page setup options for a report.
Tip
New in Project 2007 is a powerful new feature called visual reports. Visual reports can play an important role in your schedule reporting and analysis needs. Because visual reports depend on exporting Project data to other Office applications, they are described in Chapter 12.
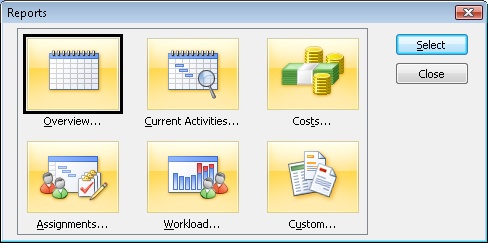
On the Report menu, click Reports.
The Reports dialog box appears.
Click Custom, and then click the Select button.
The Custom Reports dialog box appears.
In the Custom Reports box, click Who Does What, and then click the Setup button.
The Page Setup dialog box appears. Note again the title of the dialog box: Page Setup – Who Does What.
Most of the tabs you’ve seen for views are also available for reports, but the Legend and View tabs are not.
Click Cancel to close the Page Setup dialog box, and click Cancel again to close the Custom Reports dialog box.
Click Close to close the Reports dialog box.
On the View menu, click Gantt Chart.

Printing Views
Printing a view allows you to put on paper just about anything you see on your screen. Any customization you apply to a view, such as applying different tables or groups, will be printed as well. With a few exceptions, you can print any view you see in Project. The exceptions are as follows:
You cannot print the Relationship Diagram or form views such as the Task Form.
If you display two views in a combination view (one view in the top pane and the other view in the bottom pane), only the view in the active pane will be printed.
Keep in mind that the part of your project plan that you see on your screen at one time might be a relatively small portion of the full project, which could require a large number of letter-size pages to print. For example, the Gantt Chart view of a six-month project with 85 tasks can require 14 or more letter-size pages to print in its entirety. Printing Gantt Chart or Network Diagram views can use quite a bit of paper; in fact, some heavy-duty Project users make poster-size printouts of their project plans using plotters.
Whether you use a printer or a plotter, it’s a good idea to preview any views you intend to print. By using the Page Setup dialog box in conjunction with the Print Preview window, you can control many aspects of the view to be printed. For example, you can control the number of pages on which the view will be printed, apply headers and footers, and determine content that appears in the legend of the Gantt Chart and some other views.
Tip
When printing Gantt Chart views and other views that include a timescale, adjusting the timescale before printing affects the number of pages required. To adjust the timescale so that it shows the largest time span in the smallest number of pages, on the View menu, click Zoom; then, in the Zoom dialog box, click Entire Project.
To further reduce the number of pages required, you can collapse a project plan’s outline to summary tasks. Click the Show button on the Formatting toolbar, and then click the outline level you want. A collapsed view showing only summary tasks might be informative enough for people who simply want an overall sense of the project plan. If you’re interested in a specific time period, you can print just that portion of the timescale. You might also apply a filter to display only the information that’s of greatest interest to a particular audience, such as late or overbudget tasks, for example.
In this exercise, you preview the Gantt Chart view and change options in the Page Setup dialog box.
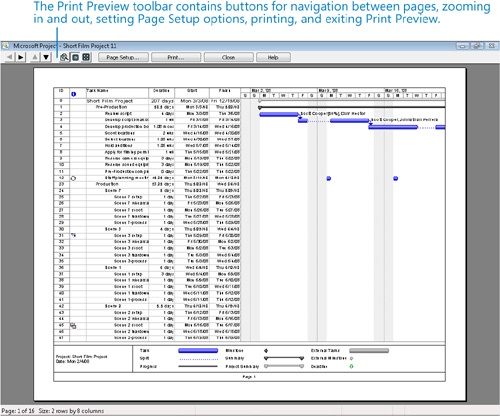
On the File menu, click Print Preview.
Project displays the Gantt Chart view in the Print Preview window.
The Print Preview window has several options to explore. You will start with the page navigation buttons.
On the Print Preview toolbar, click the Page Right button several times to display different pages.
Click the Page Down button once.
To observe a broader view of the output, you’ll switch to a multi-page view.
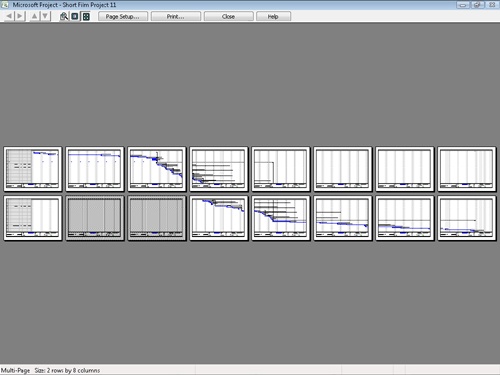
Click the Multiple Pages button.
The entire Gantt Chart view appears in the Print Preview window.
If you have a plotter selected as your default printer or you have a different page size selected for your default printer, what you see in the Print Preview window will differ from what’s shown here.
The status bar text reads 2 rows by 8 columns (the specific number of rows and columns you see may differ). We refer to rows and columns on the Gantt Chart and in other views; in the Print Preview window, however, these terms denote rows and columns of pages—in this case, two rows of pages by eight columns of pages, for a total of 16 pages. The status bar text can help you quickly determine the size (in pages) of your printed view.
Next, you’ll change some options in the Page Setup dialog box.
On the Print Preview toolbar, click the One Page button.
Project displays the first page of the Gantt chart.
Click the Page Setup button.
The Page Setup dialog box appears. This is the same dialog box you’d see if you clicked Page Setup on the File menu. The first change you’ll make to the printed Gantt Chart is to add the company name to the header that is printed on every page.
Click the Header tab.
On the Header tab are Alignment tabs. Make sure that Center is selected.
In the General box, click Company Name on the drop-down list, and then click the Add button.
Project inserts the &[Company] code into the header and displays a preview in the Preview window of the Page Setup dialog box. The company name comes from the Properties dialog box (File menu), which has been filled out for you. Next, you’ll change the content of the Gantt Chart view’s legend.
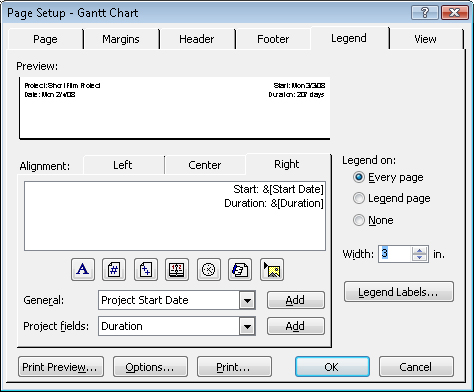
Click the Legend tab.
On the Legend tab are Alignment tabs. Click the Right tab.
With the current settings, Project will print the project title and the current date on the left side of the legend. You also want to print the project start date and duration on the right side of the legend.
Click in the text box, and type Start: followed by a space.
In the General box, click Project Start Date on the drop-down list, and then click Add.
Project adds the label and code for the project start date to the legend.
Press the
 key to add a second line to the legend, and
then type Duration: followed by a
space.
key to add a second line to the legend, and
then type Duration: followed by a
space.In the Project fields box, click Duration on the drop-down list, and then click Add.
Project adds the label and code for project duration to the legend.
In the Width box, type or select 3.
This increases the width of the box on the left side of the legend.
Click OK to close the Page Setup dialog box.
Project applies the changes you specified to the legend. To get a closer look, zoom in on the legend.
In the Print Preview window, click the lower left corner of the page with the magnifying-glass pointer.
Project zooms in to show the page at a legible resolution.
You can see the data you added to the legend, which will be printed on every page of the printed output.
To conclude this exercise, you will choose not to print pages that do not include any Gantt bars.
Click Multiple Pages again.
Note that several of the pages of the Gantt Chart view do not contain any Gantt bars. If you intend to print a Gantt Chart view and stitch the pages together, these pages do not add any information; therefore, you don’t need to print them.
Click Page Setup.
In the Page Setup dialog box, click the View tab.
Clear the Print blank pages box, and then click OK.
In the Print Preview window, the blank pages are formatted with a gray pattern, indicating that they will not be printed.
On the Print Preview toolbar, click Close.
The Print Preview window closes, and the Gantt Chart view appears. Although you did not print, your changes to the header and the legend will be saved when you save the project file.
Tip
You can print the project plan now if you wish; however, previewing the project plan is adequate for the purposes of the lesson. When printing in Project, you have additional options in the Print dialog box that you can open by clicking the Print command on the File menu. For example, you can choose to print a specific date range of a timescaled view, such as the Gantt Chart view, or you can print a specific page range.

Printing Reports
Reports are predefined formats intended for printing Project data. Unlike views, which you can either print or work with onscreen, reports are designed only for printing. You don’t enter data directly into a report. Project includes several predefined reports that you can edit to display the information you want.
Although reports are distinct from views, some settings that you specify for a view might affect certain reports. For example:
If subtasks are collapsed or hidden under summary tasks in a view, reports that include task lists will show only the summary tasks and not the subtasks.
In usage views, if assignments are collapsed or hidden under tasks or resources, the usage reports (Task Usage or Resource Usage) likewise hide assignment details.
Tip
New in Project 2007 is a powerful new feature called visual reports. Visual reports can play an important role in your schedule reporting and analysis needs. Because visual reports depend on exporting Project data to other Office applications, we describe them in Chapter 12.
In this exercise, you see a report in the Print Preview window, and then you edit its definition (that is, the set of elements that make up the report) to include additional information.
On the Report menu, click Reports.
The Reports dialog box appears, displaying the broad categories of reports available in Project.
Click Custom, and then click Select.
The Custom Reports dialog box appears.
This dialog box lists all predefined reports in Project as well as any custom reports that have been added.
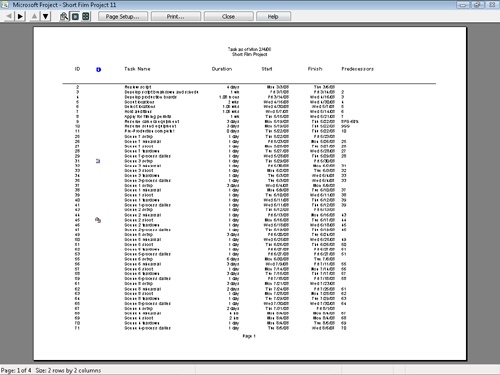
In the Reports box, click Task, and then click the Preview button.
Project displays the Task report in the Print Preview window.
This report is a complete list of project tasks (except for summary tasks), similar to what you’d see in the Entry table of the Gantt Chart view. You’d like to see this data presented in a different way, so you’ll edit this report.
On the Print Preview toolbar, click Close.
The Print Preview window closes, and the Custom Reports dialog box reappears. Next, you’ll create a copy of a built-in report and modify the copy.
In the Reports box, make sure that Task is still selected, and then click the Copy button.
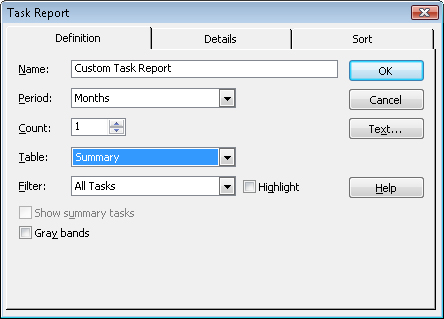
The Task Report dialog box appears.
In the Name box, select the displayed text, and then type Custom Task Report.
In the Period box, click Months on the drop-down list.
Choosing Months here groups tasks by the month in which they occur. Because the report now includes a time period element, the Timescale options in the Print dialog box become available, enabling you to print data within a specific date range if you want.
In the Table box, click Summary on the drop-down list.
Tip
The tables listed in the Task Report dialog box are the same as those you can apply to any view that displays tasks in a table. In fact, if you completed Chapter 10, the Shooting Schedule table you created there appears in the list here. When editing a report format, you can apply predefined or custom tables and filters, choose additional details to include in the report, and apply a sort order to the information—all in the dialog box for the report you’re editing.
Click OK to close the Task Report dialog box.
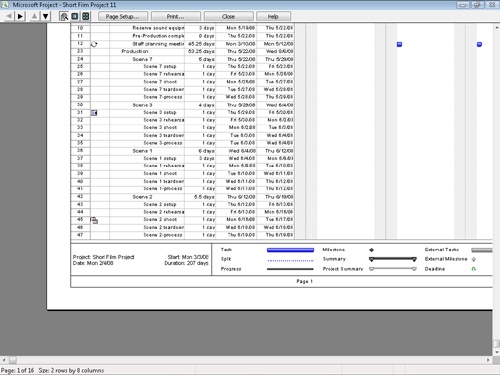
In the Custom Reports dialog box, make sure that Custom Task Report is selected in the Reports box, and then click Preview.
Project applies the custom report settings you chose to the report, and the report appears in the Print Preview window. Next, you will zoom in to see the report in more detail.
In the Print Preview window, click the upper left corner of the page with the magnifying-glass pointer.
This custom report shows the fields displayed in the Summary Task table, but divides the tasks by month.
On the Print Preview toolbar, click Close.
In the Custom Reports dialog box, click Close.
Click Close again to close the Reports dialog box.
The Gantt Chart view reappears.


Key Points
In Project, you can print views or reports. Reports are designed only for printing (or print previewing).
When printing a view, you generally will get on paper what you see on your screen.
With even moderately large project plans, a printed view or report might require more sheets of paper than you expect. For this reason, it’s a good idea to always preview your output before printing it.
The many reports available in Project are organized into several categories, such as Costs and Assignments. These are worth exploring (for example, by previewing) so that you know what’s available.