Chapter 18. Measuring Performance with Earned Value Analysis
In this chapter, you will learn how to: | |
✓ | Set a status date and see earned value indicators for schedule performance. |
✓ | See earned value cost performance indicators. |
✓ | Generate the earned value visual report. |
Tip
Do you need only a quick refresher on the topics in this chapter? See the Quick Reference entries in Measuring Performance with Earned Value Analysis.
Looking at task and resource variance throughout a project’s duration is an essential project management activity, but it does not give you a complete picture of the project’s long-term health. For example, a task might be over budget and ahead of schedule (possibly not good) or over budget and behind schedule (definitely not good). Viewing schedule or cost variance alone does not tell you much about performance trends that might continue for the duration of the project.
To get a more complete picture of overall project performance in terms of both time and cost, you can use earned value analysis (also called earned value management, or EVM). The purpose of earned value analysis is to measure the project’s progress and help predict its outcome. Earned value analysis involves comparing the project’s progress to what you expected to achieve (as reflected in a baseline plan) at a specific point in the schedule or budget of a project plan and then forecasting future project performance.
The main differences between earned value analysis and simpler schedule and cost variance analysis can be summed up as follows:
The difference is subtle but important. Here is an example. Assume that a project has a baseline duration of 160 days and a budget of $82,000. After approximately one-half of the baseline duration has elapsed, the actual costs incurred are about $40,000. But what is the project’s status? You cannot tell based on this information alone. A simple distribution of cost over time would suggest that $40,000 spent by the midpoint of an $82,000 project is just about right. But perhaps the project is running ahead of schedule—more work has been completed by midpoint than planned. That would be good news; the project might finish ahead of schedule. On the other hand, the project might be running behind schedule—less work has been accomplished than was planned. This would be bad news; the project will likely miss its planned finish date, exceed its budget, or both.
Earned value analysis enables you to look at project performance in a more sophisticated way. It helps you to determine two important variables: the true cost of project results to date and the performance trend that is likely to continue for the remainder of the project.
Earned value analysis has its origins in large projects carried out for the U.S. Department of Defense, and it remains an essential project status reporting tool for major government projects. However, because of the usefulness of earned value analysis in predicting future project performance, it is gaining popularity in the private sector and on smaller projects as well.
Important
Before you can use the practice files provided for this chapter, you need to install them from the book’s companion CD to their default locations. See "Using the Book’s CD" for more information.
Viewing Earned Value Schedule Indicators
For Microsoft Office Project 2007 to calculate earned value amounts for a project plan, you must first do the following:
Set a baseline plan so Project can calculate the budgeted cost of the work scheduled before you start tracking actual work. (On the Tools menu, point to Tracking, and then click Set Baseline.)
Record actual work on tasks or assignments.
Set the status date so Project can calculate actual project performance up to a certain point in time. (On the Project menu, click Project Information, and then select a status date.) If you do not specify a status date, Project uses the current date.
Earned value analysis uses the following three key values to generate all schedule indicator and cost indicator values:
The budgeted cost of work scheduled, called BCWS. This is the value of the work scheduled to be completed as of the status date. Project calculates this value by adding up all of the timephased baseline values for tasks up to the status date. BCWS is also more generally called planned value (PV).
The actual cost of work performed, called ACWP. This is the actual cost incurred to complete each task’s actual work up to the status date.
The budgeted cost of work performed, called BCWP or earned value. This is the portion of the budgeted cost that should have been spent to complete each task’s actual work performed up to the status date. This value is also more generally called earned value (EV) because it is literally the value earned by the work performed.
The earned value analysis schedule and the cost variance are directly related, but it’s simpler to examine each independently. To accommodate this, Project groups the earned value schedule and cost indicator fields into different tables, along with a third table that combines the key fields of both schedule and cost indicators:
Earned Value Schedule Indicators, which focuses on schedule values through the status date, including the schedule performance index (SPI) value.
Earned Value Cost Indicators, which focuses on cost values through the status date, including the cost performance index (CPI) value.
Earned Value, which shows combined schedule and cost values through the status date.
In this exercise, you set the status date and view earned value schedule indicators for the project plan.
Important
If you are running Project Professional, you may need to make a one-time adjustment to use the Computer account and to work offline. This ensures that the practice files you work with in this chapter do not affect your Project Server data. For more information, see "Starting Project Professional“.
Note
OPEN Short Film Project 18a from the DocumentsMicrosoft PressProject 2007 SBSChapter 18 Earned Value folder. You can also access the practice files for this book by clicking Start, All Programs, Microsoft Press, Project 2007 Step by Step, and then selecting the chapter folder of the file you want to open.
On the File menu, click Save As.
The Save As dialog box appears.
In the File name box, type Short Film Project 18, and then click Save.
On the View menu, point to Table: Entry, and click More Tables.
The More Tables dialog box appears. In it, you see the three earned value tables.
On the Tables list, select Earned Value Schedule Indicators, and click the Apply button.
Project displays the Earned Value Schedule Indicators table in the Task Sheet view. Next, you will set the project status date. Unless you specify a status date, Project uses the current date when performing earned value calculations.
On the Project menu, click Project Information.
The Project Information dialog box appears.
In the Status Date box, type or select 6/20/2008, and click OK.
June 20 is the date that includes recent work completed on this project.
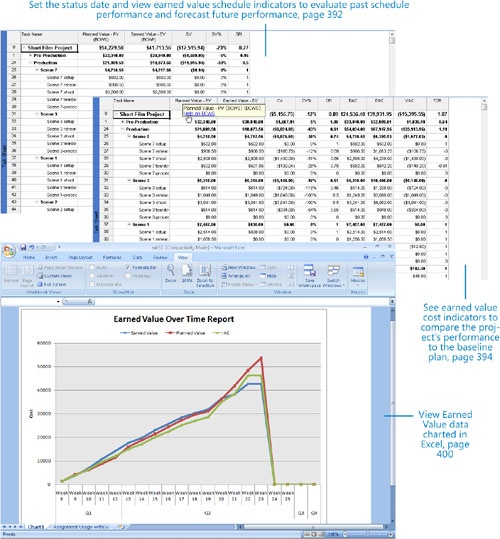
Here you can see the earned value schedule indicators for the project plan, summary tasks, and subtasks.
Tip
If any column displays pound signs (###) or the values are not fully visible, double-click the column heading’s right edge to widen it.

All earned value numbers are reported either as dollars or as index ratios for easy comparison; negative cost values appear in parentheses. Note the information in the following columns:
Planned Value - PV or BCWS. The budgeted cost of work scheduled, as described earlier. As of the status date, a total of $54,229.50 was scheduled to be spent on tasks. In the baseline plan, the short film project would have incurred this amount by the status date. Project uses this value for comparison with the earned value and to derive other values.
Earned Value - EV or BCWP. The budgeted cost of work performed. The value of the work performed as of the status date in the short film project is only $41,713.56—quite a bit less than the planned value.
SV. The schedule variance, which is simply the difference between the earned value and planned value. The short film project has a negative schedule variance of $12,515.94.
SV%. The ratio of the schedule variance to the planned value, expressed as a percentage. This value tells you whether the current level of completion on tasks is ahead of or behind the performance predicted in the baseline. The short film project is 23% behind or under baseline performance.
SPI. The schedule performance index. This is the earned value divided by the planned value, and it is the most common way to compare earned value schedule performance between tasks, summary tasks, or projects. Because it’s an index value, SPI alone tells you nothing about the specific earned or planned values on which it is based, but it does tell you how they relate to each other. You can also compare how this index value relates to the comparable index value for other tasks, summary tasks, or projects. For example, you can see that the pre-production phase of the short film project has an SPI of 0.95; the planned value was very close to the earned value. However, the second phase, Production, has a considerably lower SPI value: 0.5. The project summary task has a 0.77 SPI value. One way you can interpret this information (and this is where an index value is especially useful) is that for every dollar’s worth of work you had planned to accomplish by the status date, only 77 cents’ worth was actually accomplished.
Tip
Here’s a quick way to get help about an earned value field or any field in a table in Project. Point to the column heading, and in the ScreenTip that appears, click the Help On <Field Name> link. Information about that field appears in the Help window.
You can use these schedule indicator values to address the question, “At the rate you’re making progress, is there enough time left to complete the project?” In the case of the short film project, one area to investigate is the low SPI for the production work completed thus far and whether the cause of that problem is likely to affect the remaining production work.
The values in the Earned Value Schedule Indicators table inform us about schedule performance, but they do not directly inform us about cost performance. You examine cost performance in the next section.
Viewing Earned Value Cost Indicators
The flip side of the question, “Is there enough time left to complete the project?” relates to cost: “Is there enough money available to complete the project?” Focusing on earned value cost indicators can help you answer this question. To calculate cost indicators, Project uses the actual cost of work performed, or ACWP, as derived from the actual work values recorded in a project plan.
In this exercise, you display earned value cost indicators for the project plan.
On the View menu, point to Table: Earned Value Schedule Indicators, and click More Tables.
The More Tables dialog box appears.
On the Tables list, select Earned Value Cost Indicators, and click Apply.
Project displays the Earned Value Cost Indicators table in the Task Sheet view.
Tip
If any column displays pound signs (###) or the values are not fully visible, double-click the column heading’s right edge to widen it.

Here you can see the earned value cost indicators for the project plan, summary tasks, and subtasks. Because planned value and earned value are key values for both schedule and cost indicators, they appear in both tables and were described in the previous section. Note that the ACWP field (Actual Cost of Work Performed) does not appear on either the schedule indicators or cost indicators tables; it does appear on the Earned Value table, however. Note the project summary task (task 0) values in the following columns:
CV. The cost variance, or the difference between earned value and ACWP. The short film project has relatively low cost variance.
CV%. The ratio of cost variance to planned value, expressed as a percentage. This value tells you how close you are (under or over) to the budget plan per task. The short film project is below baseline cost performance.
CPI. The cost performance index. The short film project’s CPI (as of the status date) is 0.89. One way you can interpret this is that for every dollar’s worth of work you have paid for, 89 cents worth of work was actually accomplished.
BAC. The budget at completion. This is simply the total baseline cost of a task, summary task, or project. You evaluate this figure against the EAC to derive the VAC.
EAC. The estimate at completion. This value represents the forecasted cost to complete a task, summary task, or project based on performance so far (up to the status date).
VAC. The variance at completion, or the difference between the BAC and the EAC. The VAC represents the forecasted cost variance to complete a task, summary task, or project based on performance so far (up to the status date). The short film project has some variance at completion value.
TCPI. The to complete performance index. This index value demonstrates the ratio of remaining work to remaining budget as of the status date. The short film project’s TCPI value is 1.07, meaning remaining work and remaining budget are almost equal. Depending on your screen resolution, you might need to scroll right to see this column.
Important
Although it might seem odd and even confusing to consider being ahead of or behind schedule in terms of dollars, remember that dollars buy work and work drives the completion of tasks.
From a pure cost variance analysis standpoint, the short film project appears to be in relatively good shape. Yet the schedule variance analysis suggests otherwise. The heart of the issue is that, as of the status date, quite a bit of work has started later than planned but has not cost more than planned. The true health of the project is often not obvious and requires a comparison of both cost and schedule variance based on past performance, as well as forecasts of future performance.
Now let’s all take a deep breath. Earned value analysis is one of the more complicated procedures you can do in Project, but the information it provides on project status is invaluable. Earned value analysis is also a great example of the benefits of entering task and resource cost information in a project plan.
Generating an Earned Value Visual Report
Visual reports are a major new feature of Project 2007. If you completed the section "Generating Visual Reports with Excel and Visio" in Chapter 12, you’ve worked with some visual reports. One of the Excel visual reports available in Project, the Earned Value Over Time Report, generates the classic “S-curve” line chart that graphs cumulative values over time for the three key indicators associated with earned value analysis. They are:
Actual Cost of Work Performed (ACWP), labeled in the visual report’s legend as AC.
Budgeted Cost of Work Scheduled (BCWS), labeled as Planned Value.
Budgeted Cost of Work Performed (BCWP), labeled as Earned Value.
In previous versions of Project, to generate a similar chart in Excel, you used an add-in named Analyze Timescaled Data in Excel. In Project 2007, this functionality is provided by the visual report. As with all Excel visual reports in Project, you end up with the chart as well as the Excel PivotTable on which the chart is based that you can modify as you wish.
Important
If the computer on which you are now working does not have Excel 2003 or later installed, you cannot complete this exercise. If this is the case, skip ahead to the "Key Points" section.
In this exercise, you generate an Earned Value Over Time Report.
On the Report menu, click Visual Reports.
The Visual Reports dialog box appears:
This dialog box groups visual reports in a number of ways: all reports, only Excel or Visio reports, and task, resource, or assignment details (divided into summary and usage reports). The dialog box includes a simplified preview of the type of graphic (chart or diagram) associated with each visual report. You can click the various tabs in the dialog box to see how the visual reports are organized if you wish.
Click the Assignment Usage tab.
Click Earned Value Over Time Report.
In the Select level of usage data to include in the report box, make sure that Weeks is selected.
This setting determines the time increment that will be included in the Excel PivotTable and charted in the line graph.
Click View.
Project generates the data required by this report, launches Excel, and creates the report. Next, you’ll adjust the PivotTable outline to change the level of detail shown in the line chart.
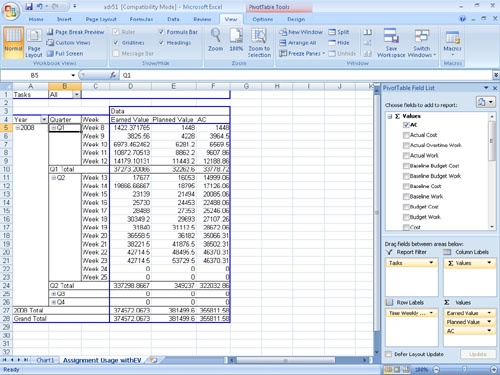
In Excel, click the tab name of the Assignment Usage withEV sheet.
This is the PivotTable on which the earned value chart is based.
On the PivotTable Field List, you can see all of the fields for which timephased data was exported from Project. You can add any of these fields to the PivotTable by clicking them.
To show more detail in the earned value chart, you’ll expand the PivotTable outline.
Click the plus signs next to the Q1 and Q2 values.
The PivotTable expands to show the weekly values you exported from Project.
Click the tab name of the Chart1 sheet.
In Excel, adjust the zoom setting such that the entire chart is visible.
Because you set the status date to June 20, Project reports zero values after that date, causing the lines in the chart to return to zero after week 23 of the project’s overall duration.
Now the earned value chart shows the level of detail we want. The key to reading this type of chart is to locate earned value and actual cost as they relate to planned cost. Recall that the planned costs represent the cumulative amount of money you planned to spend at any given time. Where the earned value line falls below the planned value line around week 20, you see the project effectively fell behind schedule. The actual cost (AC) line, when it is below the planned value line, tells you the project was running below budget. Around week 21, however, actual cost shot well above budget. As the earned value indicators you saw in Project suggested, the project has been underperforming in terms of both schedule and cost indicators. The earned value chart helps you visualize the specific trends that are driving project performance and hopefully allows you time to address these issues through the remainder of the project.
Close Excel without saving the workbook.
In Project, click Close to close the Visual Reports dialog box.


Key Points
Earned value analysis is a complex and robust means of evaluating project performance and predicting its outcome.
When performing earned value analysis, remember that it is essential to set the project status date.
Project organizes key earned value indicators into schedule indicators and cost indicators tables, as well as an overall earned value table.
The earned value visual report allows you to graph key earned value indicators in Excel.