Chapter 10. Organizing and Formatting Project Details
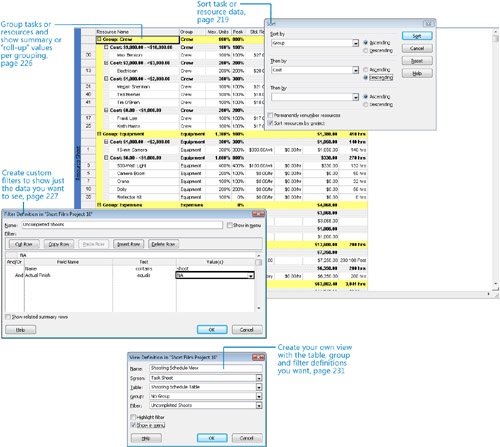
Chapter at a Glance
In this chapter, you will learn how to: | |
✓ | Sort task and resource data. |
✓ | Display task and resource data in groups. |
✓ | Filter or highlight task and resource data. |
✓ | Create a custom table. |
✓ | Create a custom view. |
Tip
Do you need only a quick refresher on the topics in this chapter? See the Quick Reference entries in Organizing and Formatting Project Details.
After you’ve built a project plan, chances are you will need to examine specific aspects of the plan for your own analysis or to share with other stakeholders. Although the built-in views, tables, and reports in Microsoft Office Project 2007 provide many ways to examine a project plan, you might need to organize information to suit your own specific needs.
In this chapter, you use some of the formatting tools in Project to change the way your data appears. Project includes powerful features that enable you to organize and analyze data that otherwise would require separate tools, such as a spreadsheet application.
Important
Before you can use the practice files provided for this chapter, you need to install them from the book’s companion CD to their default locations. See "Using the Book’s CD" for more information.
Sorting Project Details
Sorting is the simplest way to reorganize task or resource data in Project. You can sort tasks or resources by predefined criteria, or you can create your own sort order with up to three levels of nesting. For example, you can sort resources by resource group (this is the value in the Group field—Crew, Equipment, and so on) and then sort by cost within each resource group.
Like grouping and filtering, which you will work with in later sections, sorting does not (with one exception) change the underlying data of your project plan; it simply reorders the data you have in the active view. The one exception is the option that Project offers to renumber task or resource IDs after sorting.
It’s fine to permanently renumber tasks or resources if that’s what you intend to do. For example, when building a resource list, you might enter resource names in the order in which the resources join your project. Later, when the list is complete, you might want to sort them alphabetically by name and permanently renumber them.
Each resource in the Short Film Project plan is assigned to one of several resource groups. These groups have names such as Crew, Production, Talent, and other names that pertain to a film production company. For your project plans, you might use resource groups to represent functional teams, departments, or whatever most logically describes collections of similar resources.
Sorting all resources by resource group enables you to see more easily the costs associated with each resource group. This can help you plan your project’s budget. You can also sort resources within each group by cost from most to least expensive.
In this exercise, you sort a resource view.
Important
If you are running Project Professional, you may need to make a one-time adjustment to use the Computer account and to work offline. This ensures that the practice files you work with in this chapter do not affect your Project Server data. For more information, see "Starting Project Professional“.
Note
OPEN Short Film Project 10a from the DocumentsMicrosoft PressProject 2007 SBSChapter 10 Advanced Formatting folder. You can also access the practice files for this book by clicking Start, All Programs, Microsoft Press, Project 2007 Step by Step, and then selecting the chapter folder of the file you want to open.
On the File menu, click Save As.
The Save As dialog box appears.
In the File name box, type Short Film Project 10, and then click Save.
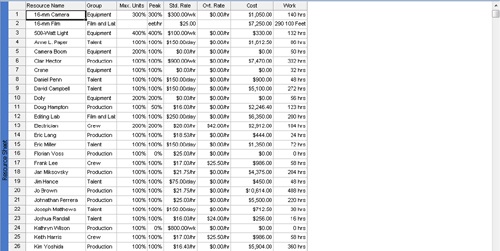
On the View menu, click Resource Sheet.
The Resource Sheet view appears. By default, the Entry table appears in the Resource Sheet view; however, the Entry table does not display the cost field per resource. You will switch to the Summary table instead.
On the View menu, point to Table: Entry, and then click Summary.
The Summary table appears.
You are now ready to sort the Resource Sheet view.
On the Project menu, point to Sort, and click Sort By.
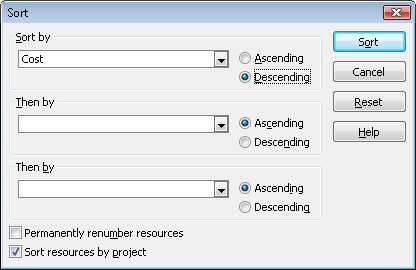
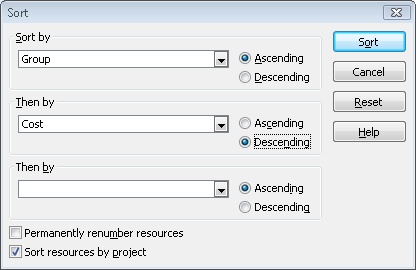
The Sort dialog box appears.
Under Sort By, click Cost on the drop-down list, and next to that, click Descending.
Make sure that the Permanently renumber resources check box is cleared.
Important
The Permanently Renumber Resources (or, when in a task view, the Permanently Renumber Tasks) check box in the Sort dialog box is a Project-level (that is, application) setting; if selected, it permanently renumbers resources or tasks in any Project plan in which you sort. Because you might not want to permanently renumber resources or tasks every time you sort, it’s a good idea to clear this check box.
Click the Sort button.
Tip
You can sort by any field, not just the fields visible in the active view. However, it’s helpful to see the field by which you sort—in this case, the Cost field.
The Resource Sheet view is sorted by the Cost column in descending order.
This arrangement is fine for viewing resource costs in the entire project, but perhaps you’d like to see this data organized by resource group. To see this, you’ll apply a two-level sort order.
Tip
When you sort data, the sort order applies to the active view regardless of the specific table currently displayed in the view. For example, if you sort the Gantt Chart view by start date while displaying the Entry table and then switch to the Cost table, you’ll see the tasks sorted by start date in the Cost table. You can also sort in most views that do not include a table, such as the Resource Graph view.
On the Project menu, point to Sort, and then click Sort By.
The Sort dialog box appears. In it, you can apply up to three nested levels of sort criteria.
Under Sort By, click Group on the drop-down list, and next to that, click Ascending.
Under Then By (in the center of the dialog box), click Cost on the drop-down list, and next to that, click Descending.
Make sure that the Permanently renumber resources check box is cleared.
Click Sort.
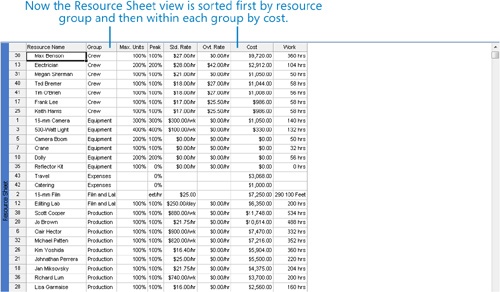
Project sorts the Resource Sheet view to display resources by group (Crew, Equipment, and so on) and then by cost within each group.
This sort offers an easy way to identify the most expensive resources in each resource group working on the short film project.
To conclude this exercise, you’ll re-sort the resource information to return it to its original order.
On the Project menu, point to Sort, and then click By ID.
Project re-sorts the resource list by resource ID.

Note that there is no visual indication that a task or resource view has been sorted other than the order in which the rows of data appear. You cannot save custom sort settings that you have specified as you can with grouping and filtering. However, the sort order you most recently specified will remain in effect until you re-sort the view.
Grouping Project Details
As you develop a project plan, you can use the default views available in Project to view and analyze your data in several ways. One important way to see the data in task and resource views is by grouping. Grouping allows you to organize task or resource information (or, when in a usage view, assignment information) according to criteria you choose. For example, rather than viewing the resource list in the Resource Sheet view sorted by ID, you can view resources sorted by cost. Grouping goes a step beyond just sorting, however. Grouping adds summary values, or “roll-ups,” at intervals that you can customize. For example, you can group resources by their cost with a $1,000 interval between groups.
Tip
In some respects, grouping in Project is similar to the Subtotals feature in Excel. In fact, grouping allows you to reorganize and analyze your Project data in ways that would otherwise require you to export your Project data to a spreadsheet program.
Grouping can significantly change the way you view your task or resource data, allowing for a more refined level of data analysis and presentation. Grouping doesn’t change the underlying structure of your project plan; it simply reorganizes and summarizes the data. As with sorting, when you group data in a view, the grouping applies to all tables you can display in the view. You can also group the Network Diagram view, which does not contain a table.
Project includes several predefined task and resource groups, such as grouping tasks by duration or resources by standard pay rate. You can also customize any of the built-in groups or create your own.
In this exercise, you group resources by their Group name (remember, this is the value in the Group field—Crew, Equipment, and so on). This is similar to the sorting you did in the previous section, but this time you will see summary cost values for each resource group.
On the Project menu, point to Group By: No Group, and then click Resource Group.
Project reorganizes the resource data into resource groups, adds summary cost values per group, and presents the data in an expanded outline form.
Project applies colored formatting (in this case, a yellow background) to the summary data rows. Because the summary data is derived from subordinate data, you cannot edit it directly. Displaying these summary values has no effect on the cost or schedule calculations of the project plan.
This arrangement of the resource cost information is similar to the sorting you did in the previous section. To give yourself more control over how Project organizes and presents the data, you’ll now create a group.
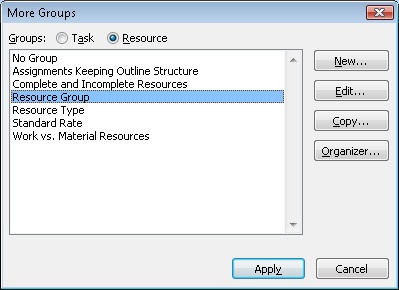
On the Project menu, point to Group By: Resource Group, and then click More Groups.
The More Groups dialog box appears.
In this dialog box, you can see all of the available predefined groups for tasks (when in a task view) and resources (when in a resource view). Your new group will be most similar to the Resource Group, so you’ll start by copying it.
Make sure that Resource Group is selected, and then click the Copy button.
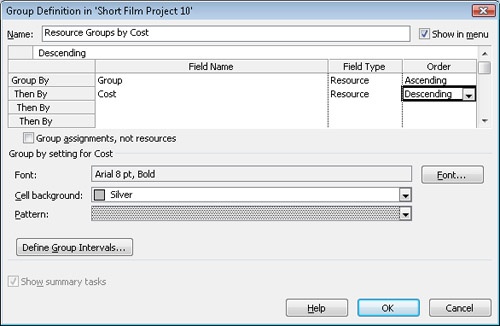
The Group Definition In dialog box appears.
Tip
Notice the default value in the Name field: Copy of Resource &Group. You will change this name shortly, but did you wonder whether the ampersand (&) is a typo? No, it’s a code Project uses in the Name field, where you create what will become a new menu command. The ampersand code precedes the character that will function as the underlined keyboard shortcut for that menu command. You don’t need to specify a keyboard shortcut, but they are handy if you prefer to use the keyboard to access menu commands.
In the Name box, select the displayed text, and then type Resource Groups by Cost.
In the Field Name column, click the first empty cell below Group.
Type or select Cost.
In the Order column for the Cost field, select Descending.
The resources will be grouped based on the values in the Group field, and then by the Cost field from highest to lowest.
Next, you’ll fine-tune the cost intervals at which Project will group the resources.
With the Cost row still selected, click the Define Group Intervals button.
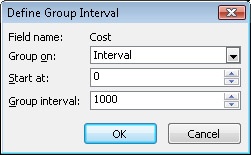
The Define Group Interval dialog box appears.
In the Group on box, select Interval.
In the Group interval box, type 1000.
Click OK.
Click OK again to close the Group Definition in dialog box.
Resource Groups By Cost appears as a new group in the More Groups dialog box.
Click the Apply button.
Project applies the new group to the Resource Sheet view. To get a better look at the groupings, you’ll need to widen the Resource Name column.
Double-click the Resource Name column heading.
The Column Definition dialog box appears.
Click the Best Fit button.
Project widens the Resource Name column.
Tip
Using the Best Fit feature has the same effect as double-clicking the right edge of a column in the column heading to expand the column so that you can see the entire value.
The resources are grouped by their resource group value (the yellow bands that bind together Crew, Equipment, and so on) and within each group by cost values at $1,000 intervals (the gray bands).
To conclude this exercise, you’ll remove the grouping.
On the Project menu, point to Group By: Resource Groups By Cost, and click No Group.
Project removes the summary values and outline structure, leaving the original data. Again, displaying or removing a group has no effect on the data in the project.
Tip
All predefined groups and any groups you create are available to you through the Group By button on the Standard toolbar. The name of the active group appears on this button, which resembles a box with a drop-down list. Click the arrow in the Group By button to see other group names. If no group is applied to the current table, No Group appears on the button.


Filtering Project Details
Another useful way to change the way you view Project task and resource information is by filtering. As the name suggests, filtering hides task or resource data that does not meet the criteria you specify, displaying only the data in which you’re interested. Like grouping, filtering does not change the data in your Project plan; it merely changes the way that data appears.
There are two ways to use filters. You can either apply predefined filters to a view or apply an AutoFilter to a view:
Apply a predefined or custom filter to view or highlight only the task or resource information that meets the criteria of the filter. For example, the Critical Task filter displays only the tasks on the critical path. Some predefined filters, such as the Task Range filter, prompt you to enter specific criteria—for example, a range of task IDs. If a task or resource sheet view has a filter applied, the filter name appears in the Filter button on the Formatting toolbar.
Use AutoFilters for ad hoc filtering in any table in Project. When the AutoFilter feature is turned on, small arrows appear next to the names of column headings. Click the arrow to display a list of criteria by which you can filter the data. Which criteria you see depends on the type of data contained in the column—for example, AutoFilter criteria in a date column include choices such as Today and This month, as well as a Custom option, with which you can specify your own criteria. You use AutoFilter in Project in the same way you might use AutoFilter in Excel.
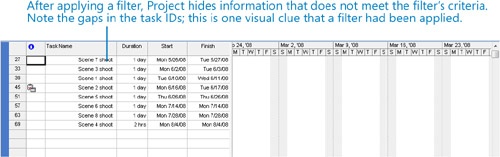
Both types of filters hide rows in task or resource sheet views that do not meet the criteria you specify. You might see gaps in the task or resource ID numbers. The “missing” data is only hidden and not deleted. As with sorting and grouping, when you filter data in a view, the filtering applies to all tables you can display in the view. Views that do not include tables, such as the Calendar and Network Diagram views, also support filtering (through the Filtered For command on the Project menu), but not AutoFilters.
A commonly used format for communicating schedule information on a film project is called a shooting schedule. In this exercise, you create a filter that displays only the uncompleted film shoot tasks. In later sections, you’ll combine this filter with a custom table and a custom view to create a complete shooting schedule for everyone on the film project.
On the View menu, click Gantt Chart.
The Gantt Chart view appears. Before you create a filter, you’ll quickly see the tasks you’re interested in by applying an AutoFilter.
On the Project menu point to Filtered For: All Tasks and then click AutoFilter.
Project displays arrows to the right of the column headings.
Click the down arrow in the Task Name column heading, and then click (Custom...).
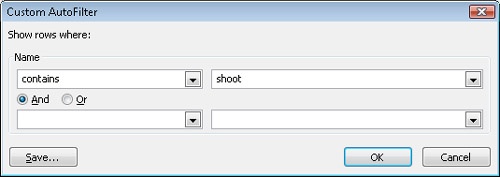
The Custom AutoFilter dialog box appears. You’d like to see only the tasks that contain the word shoot, as in “Scene 3 shoot.”
Under Name, make sure contains appears in the first box.
In the adjacent box, type shoot.
Click OK to close the Custom AutoFilter dialog box.
Project filters the task list to show only the tasks that contain the word shoot and their summary tasks.
Note that the Task Name column heading appears blue. This is a visual indicator that an AutoFilter has been applied to this column.
Next, you turn off the AutoFilter and create a custom filter.
On the Formatting toolbar, click AutoFilter.
Project toggles the AutoFilter off, redisplaying all tasks in the project plan. Now you are ready to create a custom filter.
On the Project menu, point to Filtered For: All Tasks, and then click More Filters.
The More Filters dialog box appears.
In this dialog box, you can see all of the predefined filters for tasks (when in a task view) and resources (when in a resource view) that are available to you.
Click the New button.
The Filter Definition in dialog box appears.
In the Name box, type Uncompleted Shoots.
In the first row in the Field Name column, type or select Name.
In the first row in the Test column, select contains.
In the first row in the Value(s) column, type shoot.
That covers the first criterion for the filter; next, you’ll add the second criterion.
In the second row in the And/Or column, select And.
In the second row in the Field Name column, type or select Actual Finish.
In the second row in the Test column, select equals.
In the second row in the Value(s) column, type NA.
NA means “not applicable” and is the way that Project marks some fields that do not yet have a value. In other words, any shooting task that does not have an actual finish date must be uncompleted.
Click OK to close the Filter Definition in dialog box.
The new filter appears in the More Filters dialog box.
Click Apply.
Project applies the new filter to the Gantt Chart view.
The tasks are now filtered to show only the uncompleted shooting tasks. Because we haven’t started tracking actual work yet, all of the shooting tasks are uncompleted at this time.
Tip
Rather than hiding tasks that do not meet the filter criteria, you can apply blue text formatting to those that do. Click the Highlight button instead of the Apply button in the More Filters dialog box.
To conclude this exercise, you will remove the filtering.
On the Project menu, point to Filtered For: Uncompleted Shoots, and then click All Tasks.
Project removes the filter. As always, displaying or removing a filter has no effect on the original data.
Tip
All filters are also available to you through the Filter button on the Formatting toolbar. The name of the active filter appears in this button; click the arrow next to the filter name to see other filters. If no filter is applied to the current view, All Tasks or All Resources appears on the button, depending on the type of view currently displayed.


Customizing Tables
As you might already know, a table is a spreadsheet-like presentation of project data organized into vertical columns and horizontal rows. Each column represents one of the many fields in Project, and each row represents a single task or resource (or, in usage views, an assignment). The intersection of a column and a row can be called a cell (if you’re oriented toward spreadsheets) or a field (if you think in database terms).
Project includes several tables that can be applied in views. You’ve already used some of these tables, such as the Entry and Summary tables. Chances are that these tables will contain the fields you want most of the time. However, you can modify any predefined table, or you can create a new table that contains only the data you want.
In this exercise, you create a table to display the information found on a shooting schedule—a common format for presenting schedule information in film projects.
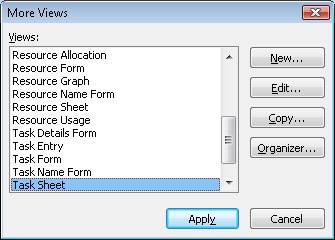
On the View menu, click More Views.
The More Views dialog box appears.
Click Task Sheet, and then click Apply.
Project displays the Task Sheet view.
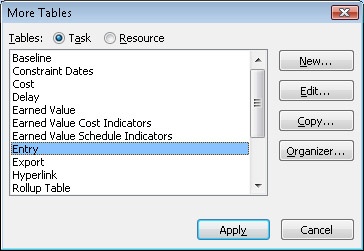
On the View menu, point to Table: Entry, and then click More Tables.
The More Tables dialog box appears.
In this dialog box, you can see all of the available predefined tables for tasks (when in a task view) and resources (when in a resource view).
Make sure that Task is the active option, and then, in the list of tables, make sure that Entry is selected.
Click Copy.
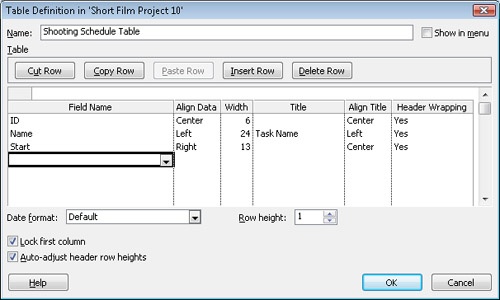
The Table Definition in dialog box appears.
In the Name box, type Shooting Schedule Table.
Next, you will remove several fields, add others, and then put the remaining fields in the order you want.
In the Field Name column, click each of the following field names, and then click the Delete Row button after clicking each field name:
Indicators
Duration
Finish
Predecessors
Resource Names
Next, you will add some fields to this table definition.
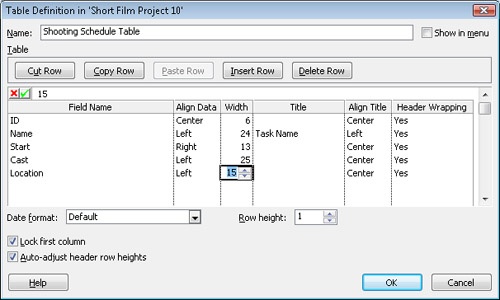
In the Field Name column, click the down arrow in the next empty cell below Start, and then select Cast (Text9) from the drop-down list.
In the Align Data column in the same row, click Left.
As soon as you click in the Align Data column, Project completes row entries for the Cast field name by adding data to the Width and Align Title columns.
In the Width column, type or click 25.
In the Field Name column in the next empty row below Cast, click Location (Text10) on the drop-down list.
In the Align Data column, click Left.
In the Width column, type or click 15.
The two customized text fields Cast (Text9) and Location (Text10) contain the character names and film locations for the shooting tasks. These were previously customized for you in the project plan.
The remaining work to complete this table definition is to reorder the fields to match the order commonly found on a shooting schedule.
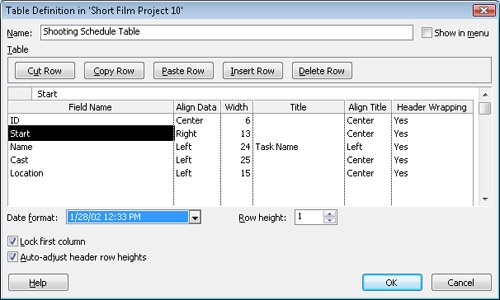
In the Field Name column, click Start, and then click the Cut Row button.
In the Field Name column, click Name, and then click the Paste Row button.
In the Date Format box, click 1/28/02 12:33PM.
This matches the order in which information is commonly listed on a film-shooting schedule.
Click OK to close the Table Definition in dialog box.
The new table appears in the More Tables dialog box.
Click Apply.
Project applies the new table to the Task Sheet view. If the Start column displays pound signs (###) or the values are not fully visible double-click the column headings’ right edge to widen it.
In the next section, you will combine the custom filter with this custom table to create a shooting schedule view for the film project.
Customizing Views
Nearly all work you perform in Project occurs in a view. A view might contain elements such as tables, groups, and filters. You can combine these with other elements (such as a timescaled grid in a usage view) or with graphic elements (such as the graphic representation of tasks in the chart portion of the Gantt Chart view).
Project includes dozens of views that organize information for specific purposes. You might find that you need to see your project information in some way that is not available in the predefined views. If Project’s available views do not meet your needs, you can edit an existing view or create your own view.
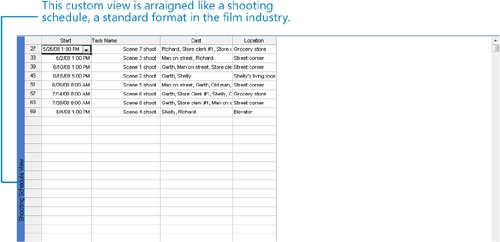
In this exercise, you create a film-shooting schedule view that combines the custom filter and custom table that you created in the previous sections. The view you create will more closely match a standard format used in the film industry.
On the View menu, click More Views.
The More Views dialog box appears.
In this dialog box, you can see all of the predefined views available to you.
Click New.
The Define New View dialog box appears. Most views occupy a single pane, but a view can consist of two separate panes.
Make sure Single View is selected, and then click OK.
The View Definition in dialog box appears.
In the Name box, type Shooting Schedule View.
In the Screen box, select Task Sheet from the drop-down list.
In the Table box, select Shooting Schedule Table from the drop-down list.
The specific tables listed on the drop-down list depend on the type of view you selected in the Screen box in step 5.
In the Group box, select No Group from the drop-down list.
The specific groups listed on the drop-down list depend on the type of view you selected in the Screen box in step 5.
In the Filter box, select Uncompleted Shoots from the drop-down list.
The specific filters listed on the drop-down list depend on the type of view you selected in the Screen box in step 5.
Select the Show in menu check box.
Click OK to close the View Definition in dialog box.
The new view appears and should be selected in the More Views dialog box.
Click Apply.
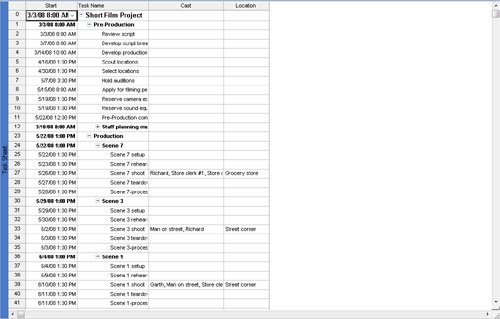
Project applies the new view.
Only uncompleted shoots are now displayed, and the fields appear in an order consistent with a standard shooting schedule for a film project. Also, Project added the Shooting Schedule view to the View menu. This view will be saved with this Project plan, and you can use it whenever you want.
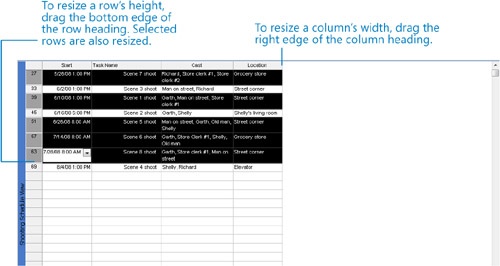
To conclude this exercise, you will adjust row height and column width to display some information that is not currently visible.
While holding down the
 key, click the task ID numbers (not task
names) for tasks 27, 39, 51, 57, and 63.
key, click the task ID numbers (not task
names) for tasks 27, 39, 51, 57, and 63.In each of these selected rows, the names in the Cast column exceed the width of the column.
Drag the bottom edge of the task ID for task 27 down approximately one row.
Tip
While dragging the edge of the task ID, look at the status bar in the lower left corner of the Project window. The status bar indicates the new row height as you drag the edge of the task ID.
Project resizes the selected rows.
Double-click the right edge of the Location column heading.
Project resizes the column width to accommodate the widest value in the column.

Key Points
Common ways of organizing data in Project include sorting, grouping, and filtering. In all cases, Project never deletes the data; it simply changes how it is displayed.
Project includes many built-in sort orders, groupings, and filters, and you can also create your own.
Whereas sorting and filtering rearrange or selectively show only some data in a project plan, grouping adds summary values or “roll-ups” of values, such as costs, based on whatever interval you choose.
Tables are the primary elements of most views in Project. Project includes several built-in tables, and you can also create your own.
You work with data in Project via views. Views may contain tables, groups, filters, and in some cases graphical charts. The Gantt Chart view, for example, consists of a table on the left and a timescaled chart on the right.
Project contains many built-in views, and you can also create your own.