Chapter 14. Viewing and Reporting Project Status
In this chapter, you will learn how to: | |
✓ | Determine which tasks were started or completed late. |
✓ | View task costs at summary and detail levels. |
✓ | Examine resource costs and variance. |
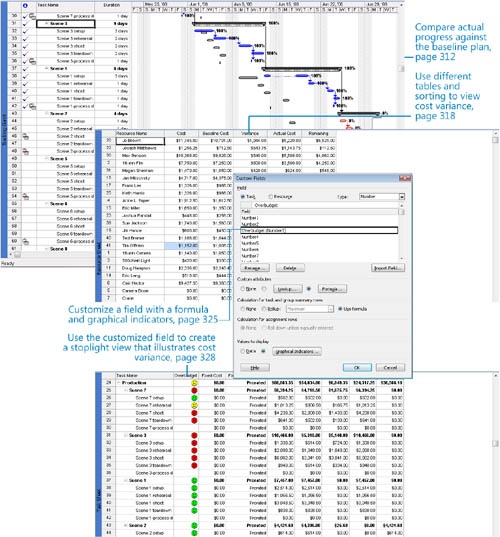
✓ | Use custom fields to create a stoplight view that illustrates each task’s cost variance. |
Tip
Do you need only a quick refresher on the topics in this chapter? See the Quick Reference entries in Viewing and Reporting Project Status.
After a project’s baseline has been set and work has begun, the primary focus of the project manager shifts from planning to collecting, entering, and analyzing project performance details in a tool such as Microsoft Office Project 2007. For most projects, these performance details boil down to three primary questions or vital signs:
How much work was required to complete a task?
Did the task start and finish on time?
What was the cost of completing the task?
Comparing the answers to these questions against the baseline provides the project manager and other stakeholders with a good way to measure the project’s progress and to determine when corrective action might be necessary.
Communicating project status to key stakeholders, such as customers and sponsors, is arguably the most important function of a project manager and one that might occupy much of your working time. Although the perfect flow of communication cannot guarantee a project’s success, a project with poor communications flow is almost guaranteed to fail.
A key to properly communicating project status is knowing the following:
The time to answer these questions is in the initial planning phase of the project. After work on the project is under way, your main communications task will be reporting project status. This can take several forms:
Status reports that describe where the project is in terms of cost, scope, and schedule (these are the three sides of the project triangle, described in Appendix A.)
Progress reports that document the specific accomplishments of the project team
Forecasts that predict future project performance
Where the scheduled or actual project performance differs from the baseline plan, you have variance. Variance is usually measured as time, such as days behind schedule, or as cost, such as dollars over budget. After initial project planning is complete, many project managers spend most of their time identifying, investigating, and, in many cases, responding to variance. However, before you can respond to variance, you must first identify, document, and report it. That is the subject of this chapter.
Tip
This tip describes enterprise project management (EPM) functionality. This chapter describes reporting project status to stakeholders. Project Professional, when used with Project Server, provides more sophisticated ways of not only publishing project status online, but also collecting information (such as actual work) from resources and other stakeholders. To learn more about the enterprise collaboration tools available with Project Server, see Part 4.
Important
Before you can use the practice files provided for this chapter, you need to install them from the book’s companion CD to their default locations. See "Using the Book’s CD" for more information.
Identifying Tasks that Have Slipped
When tasks start or finish earlier or later than planned, schedule variance is the result. One cause of schedule variance is delays in starting or finishing tasks. You’d certainly want to know about tasks that started late or future tasks that might not start as scheduled. It’s also helpful to identify completed tasks that did not start on time to try to determine why this occurred.
There are different ways to view tasks with variance, depending on the type of information you want:
Apply the Tracking Gantt view to graphically compare tasks’ baseline dates with their actual or scheduled dates (on the View menu, click Tracking Gantt).
Apply the Detail Gantt view to graphically show each task’s slippage from baseline (on the View menu, click More Views, then select Detail Gantt).
Apply the Variance table to a task view to see the number of days of variance for each task’s start and finish dates (on the View menu, point to Table, and then click Variance).
Filter for delayed or slipping tasks with the Slipped/Late Progress or Slipping Tasks filters (on the Project menu, point to Filtered For, then point to More Filters and select the filter you want to apply).
In this exercise, you apply some of these and other methods to identify variance.
Important
If you are running Project Professional, you may need to make a one-time adjustment to use the Computer account and to work offline. This ensures that the practice files you work with in this chapter do not affect your Project Server data. For more information, see "Starting Project Professional“.
Note
OPEN Short Film Project 14a from the DocumentsMicrosoft PressProject 2007 SBSChapter 14 Reporting Status folder. You can also access the practice files for this book by clicking Start, All Programs, Microsoft Press, Project 2007 Step by Step, and then selecting the chapter folder of the file you want to open.
On the File menu, click Save As.
The Save As dialog box appears.
In the File name box, type Short Film Project 14, and then click Save.
To begin your analysis of tasks that have slipped, you’ll start at the highest level—the project summary information.
On the Project menu, click Project Information.
The Project Information dialog box appears.
Click the Statistics button.
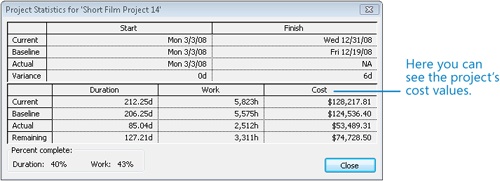
The Project Statistics dialog box appears.
In this dialog box, you can see (among other things) that the project currently has six days of schedule variance on the finish date. In effect, the overall project finish date has slipped out by this number of days.
Click Close to close the Project Statistics dialog box.
For the remainder of this exercise, you will use various techniques to examine the specific task variance.
On the View menu, click Tracking Gantt.
Project displays the Tracking Gantt view.
In the Task Name column, click the name of task 31, the Scene 3 summary task, and scroll the Tracking Gantt view up so that task 31 appears near the top of the view.
On the Standard toolbar, click the Scroll To Task button.
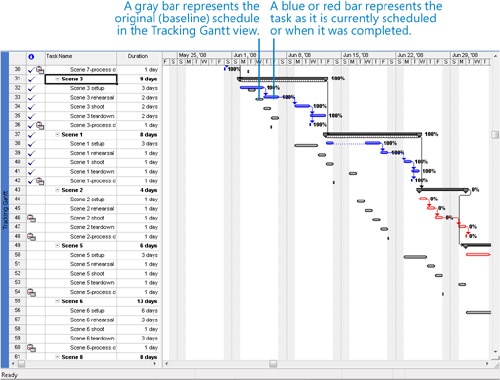
In the chart portion of this view, the tasks as they are currently scheduled appear as blue bars (if they are not critical tasks) or red bars (if they are critical). In the lower half of each task’s row, the baseline values of each task appear as gray bars.
By comparing the currently scheduled Gantt bars with the baseline Gantt bars, you can see what tasks started earlier or later than planned or took longer to complete.
In the Task Name column, click the name of task 37, the Scene 1 summary task.
On the Standard toolbar, click the Scroll To Task button.
Project scrolls the Tracking Gantt view to display task 37 and its adjacent tasks.
Scroll the Tracking Gantt view up so that task 37 appears near the top of the view.
Here, you can see baseline task bars (patterned gray bars), completed task bars (solid blue bars), and bars for tasks on the critical path that are scheduled but not yet not started (red bars).
Tip
To see details about any bar or other item in a Gantt Chart view, position the mouse pointer over it. After a moment, a ScreenTip appears with details.
To focus in on only the slipping tasks, you will apply a filter.
On the Project menu, point to Filtered For: All Tasks, and then click More Filters.
The More Filters dialog box appears. In it, you can see all of the predefined filters for tasks (when in a task view) and resources (when in a resource view) available to you.
In the More Filters box, click Slipping Tasks, and then click the Apply button.
Project filters the task list to show only those tasks that, as they are now scheduled, have slipped from their baseline plan.
In the Task Name column, click the name of task 43, the Scene 2 summary task.
On the Standard toolbar, click the Scroll To Task button.
Note the gaps in the task ID numbers. Tasks 1 through 23, for example, do not appear with the filter applied because they are already complete.
At this point in the schedule, the scheduled start date of tasks has slipped quite a bit. These tasks’ scheduled Gantt bars are formatted red to indicate that they are critical, meaning that any delay in completing these tasks will delay the project’s finish date.
On the Project menu, point to Filtered For: Slipping Tasks, and then click All Tasks.
Tip
You also can click the Filter button on the Formatting toolbar and then click All Tasks from the drop-down list.
Project removes the filter. As always, displaying or removing a filter has no effect on the original data.
The Tracking Gantt view graphically illustrates the difference between scheduled, actual, and baseline project performance. To see this information in a table format, you will display the Variance table in the Task Sheet view.
On the View menu, click More Views.
The More Views dialog box appears.
On the Views list, click Task Sheet, and then click Apply.
Project displays the Task Sheet view. Next, you’ll switch to the Variance table.
On the View menu, point to Table: Entry, and then click Variance.
Tip
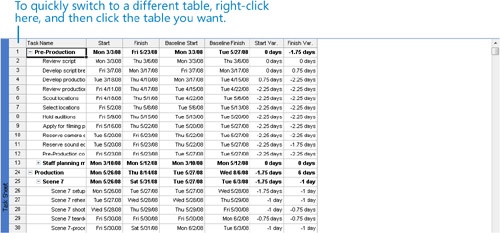
You also can right-click the Select All button in the upper left corner of the active table to switch to a different table.
The Variance table appears in the Task Sheet view.
In this table, you can view the scheduled, baseline, and variance values per task.


Here are some additional tips and suggestions for viewing slipped tasks:
To see a legend of all Gantt bar color coding and symbols, switch to a Gantt Chart view. On the Format menu, click Bar Styles, and in the Bar Styles dialog box, look at the Name and Appearance columns.
All filters are available to you via the Filter button on the Formatting toolbar. The name of the active filter appears in this button; click the arrow next to the filter name to see other filters. If no filter is applied to the current view, All Tasks or All Resources appears on the button, depending on the type of view currently displayed.
You can see the criteria that most filters use to determine which tasks or resources they will display or hide. On the Project menu, point to Filter For: All Tasks, and then click More Filters. In the More Filters dialog box, click a filter and click the Edit button. In the Filter Definition dialog box, you can see the tests applied to various fields for the filter.
The Slipping Tasks report describes tasks that are off-schedule. On the Report menu, click Reports. In the Reports dialog box, double-click Current Activities, and then double-click Slipping Tasks.
In this exercise, you have viewed variance for a task. To see variance for assignments to a task, switch to the Task Usage view, and then apply the Variance table (to see scheduled variance) or the Work table (to see work variance).
Examining Task Costs
The schedule’s status (Did tasks start and finish on time?), although critical to nearly all projects, is only one indicator of overall project health. For projects that include cost information, another critical indicator is cost variance: Are tasks running over or under budget? Task costs in Project consist of fixed costs applied directly to tasks, resource costs derived from assignments, or both. When tasks cost more or less than planned to complete, cost variance is the result. Evaluating cost variance enables you to make incremental budget adjustments for individual tasks to avoid exceeding your project’s overall budget.
Tip
Another way of using project costs to measure past performance and predict future performance is through earned value analysis. For more information, see Chapter 18.
Although tasks and resources (and their costs) are directly related, it’s informative to evaluate each individually. In this exercise, you view task cost variance. Again, you’ll start at the highest level—the project summary information.
On the Project menu, click Project Information.
The Project Information dialog box appears.
Click Statistics.
The Project Statistics dialog box appears.
In the Cost column, you can see the current, baseline, actual, and remaining cost values for the entire project:
Clearly, some cost variance has occurred, but you can’t tell from this information when or where it occurred.
Click Close to close the Project Statistics dialog box.
Next, you will switch to views where you can examine cost variance more closely, starting with the Cost table.
On the View menu, point to Table: Variance, and click Cost.
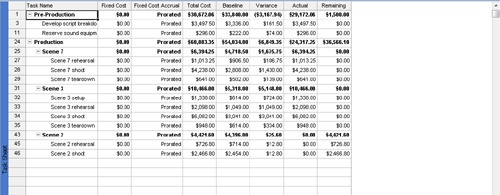
The Cost table appears in the Task Sheet view.
In this table, you can see each task’s baseline cost, scheduled cost (in the Total Cost column), actual cost, and cost variance. The variance is the difference between the baseline cost and the scheduled cost. Of course, costs aren’t scheduled in the same sense that work is scheduled; however, costs derived from work resources (that is, excluding fixed costs and costs associated with material and cost resources) are derived directly from the scheduled work.
Next, you’ll focus on the top-level costs.
On the Project menu, point to Outline, point to Show, and then click Outline Level 1.
Tip
You can also click the Outline button on the Formatting toolbar and then Outline Level 1. The Outline button is labeled with the word “Show.”
Project displays the top three summary tasks, which in this project correspond to the major phases of the short film project. Because we’re currently working on tasks in the Production phase, we’ll direct our attention there.
Click the plus sign next to task 24, Production.
Project expands the Production summary task to show the details for the individual scenes.
Looking at the Variance column, you can see that Scene 7 had some variance, and Scene 3 had significantly more. Next, you’ll focus on the details for Scene 3.
Looking at the Variance column, you can see that the Scene 3 rehearsal and shoot tasks (numbers 33 and 34) account for most of the variance for the Scene 3 summary task. As you may have noticed in the Tracking Gantt view, the actual durations of the Scene 3 rehearsal and shoot tasks were longer than planned, which caused the variance on the task.
To conclude this exercise, you will use filters to help you zero in on tasks that have cost variance.
On the Project menu, point to Outline, point to Show, and then click All Subtasks.
Project expands the task list to show all subtasks.
On the Project menu, point to Filtered For: All Tasks, and then click More Filters.
In the More Filters dialog box, click Cost Overbudget and then click Apply.
Tip
You can also click the Filter box on the Formatting toolbar and then click Cost Overbudget. The Filter box initially contains the value “All Tasks.”
Project filters the task list to show only those tasks that had actual and scheduled costs greater than their baseline costs.
Here again you can see that the Scene 3 tasks have accounted for nearly all cost variance in the schedule so far.
On the Project menu, point to Filtered For: Cost Overbudget, and then click All Tasks.
Project removes the filter.


What caused the task cost variance in the short film project? Because this project’s costs are almost entirely derived from work performed by resources, we can conclude that more work than scheduled has been required to complete the tasks to date.
As we noted earlier, task and resource costs are closely related; in most cases, task costs are mostly or fully derived from the costs of resources assigned to tasks. Examining resource costs is the subject of the next exercise.
Here are some additional tips and suggestions for working with cost data:
To see tasks that are over budget, you can use the Overbudget Tasks report. On the Report menu, click Reports. In the Reports dialog box, double-click Costs, and then double-click Overbudget Tasks.
If you have Excel 2003 or later, you can use the Budget Cost Report. On the Report menu, click Visual Reports. In the Assignment Usage tab of the Visual Reports dialog box, click Budget Cost Report and then click View.
The Cost Overbudget filter and all other filters are also available in the More Filters dialog box (on the Project menu, point to Filtered For: All Tasks, and then click More Filters) as well as the Filter button on the Formatting toolbar.
To see work variance in the Work table, in a task view on the View menu, point to Table, and then click Work. You can also compare timephased baseline and scheduled work in a usage view. For example, in the Task Usage view, on the Format menu, point to Details, and click Baseline Work.
In this exercise, you have viewed cost variance for a task. To see cost variance for assignments to a task, switch to the Task Usage view, and then apply the Cost table.
Examining Resource Costs
Project managers sometimes focus on resource costs as a means of measuring progress and variance within a project. However, resource cost information also serves other people and other needs. For many organizations, resource costs are the primary or even the only costs incurred while completing projects, so closely watching resource costs might directly relate to the financial health of an organization. It might not be a project manager, but instead an executive, cost accountant, or resource manager who is most interested in resource costs on projects as they relate to organizational costs.
Another common reason to track resource costs is for billing either within an organization (for example, billing another department for services your department has provided) or externally. In either case, the resource cost information stored in project plans can serve as the basis for billing out your department’s or organization’s services to others.
Because cost values in the short film project are almost entirely derived from the costs of resource assignments, you’ll look at resource cost variance next.
On the View menu, click Resource Sheet.
The Resource Sheet view appears.
On the View menu, point to Table: Entry and click Cost.
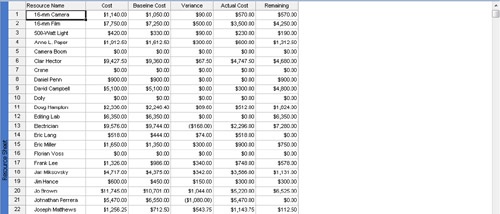
The Cost table appears.
In the Cost table, you can see each resource’s cost, baseline cost, and related cost values. In most cases here, the cost values for work resources are derived from each resource’s cost rate multiplied by the work on their assignments to tasks in the project plan.
Currently, the resource sheet is sorted by resource ID. Next, you will sort it by resource cost.
On the Project menu, point to Sort and click Sort By.
The Sort dialog box appears.
In the Sort By box, click Cost on the drop-down list, and click Descending.
Make sure the Permanently renumber resources check box is cleared, and then click the Sort button.
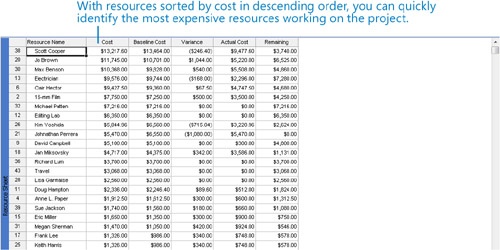
Project sorts the resources by cost from highest to lowest.
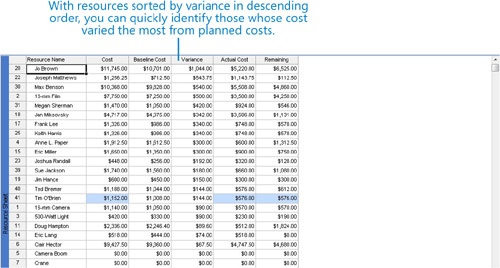
This sort quickly tells you who are the most and least expensive resources (as indicated in the Cost column), but it doesn’t help you see variance patterns. You will do that next.
On the Project menu, point to Sort and click Sort By.
The Sort dialog box appears.
In the Sort By box, click Cost Variance, and make sure Descending is still selected.
Make sure the Permanently renumber resources check box is cleared, and then click Sort.
Project re-sorts the resources by cost variance from highest to lowest.
With the resource list sorted by cost variance, you can quickly zero in on those resources with the greatest variance, and begin to investigate why if you so choose.
On the Project menu, point to Sort, and then click By ID.
Project re-sorts the resources by ID.
Here are some additional tips and suggestions for working with resource costs:
You can use the Overbudget Resources report to list resources who are over budget. On the Report menu, click Reports. In the Reports dialog box, double-click Costs, and then double-click Overbudget Resources.
You can also see timephased cost values in a usage view. For example, in the Resource Usage view, on the Format menu, click Detail Styles. In the Usage Details tab, show the Baseline Cost and Cost fields. This also works in the Task Usage view.
If you have Excel 2003 or later, you can use the Resource Cost Summary Report. On the Report menu, click Visual Reports. In the Resource Usage tab of the Visual Reports dialog box, click Resource Cost Summary Report and then click View.
Reporting Project Cost Variance with a Stoplight View
There are many different ways to report a project’s status in terms of task or budget variance or other measures. There is no shortage of features in Project that support reporting project status, but the main thing to keep in mind is that the method by which you report project status is less a technical question than a communications question. For example, what format and level of detail do your stakeholders need to see? Should project sponsors see different aspects of a project’s performance than those seen by its resources? These questions are central to the project manager’s job. Fortunately, as noted earlier, Project is a rich communications tool that you can use to construct the type of project status information that best meets the needs of your stakeholders.
Tip
Creating a stoplight view involves using formulas in custom fields. Custom fields are a very powerful and flexible feature, and the stoplight view is just one example of what you can do with them. To learn more about custom fields, type About custom fields into the Search box in the upper right corner of the Project window.
In this exercise, you focus on creating what is often called a stoplight report. This status report represents key indicators for tasks, such as schedule or budget status, as a simple red, yellow, or green light. Such status reports are easy for anyone to understand, and they quickly provide a general sense of the health of a project. Strictly speaking, what you’ll create here is not a report in Project, so we’ll call it a stoplight view instead.
On the View menu, click More Views.
The More Views dialog box appears.
Click Task Sheet, and click Apply.
Project displays the Task Sheet view. It currently contains the Cost table.
To save you time, we have customized a field in this Project file containing a formula that evaluates each task’s cost variance. Next, you will view the formula to understand what it does and then view the graphical indicators assigned to the field.
On the Tools menu, point to Customize, and then click Fields.
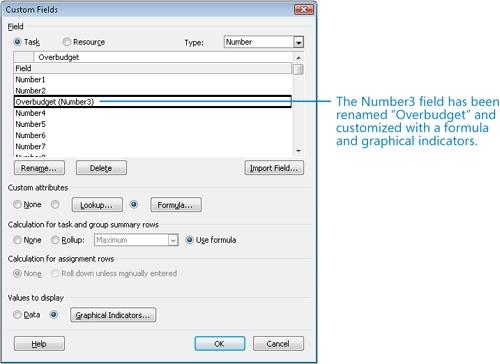
The Custom Fields dialog box appears.
In the Type box in the upper right corner of the dialog box, click Number on the drop-down list.
In the list box, click Overbudget (Number3). This is the customized field we’ve set up for you.
Under Custom attributes, click the Formula button.
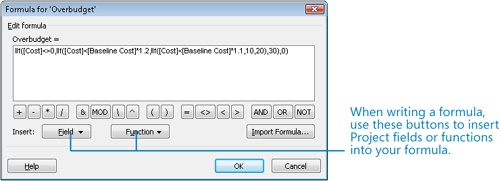
The Formula dialog box appears.
This formula evaluates each task’s cost variance. If the task’s cost is 10% or less above baseline, the formula assigns the number 10 to the task. If the cost is between 10% and 20% above baseline, it is assigned a 20. If the cost is more than 20% above baseline, it receives a 30.
Click Cancel to close the Formula dialog box.
In the Custom Fields dialog box, under Values to display, click the Graphical Indicators button.
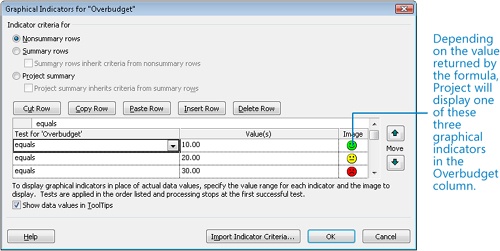
The Graphical Indicators dialog box appears. Here, you specify a unique graphical indicator to display, depending on the value of the field for each task. Again, to save you time, the indicators are already selected.
Click the first cell under the Image column heading (it contains a green smiley face), and then click the drop-down arrow.
Here you can see the many graphical indicators that you can associate with the values of fields.
Click Cancel to close the Graphical Indicators dialog box, and then click Cancel again to close the Custom Fields dialog box.
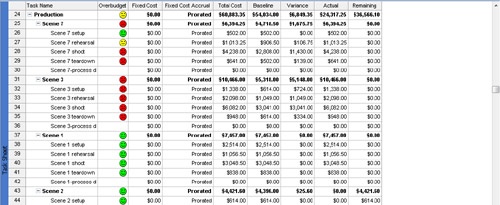
To conclude this exercise, you will display the Overbudget (Number3) column in the Cost table.
Click the Fixed Cost column heading.
On the Insert menu, click Column.
The Column Definition dialog box appears.
In the Field Name box, click Overbudget (Number3) on the drop-down list, and then click OK.
Project displays the Overbudget column in the Cost table.
Scroll the Task Sheet view down to display task 24, the Production summary task and its subtasks.
As each task’s cost variance changes, so do the graphical indicators according to the ranges specified in the formula. This is a handy format for identifying tasks whose cost variance is higher than you’d like, as indicated by the yellow or red lights.
Up to now, you’ve identified schedule and budget variance in a task view and budget variance in a resource view—each an important measure of project status. This is a good time to remind yourself that the final qualifier of project status is not the exact formatting of the data in Project, but the needs of your project’s stakeholders. Determining what these needs are requires your good judgment and communication skills.
Key Points
Schedule variance is caused by tasks that have slipped from their planned start or finish dates (as recorded in a baseline). You can use a combination of views, tables, filters, and reports to identify which tasks have slipped and caused variance.
Schedule and cost variance are closely related—if a project plan has one, it likely has the other. As with schedule variance, you can apply a combination of views, tables, filters, and reports to locate cost variance.
You can use formulas and graphical indicators in custom fields to create a highly customized view, such as a stoplight view, to communicate key project health indicators to your stakeholders.