
38. Packaging, Testing, and Debugging Add-ins
Creating an Add-in Installation Package
If you’re going to write add-ins, you’re going to have to deal with software bugs. Even the simplest add-in is likely to contain bugs, so testing and debugging your add-ins is a must. However, before you can test and debug an add-in, you need to install the add-in.
If you used the Add-in Builder to create your add-in manifest, installation of the add-in is done automatically for you. However, you’ll still want to create an installation package so that others can install your add-in.
![]() For more information on using the Add-in Builder, see “Creating the Manifest with the Add-in Builder,” p. 662.
For more information on using the Add-in Builder, see “Creating the Manifest with the Add-in Builder,” p. 662.
Note
![]()
A great place to share your add-in is the Microsoft Expression Gallery at http://gallery.expression.microsoft.com/.
Tip
![]()
You cannot double-click on an .xadd file to install an add-in. To install an add-in, you need to use the Manage Add-ins dialog in Expression Web.
Creating an add-in installation package is easy to do. Simply zip the folder that contains your add-in files and then change the file extension to .xadd. (You’ll need to ensure that Windows is configured to show file extensions.) You can create a zip file by right-clicking on your add-in’s folder and selecting Send To, Compressed (zipped) Folder from the menu. Once the folder has been zipped, change the file extension of the Zip file to .xadd. Your add-in is now ready for installation.
Testing and Debugging Add-ins
You’ve spent many hours developing a really cool add-in, and you’re eager to upload it to the Expression Gallery so that other Expression Web users can use it. However, before you do, you should spend some time testing and debugging your add-in so that users don’t experience problems. Even if your add-in is completely free, if users experience problems, they will complain and make sure to let other users know about their trouble. Testing and debugging are critical to the success of any add-in.
Testing Add-ins
The easiest way to test an add-in is to use it yourself during your normal usage of Expression Web. However, that’s not the best way. It’s likely that other people who may use your add-in (assuming you decide to share it with others) use Expression Web differently than you do. Subtle changes in the way that an add-in is used can expose serious bugs that you’ll want to deal with before you share your add-in with others.
The specific scenarios you use when testing your add-in will differ depending on the complexity of your add-in. For example, testing the Page Info add-in was fairly simple because the act of opening and closing pages causes all the JavaScript functions used by the add-in to execute. However, when you’re dealing with a more complex add-in, you may have JavaScript functions that execute only when certain conditions are met. In these situations, it’s usually best to build a test page that’s designed to call each of your functions. If an error is encountered, you can then debug the error more easily.
Tip
![]()
Keep in mind that how any particular function works is often impacted by external factors. Create as many test scenarios as you can when testing your functions. This section gives you some pointers on how to do that.
I follow some general rules when testing all of my add-ins:
• Test the add-in with disk-based sites, FTP sites, and HTTP sites.
• Test the add-in with pages at numerous folder levels within my site.
• Test the add-in with no sites open in Expression Web.
• If the add-in requires user input, conduct tests with no input and with bogus input.
• Find people willing to test the add-in for me and provide feedback.
I find (and fix) plenty of problems when going through the first four of these rules, but I’m always amazed at how many problems I miss that are uncovered by other people using my add-ins. Regardless of how much effort you put into predicting how users will use your add-in, you will still encounter a surprising number of unexpected scenarios once your add-in gets into the hands of users.
When you provide your add-in to testers, make sure that you give them some guidelines for reporting bugs. For example, let them know that you need detailed, step-by-step instructions for reproducing any problems they encounter. Provide an example of a bug submission so that they’ll know what you expect. If you don’t, you often won’t get enough detail to reproduce a particular problem.
As an example, the following steps are not sufficient to reproduce a problem:
- Opened my site.
- Started editing my page.
- Got the error message.
However, the following steps would likely allow you to reproduce a problem and get it corrected:
- Opened a site at http://www.mysite.com.
- Opened aboutme.htm from the root folder.
- Switched to Design View.
- Added the text “Click Here for Info”.
- Selected the text and clicked the Insert Hyperlink button in Expression Web.
- Added a hyperlink to moreinfo.htm in the root folder of the site.
- Clicked outside that hyperlink and got the error.
If you provide your testers with examples of what you expect, you’ll get better information from them.
It’s also important that you understand a tester’s expectation compared with what was experienced when encountering a problem. Not all problems that testers encounter are actually bugs. When a tester encounters a problem, your add-in may be operating exactly the way you designed it, but your design may not be what the tester expects. For that reason, I like to have testers include steps that were performed, what was expected, and what actually happened.
Once you are able to reproduce a problem, you can then debug it and fix it. Let’s review some of the tools available for debugging add-ins.
Tip
![]()
No amount of testing can identify all software bugs. Even simple add-ins are likely to be released with some undiscovered bugs.
Debugging Add-ins Using Expression Web
Debugging is the process of identifying and fixing problems in software. You can debug your add-ins from within Expression Web using a couple of different tools: the Extensibility Tester and debug consoles.
The Extensibility Tester
The Extensibility Tester is an add-in developed by Microsoft for testing the JavaScript API. Using the Extensibility Tester, you can test JavaScript code easily outside your add-in project. For example, suppose your add-in needs to get the path of the file currently open in Expression Web, but you aren’t sure whether you want to use xweb.document.filename or xweb.document.location. Using the Extensibility Tester, you can evaluate each of these to determine which property is appropriate for your particular situation.
You can download the Extensibility Tester from http://gallery.expression.microsoft.com/en-us/ExtensibilityTester. After you download and install it, select Panels, Extensibility Tester to open it. The Extensibility Tester is divided into four windows:
• Input—Expressions to evaluate are added here. To evaluate an expression, click the Evaluate button.
• Output—If no error occurs when evaluating the expression, the result is displayed here.
• Error—If an error occurs when evaluating the expression, the error is displayed here.
• Events—Displays events in real-time.
![]() For more information on events, see Chapter 39, “Expression Web 4 JavaScript API Reference.”
For more information on events, see Chapter 39, “Expression Web 4 JavaScript API Reference.”
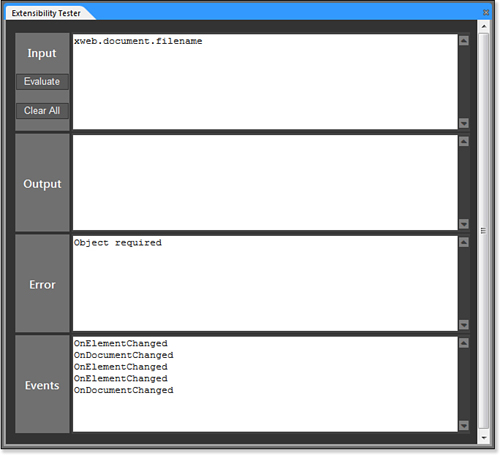
In Figure 38.1 the expression xweb.document.filename is being evaluated. Because a file is not currently open in Expression Web, “Object required” is displayed in the Error window. An “Object required” error means that the JavaScript expression refers to an object that doesn’t exist. In this case, the xweb.document object doesn’t exist because a file isn’t open in Expression Web.
Figure 38.1. The Extensibility Tester add-in makes it possible to test JavaScript expressions easily.
In some cases, the output you get from the Extensibility Tester may not be sufficient to resolve a problem. For example, in Figure 38.2, the following code is being evaluated:
xweb.document.getElementsByTagName("div")
Figure 38.2. The output from the Extensibility Tester isn’t always as helpful as you might want it to be.
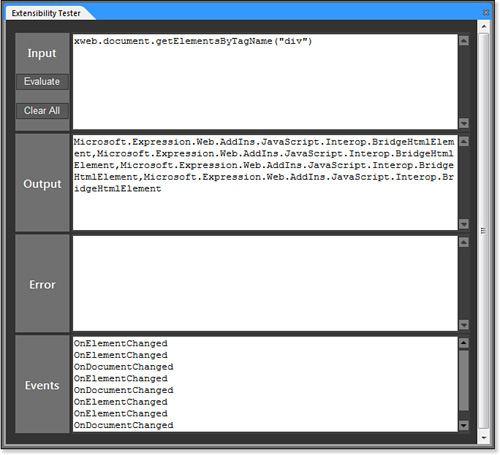
The Output window displays the value Microsoft.Expression.Web.AddIns.JavaScript.Interop.BridgeHtmlElement four times. (The BridgeHtmlElement object is an internal object that Expression Web uses to identify an HTML element.) If I want to find out additional information about a particular div, I need to change my input to refer to a particular element. The getElementsByTagName method returns a zero-based array of elements, so I can use the following code to get a reference to the first div on the page:
xweb.document.getElementsByTagName("div")[0]
Tip
![]()
The Extensibility Tester is a great way to experiment with the JavaScript API and learn more about how to develop add-ins.
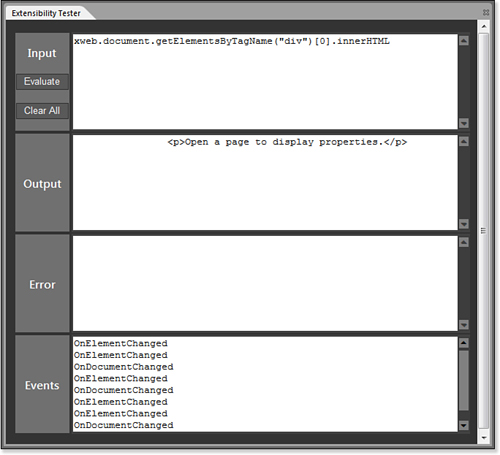
Figure 38.3 shows the output obtained when evaluating the innerHTML property of the first div on the page.
Figure 38.3. By using a more specific input string, I am able to get useful information about a particular div.
Debug Consoles
If your add-in is in developer mode, you can use the debug console to aid in debugging your add-in. To access the debug console for your add-in, select it from the Panels menu in Expression Web. The menu item for your add-in’s debug console will be named using the name of your add-in’s folder. Therefore, if your add-in is installed into the C:UsersjimAppDataRoamingMicrosoftExpressionWeb 4AddinsMyAddin folder, the debug console can be opened by selecting Panels, MyAddin (console).
Tip
![]()
As discussed in Chapter 36, “Expression Web 4 Add-in Basics,” to specify that an add-in run in developer mode, set the developer attribute in the manifest’s addin element to yes.
Tip
![]()
If an error is encountered in your manifest (and when some other errors occur), Expression Web creates a file called errors.txt in the root of your site that contains the error message.
The debug console displays some error information automatically. For example, if your add-in’s manifest contains errors, the debug console may display helpful information about the error. However, you can also use the xweb.developer object to write directly to the debug console.
The xweb.developer object has two methods that can be used to write content to the debug console:
• xweb.developer.write(string)—Displays the value passed as a string in the debug console. The string value can either be an explicit string or an expression that evaluates to a string.
• xweb.developer.writeLine(string)—Equivalent to the write method except that writeLine includes a carriage return at the end of the string so that each string appears on a new line.
Consider the following code snippet:
![]()
Suppose that when this code runs, the hyperlink created within the div points to a URL that’s not what I expect. By adding a call to xweb.developer.write, you can easily determine the value of loc.href before you use it in your code. Here’s the same code with an additional line that writes the value of loc.href to the debug console.
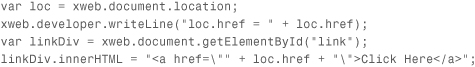
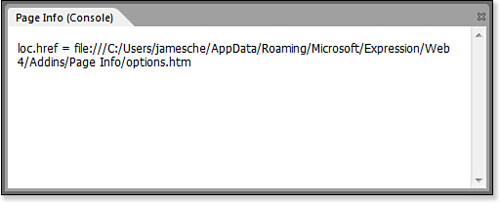
Figure 38.4 shows the contents of the debug console when this code is run.
Figure 38.4. The debug console displaying the value of loc.href.
Debugging Add-ins Using Visual Studio
The debug console and Extensibility Tester are nice tools for troubleshooting add-ins, but if you really want a full-featured debugger, Visual Studio is your best choice.
To debug your add-in in Visual Studio, follow these steps:
- Open Internet Explorer and select Tools, Internet Options.
- Click the Advanced tab.
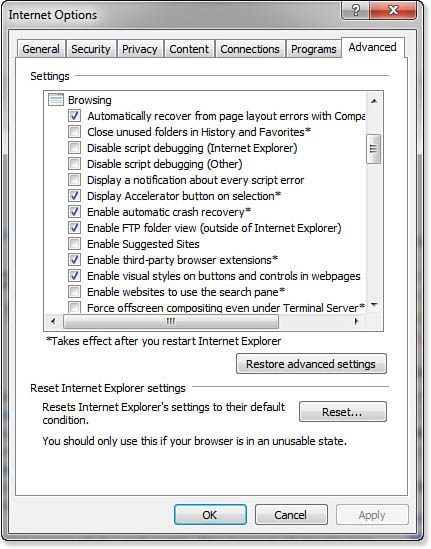
- Uncheck Disable Script Debugging (Internet Explorer).
- Uncheck Disable Script Debugging (Other). Your Internet Options dialog should look like the one shown in Figure 38.5.
Figure 38.5. You need to uncheck both Disable Script Debugging check boxes in Internet Explorer before you can debug your add-in.
- Click OK.
- Ensure that all panels and dialogs for your add-in are closed and close Expression Web.
- Launch Visual Studio and open the file that contains the script you want to debug.
- Right-click on the line where you want a breakpoint and select Breakpoint, Insert Breakpoint.
- Launch Expression Web, but do not open your add-in’s panel or dialog box.
- Switch back to Visual Studio and select Debug, Attach to Process.
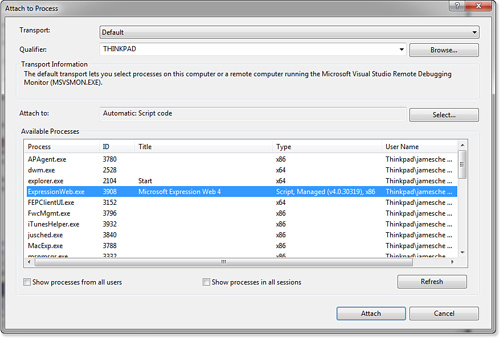
- Locate ExpressionWeb.exe in the Available Processes window and make sure that Script appears in the Type column as shown in Figure 38.6. If it does, proceed to step 15.
Figure 38.6. Make sure that Visual Studio is configured to debug scripts.
- If Script does not appear in the Type column, click the Select button.
- Select the Debug These Code Types radio button and check the Script check box.
- Click OK.
- Select ExpressionWeb.exe from the Available Processes list and click the Attach button.
- Switch back to Expression Web and access your add-in.
Note
![]()
Expression Web add-ins actually run inside an Internet Explorer control. That’s why you need to ensure that script debugging is enabled in Internet Explorer before you can debug your add-ins in Visual Studio.
Note
![]()
Thanks to John Dixon on the Expression Web product team for documenting details on how to do this on his blog. You can read John’s blog post at http://blogs.msdn.com/b/jdixon/archive/2010/09/02/debugging-javascript-add-ins-within-expression-web-4.aspx.
At this point, Visual Studio should break into the process when your breakpoint is hit and you’ll have access to all of the debugging tools available in Visual Studio.
Using this method, you can set a breakpoint and debug from that point. However, you can also use Visual Studio to debug unexpected errors that may occur while testing your add-in.
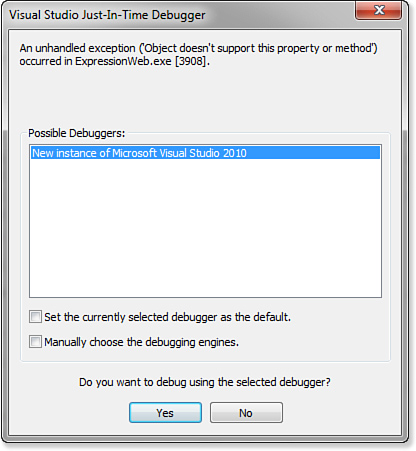
Once you have script debugging enabled in Internet Explorer, when a script error is encountered, you are asked whether you want to debug the file containing the script as shown in Figure 38.7. If you click Yes, the Visual Studio Just-In-Time Debugger dialog displays and you can choose a debugger as shown in Figure 38.8. Choose New Instance of Visual Studio 2010 and click Yes to debug your add-in. (Your version of Visual Studio may differ.)
Figure 38.7. Internet Explorer displays a script error dialog when script debugging is enabled.
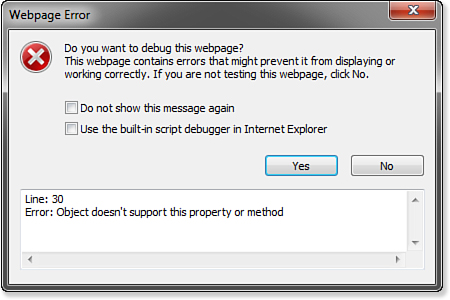
Figure 38.8. The Visual Studio JIT debugger can debug scripts that generate errors.
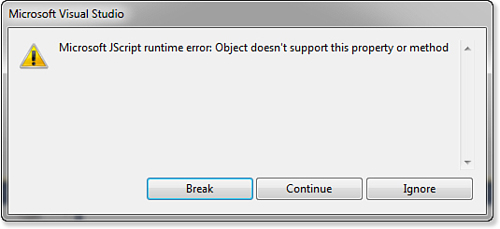
When Visual Studio launches, it automatically attaches the debugger to Expression Web, and the script error is displayed as shown in Figure 38.9. Click Break and Visual Studio breaks at the point where the error occurred.
Figure 38.9. The script error is displayed within Visual Studio. Clicking Break allows you to debug it.
Note
![]()
You can read details on all of Visual Studio’s debugging tools at http://msdn.microsoft.com/en-us/library/sc65sadd.aspx.
Summary
In this chapter, you familiarized yourself with the tools available for troubleshooting and debugging your add-ins. You now have all the skills necessary for developing and debugging add-ins in Expression Web. However, we’ve only touched on the capabilities of the JavaScript API.
In the next chapter, you’ll find a complete reference on the Expression Web 4 JavaScript API. The API reference is designed to be a valuable tool for looking up information on the API while you’re developing add-ins. However, it’s also helpful to read the reference so that you can familiarize yourself with all the capabilities of the JavaScript API.