
Chapter 2
Acoustic Antennas for Biomedical and
Industrial Ultrasonic Imaging1
2.1. Introduction
Acoustic antennas designed for ultrasonic imaging – generally referred to as array transducers – are used for a wide variety of applications including medical diagnostics and non-destructive testing. Their success is linked to the non-ionizing character, low cost and versatility of ultrasound and to the fact that such images and measurements contain data linked to several physical and structural parameters of the explored media. The antenna properties – both electroacoustic, such as sensitivity and bandwidth, and acoustic, i.e. radiated field – determine most of the imaging system’s performance. The exceptional improvements in image quality and development of various ultrasonic imaging modalities in the past 30 years have been made possible by the higher performance of new acoustic antennas. Technological breakthroughs, particularly in new functional materials, are at the center of such improvements.
This chapter will first review the operation principles of simple ultrasonic transducers; then more complex antennas, namely array transducers, will be considered. Material issues will be discussed, particularly those of the piezoelectric materials which are the core of most acoustic antennas. Finally, recent developments such as high frequency arrays and devices based on electrostatic forces (capacitive micro-machined ultrasonic transducers) will be addressed.
2.2. Basic ultrasonic transducers
2.2.1. Transducer performance
Ultrasonic transducer performance is a multi-parameter issue [KOS 66, DES 78]. In this section, simple definitions are given in order to justify the choices we have to make when designing a transducer.
Transducer performance can be described by considering three main issues: – electrical input impedance;
– electroacoustic response;
– radiation pattern.
It must be noted that many other issues exist, among others electromagnetic compatibility (EMC), operation temperature and homogeneity of elements in arrays. These are outside the scope of this chapter, so they will only be addressed through specific cases in the following sections when necessary.
The electrical input impedance must be matched to its driver and receiver electronics as well as the cable’s characteristic impedance to optimize electrical energy transfer. The transducer input impedance is linked to the properties of its constitutive materials, its size and geometry. The main variable that can be used to adjust it is the piezoelectric material dielectric constant. Indeed, most other parameters are imposed by the electroacoustic and radiation requirements. In some cases like broad-bandwidth electrical matching, electrical elements such as transformers and/or inductors are used.
The pulse-echo response represents the signal (or echo) received following a short electrical pulse excitation of the transducer with a perfect reflector placed in front of it, at a relatively short distance. The transducer sensitivity as well as signal-to-noise ratio and depth of penetration are functions of the amplitude of the echo. It is generally measured as an insertion loss as defined in electronics, i.e. the ratio in dB of the amplitude of the echo to that of an ideal transducer. The time duration of the echo, measured at half its amplitude, defines the axial resolution. In imaging applications, this resolution represents the inverse of the smallest distance at which two point-targets placed one behind another can be distinguished. This distance typically ranges from one wavelength, the theoretical maximum resolution, to three wavelengths. This is in the mm range for most medical imaging and NDE applications using 2-10 MHz frequencies.
The measurement of the radiation pattern of a transducer can be given by the spatial distribution of acoustic pressure in transmit or pulse-echo mode. The pulse-echo mode is often used to be closer to the actual use of most transducers. The echo amplitude is plotted as a function of the target position. The size of the target must be sufficiently small to be considered as a point target. Lateral resolution, depth of field and level of acoustic noise can then be quantified. The lateral resolution is determined by the half-width of the acoustic beam and corresponds to the lateral resolution, but in a direction perpendicular to that of the wave propagation. Lateral resolution, which is typically lower than the axial resolution, changes with depth, i.e. distance to transducer surface. The depth of field, which is similar to that of an optical camera, is defined by the half-width of the acoustic beam along the transducer axis and determines mainly the distance range of the transducer. Finally, the acoustic noise of the transducer is defined by the amplitude of echoes produced by a target, placed off-axis.
Ideally, a transducer should have a matched electrical input impedance, sensitivity, axial & lateral resolution, depth of field as high as possible and acoustic noise as low as possible. Unfortunately, trade-offs will have to be resolved because of several contradictory requirements. For example, the high damping of transducer resonance allows a very high axial resolution but will reduce its sensitivity. In the following section the focus will be on electroacoustic responses of transducers.
2.2.2. Single-element transducer design
The geometry and size of the piezoelectric element are of great importance, since they influence all transducer properties. In particular, the main vibration mode of the structure is selected by the geometry and the operating frequency by the size. It must be noted that different types of materials perform better in some vibration modes than in others. This will often govern the choice of the material type. In most cases, PZT-based compositions or PZT-polymer composites offer the best compromise for the vibration modes used in medical diagnosis and NDE applications. This will be addressed for specific designs in the following sections.
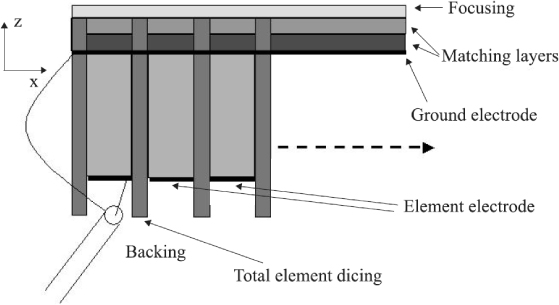
The classical single-element transducer (Figure 2.1) is based on a piezoelectric plate or disc poled along the thickness direction and used in its thickness mode, so its thickness defines the resonance frequency of the device through the equation: thickness = half wavelength. When an electrical impulse is applied to the plate, an acoustical resonance is induced, which will lead to the generation of pressure waves both in the front and back directions. Since the reflection coefficient is very high – typically a piezoceramic has a high acoustic impedance (~ 33 MRa) compared to that of biological tissues or water (1.5 MRa) – this acoustic mismatch implies a long duration of the acoustic resonance. Thus, a piezoceramic plate alone would lead to a very poor axial resolution. Consequently, other layers are added to the active layer [KOS 66].
Figure 2.1. Schematic diagram of a classical single-element transducer
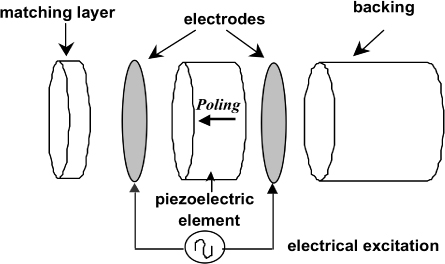
Figure 2.2. Impulse responses of a light-backed (Z=4 MRa) and a heavy-backed (Z=10 MRa) piezoceramic disc
On the rear face of the active element, a thick layer, referred to as the backing, is usually added to damp the transducer resonance. The closer its acoustical impedance is to that of the active layer, the more acoustic energy flows by the rear face and is lost. The attenuation coefficient and the thickness of the backing layer must be sufficient so that no energy can be radiated back to the active layer, which would produce parasitic echoes. Thus, a trade-off has to be found for each application as the backing implies a lower sensitivity but a higher axial resolution. Figure 2.2 shows the response of a simple transducer made from a piezoceramic disc and a light backing (acoustical impedance of 4 MRa) and another transducer with a heavy backing (acoustical impedance of 10 MRa).
To increase the transfer of energy from the active layer to the propagation medium, one or several matching layers are used [DES 78]. Thickness of around a quarter-wavelength and intermediate acoustic impedance enables the acoustic energy to flow better towards the propagation medium. The consequence is that the use of matching layers improves both the sensitivity of the transducer and its axial resolution (Figure 2.3). The use of multiple matching layers [INO 87] produces further improvement of transducer performance, but cost and technical complications often limit their number to only two.
Figure 2.3. Impulse responses of a light-backed (Z=4 MRa) piezoceramic disc without and with a matching layer
2.2.3. Material aspects
The piezoelectric material is typically a PZT-based material, while polymer-based materials are used for matching layers and backings. In section 2.4, we will consider properties of the available piezoelectric materials like ceramic-polymer composites that are widely used in modern transducers.
For the backing, in order to adjust attenuation and acoustic impedance, high loss polymers such as viscoelastic attenuative epoxy resins with an addition of different particles are used. To increase acoustic impedance (the so-called heavy backing), metal particles such as tungsten are currently used [NGU 96].
On the contrary, hollow plastic spheres are used to obtain light backings. To achieve attenuation through scattering and prevent parasitic echoes, the size of the particles must be much lower than the wavelength. To achieve very high attenuation without large variations of acoustic impedance, mixtures of several different types of particles are used. The thickness of the backing layer can then be reduced, which allows us to achieve miniaturization of the transducer.
For matching layers, losses must be kept as low as possible to avoid a transducer sensitivity decrease. Consequently, low-loss polymers like hard setting epoxy resins are preferred here [NGU 96]. A single type of particle is then added to adjust the acoustic impedance [INO 87].
2.2.4. Radiation of single-element transducers
The simplest transducer used for imaging applications is a single element transducer, the scanning being achieved by a motor. The specific case of transducers designed for high-resolution medical imaging will be presented in section 2.6.
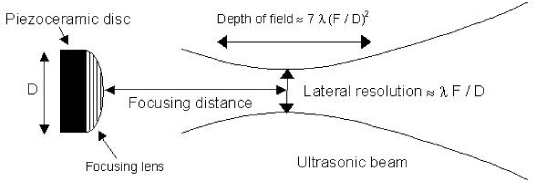
A lens is often used to focus the acoustic waves. The radiation pattern of singleelement transducers is then defined by the size of the active element and the lens curvature.
Figure 2.5 shows an approximate radiation pattern with the following formulas in which D is the diameter of the piezoelectric element disc, F is the focusing distance of the lens and λ is the wavelength (ratio of speed of sound to resonance frequency): lateral resolution ≈ λ F / D at the focal distance and depth of field ≈ 7 λ (F / D)2. A particular case is a transducer without a lens, for which the “natural focus” is ![]() called its Fresnel distance. Its lateral resolution is then D/4.
called its Fresnel distance. Its lateral resolution is then D/4.
Figure 2.5. Radiation pattern of a single-element transducer with a focusing lens
2.3. Transducer arrays
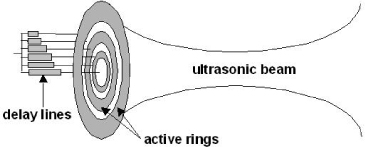
With single-element transducers, we can only obtain one focal distance so they can only be used in a very limited range of distances. All structures situated at distances either significantly lower or significantly higher than the focus will produce a blurry image. Annular arrays were designed [POW 80] (Figure 2.6) to produce dynamic focusing and were used in many commercial imaging systems during the 1980s. Here, time delays are applied to the electrical excitation of each ring to focus the acoustic wave. The focal distance can thus be adapted to the region of interest. Moreover, the time delays can be continuously adapted when receiving the echoes. Thanks to this procedure, much larger ranges of depths can be imaged with good lateral resolution compared to imaging with single element transducers.
Figure 2.6. Operation of an annular array
Today because of the need for a mechanical device to scan the ultrasonic beam, annular arrays are mainly replaced by linear, curved or phased arrays, except for low-cost systems or for niche applications. Then, in most of the current imaging systems, the scanning of the acoustic beams is obtained by electronic means that are very reliable.
Linear arrays typically consist of 200 elements, each element having a width (along the largest dimension of the array) of around 1 to 2 wavelengths and a length (elevation direction) of several tens of wavelengths. The scanning is produced by multiplexing the selection of a number of active elements. A radiating aperture consisting of a given number of selected neighboring elements is used for a given line of the image. The following line is then obtained by using multiplexing circuits to simply shift this aperture one pitch, i.e. the distance between the centers of two adjacent elements. The image frame rate is then only limited by the time needed for the ultrasound wave to propagate from the transducer to the deepest structures of interest and return back from where it originated. Linear arrays can either be flat or curved, which gives either rectangular or conical shaped images (Figure 2.7). Dynamic focusing, as described for annular arrays, is obtained by electronic delay lines in the scanning direction and a fixed focus is obtained by a lens in the elevation direction.
Figure 2.7. Operation of linear, planar and curved array transducers
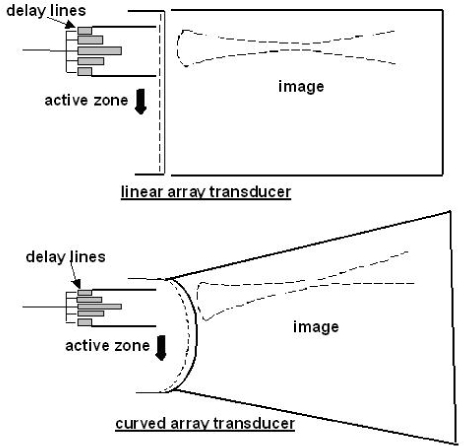
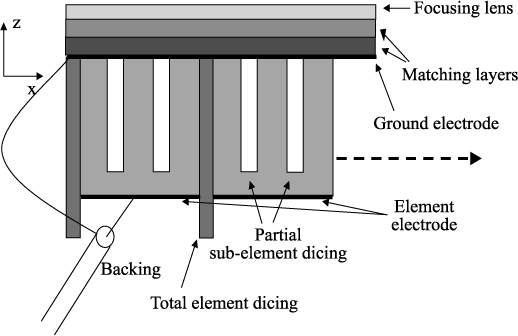
Figure 2.8 shows the internal structure of such arrays. In the case of arrays based on bulk piezoelectric ceramics, the geometry of one element implies parasitic vibration modes so each array element must be cut into a few sub–elements. Nevertheless the “electrical pitch” of the array is higher than its mechanical pitch because these sub–elements are electrically connected. To ensure vibration between elements is independent, mechanical inter–element coupling must be limited. A deep dicing cut is then performed between neighboring elements and filled with an attenuative material. The use of piezocomposites with 1–3 connectivity sufficiently reduces the inter-element coupling to avoid sub-dicing, and in some cases, even dicing between elements can be suppressed.
Figure 2.8. Internal structure of a planar and curved array transducer
When the acoustic window is small, which provides difficult access to the explored media, such large arrays cannot be used. For example, to obtain images of the heart, the ribs limit the acoustic window. To obtain the images, a scanning method based on electronic delays rather than multiplexing is deployed and phasedarray transducers are used (Figure 2.9). Here, the time delays are used not only to focus but also to steer the beam (typically +/− 45 degrees). Since all elements of the array are used for each line of the image, they must be able to radiate energy at large steering angles. A typical design criterion is a width equal to half a wavelength, which ensures in principle a radiation pattern without parasitic grating lobes so the width of phased-array elements must be lower than that of classical linear arrays. The internal structure of a typical phased array is shown in Figure 2.10.
Figure 2.9. Operation of a phased array transducer
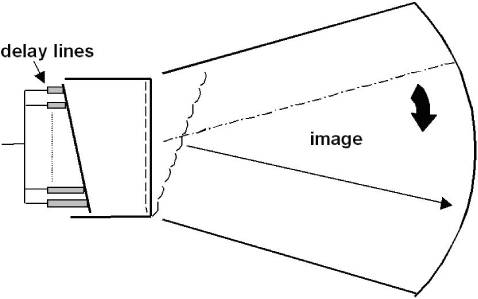
Figure 2.10. Internal structure of a phased array transducer
More advanced antennas are on the market today. Figure 2.11 a) and b) respectively show the front view structure of 1.5D and 2D matrix antennas.
Figure 2.11. Internal structure of an a) 1.5D antenna (front view) and b) 2D antenna
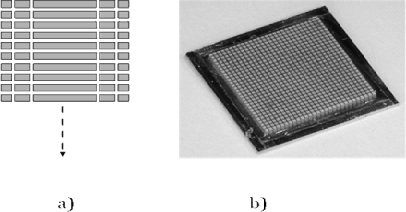
1.5D antennas allow us to vary the dimension of the emitting (and receiving) surface according to the use: a small dimension will give sharp images at low distances of exploration, while use of the biggest dimension is preferred for large depths. In the most evolved systems, delays can be applied between the various rows of piezoelectric elements, allowing us to vary the focusing distance, or even to correct aberration phenomena due to inhomogeneities of the superficial layers of biological tissues. 2D arrays are used in a similar way to phased arrays, but with a deflection of the ultrasound beam in two directions. Consequently, they allow a volume acquisition. Such systems of 3D imaging open new possibilities, in particular to overcome the human factor linked to the operator.
2.4. Piezoelectric material issues
2.4.1. Material requirements
A large number of piezoelectric material properties (elastic, dielectric, piezoelectric constants, machinability and cost) must be taken into account in transducer design. Two of the most important material parameters for transducer applications are the effective electromechanical coupling coefficient keff of the main vibration mode and the acoustic impedance Zac.
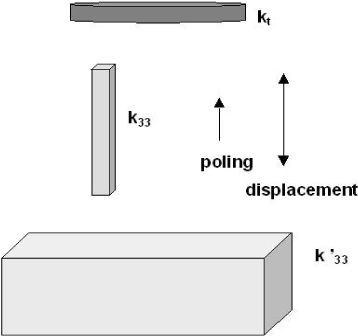
The effectiveness of electrical to mechanical conversion of the material for the vibration mode of interest is represented by the keff factor that depends on the material properties and also on the geometry of the active element. It should be as high as possible, its value ranges from 0 (no piezoelectric activity) to 100%. Medical imaging applications use longitudinal vibration modes where the displacements are in the poling direction defined by the thickness dimension. For large plates or discs in which the thickness is much smaller than the lateral dimension(s), the thickness coupling factor kt is used. For bars or pillars (thickness higher than lateral dimensions), the factor of interest is k33. For intermediate cases (one small and one large lateral dimensions with a thickness value between them), the k’33 factor is used [IEE 87] (Figure 2.12).
Figure 2.12. Vibration modes and coupling factor
The acoustic impedance, defined as the ratio between acoustical pressure p and particle velocity v in a given media, is obtained by multiplying the density ρ by the acoustic wave velocity ![]() . To ensure maximum energy transfer, it should be as close as possible to that of the propagation medium, i.e. biological tissues or often water in NDE; both have an acoustic impedance of ~1.5 MRa.
. To ensure maximum energy transfer, it should be as close as possible to that of the propagation medium, i.e. biological tissues or often water in NDE; both have an acoustic impedance of ~1.5 MRa.
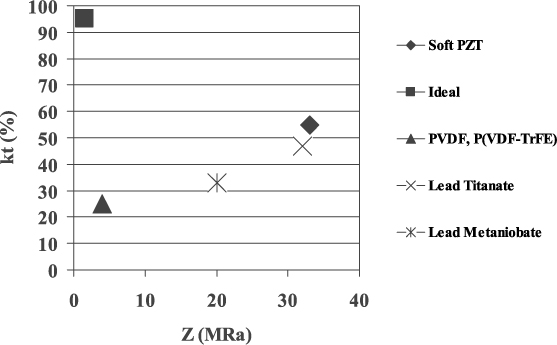
Figure 2.13 shows a plot of kt versus Zac for several piezoelectric materials. It can be observed that there is no ideal material with both high coupling and low acoustic impedance. Thus a trade-off must be chosen.
The low thickness coupling of lead metaniobate is partly compensated for by its low acoustic impedance. It is only used in applications where very high resolution is more important than sensitivity; for example in high resolution imaging of superficial structures. This material is used in NDE applications. Lead titanate compositions can be useful for relatively large area devices such as single-element transducers, because of their low planar and lateral coupling factors which allow parasitic vibration modes to be eliminated. However, they are rarely used in arrays because of their moderate k33 factor and low dielectric constant. Porous PZT has also been studied for many years, and recently, several compositions have been put on the market (Levassort et al. 2007). They have coupling coefficients equal to those of bulk materials of similar chemical composition, with the advantage of significantly lower acoustic impedance. They allow wideband transducers to be developed without numerous matching layers.
Figure 2.13. Electromechanical coupling factor in thickness mode (kt) versus the acoustic impedance (Z) of different piezoelectric materials
For almost all medical and NDE transducer applications, PZT-based piezoceramics are used. They exhibit high coupling factors (kt around 50% and k33 around 70%) and their high acoustic impedance can be compensated for by using acoustic matching layers in the transducer structures, as described in section 2.2. Doping by different additives in varying proportions and specific fabrication processes allows many types of PZT-based piezoceramics to be put on the market. Thus, most piezoceramic manufacturers offer a large range of properties such as from relatively low (a few hundred) to very high (a few thousand) dielectric constants and grain size from one to ten micrometers. A moderate dielectric constant allows good electrical matching to the electronics for large area devices, such as single or dual-element transducers, while array elements require much higher dielectric constants. When small dimensions are needed, like for high frequency devices or for arrays, fine grain materials will be required. Loss factors are usually not a critical parameter because transducer losses are mainly due to the backing and matching layers. Consequently, moderate mechanical and dielectric losses can be accepted, and a certain degree of mechanical losses can even be useful to damp internal parasitic resonances in the active layer.
Considering these requirements, hard PZTs are seldom used because their coupling factors (kt ~ 45%) and dielectric constants (several hundred) are lower than those of soft PZT and their very low losses are of no use for high bandwidth transducers. So, the most commonly used piezoelectric materials are soft PZT materials, such as PZT-5A or Pz27 (Ferroperm Piezoceramics 2007), with relative dielectric constants in the order of 1,000 and PZT-5H or Pz29 (Ferroperm Piezoceramics 2007) with higher dielectric constants. Piezoceramic manufacturers are constantly developing new ceramics with improved properties. The general tendency in the past few years has been, on the one hand, to increase dielectric constants while maintaining high coupling factors (kt over 50%); and on the other hand, to decrease grain size and porosity. This is achieved by developing ceramics based on PZT but with relatively large proportions of additives, leading to compositions such as PNNZT or PLZT, and by optimizing fabrication processes. Ferroperm Pz21 is an example of this type of high performance piezoceramic [BOV 01].
Non-ceramic piezoelectric materials are also available. Piezo-polymers such as PVDF or copolymers such as P(VDF-TrFE) can be purchased as films or sheets that are poled [KAW 67]. Their coupling factors are modest (20 to 30%), their dielectric constant is very low (<10), but their acoustic impedance (~ 4−5 MRa) is close to that of water so that acoustic matching is not required. Their properties tend to decrease when the thickness of the films increases due to poling difficulties. Therefore, they are used in high frequency applications only.
Several single crystals such as quartz or lithium niobate have interesting piezoelectric properties: they are used in resonators and surface acoustic wave filters. Thickness coupling is very low in quartz, while it is close to that of PZT ceramics in lithium niobate. These materials have very low dielectric constants, are quite expensive and their machining requires specific tools and methods. They do not have internal grain structure like polycrystals, so they are well adapted to obtain very thin plates or discs. Consequently, they tend to be limited to specific applications such as very high frequency single-element transducers. Lead-based single crystals with very high coupling coefficients have recently been developed.
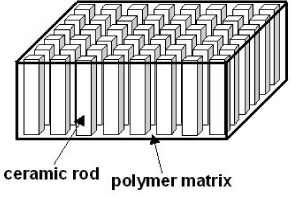
2.4.2. Piezocomposite materials
Piezocomposite materials combine a high coupling piezoceramic (such as soft PZT) and a low acoustic impedance polymer (such as an epoxy resin) to obtain performance trade-offs that no other material could achieve [NEW 78, NEW 86]. Different arrangements between the active phase and the passive phase were investigated, and it appeared that one arrangement was of great interest for ultrasonic transducer applications: the 1−3 connectivity piezocomposite corresponding to ceramic pillars in a polymer matrix (Figure 2.14) [SAV 81]. Several models, for example using the unit cell approach ([BAN 83, RIT 82, LEV 98]) were developed to obtain the electromechanical properties of such a composite. For relatively low ceramic contents the acoustic impedance is around three to four times lower than that of pure ceramic and moreover has a high thickness coupling factor kt, close to the value of k33. PZT ceramics are used because they exhibit values of k33 around 70% while their value of kt is only around 50%. These unique properties lead to higher sensitivity and bandwidth than classical piezoceramic devices.
Figure 2.14. Schematic representation of a 1–3 piezocomposite
2.4.3. Piezoelectric material characterization
All electrical behavior of a piezoelectric layer depends not only on the geometry and dielectric properties of the material, but also on its mechanical and electromechanical constants because of the piezoelectric effect. Measurement of the complex impedance versus frequency curves can then be used to derive effective properties. The measurements can be performed using an impedance (or network) analyzer and the sample under test is usually in free resonator conditions to be independent of the mechanical load. Exploitation of the curves can be achieved with simple approximate formulas like in the IEEE standard on piezoelectricity [IEEE 87], or if high precision is required for some materials such as composites, curve fitting procedures using models are developed [TRA 97, TRA 00; KWO 97].
A typical set of complex impedance (Z) / admittance (Y) curves is shown in Figure 2.15. The anti-resonant frequency (fa) corresponds to the maximum resistance component. The value of fa is linked to layer thickness and acoustic wave velocity. Combined with a density measurement, acoustic impedance can be obtained. The resonant frequency (fr) corresponds to the maximum conductance component and high electromechanical coupling corresponds to a large frequency gap value fa−fr. For example, if the vibration is a thickness mode, its coupling factor can be calculated by:
![]()
Different formulas have been derived for other vibration modes. The dielectric constant is obtained through the capacitive susceptance at frequencies where resonances can be neglected. A typical measurement frequency is twice the anti-resonant frequency, for which no thickness resonance can appear. Dielectric losses appear offset on the conductance component curves and as the dielectric is constant, measurements can also be performed at a 2fa frequency. Mechanical losses are evaluated through the half-width of an anti-resonance (resistance) peak; the mechanical quality factor is evaluated as Qm = fa Δf–1.
These methods can be adapted to higher order harmonics of the vibration mode, which allows material properties to be plotted versus frequency [TRA 00].
Figure 2.15. Typical curves of the complex electrical impedance/admittance of a free resonator
2.5. Modeling, design and characterization of ultrasonic antennas
2.5.1. Modeling transducer performance
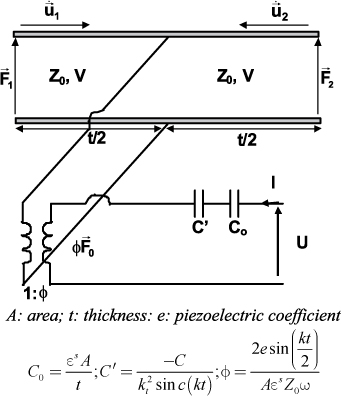
The electrical input impedance governs the energy transfer between the imaging system and the transducer. The pulse echo response is linked to sensitivity, axial resolution and frequency response. These two of the three main issues of transducer performance can be predicted by electroacoustic models. Under the assumption of a single mode vibration, all these curves can be predicted by equivalent electrical circuits such as the one proposed by [KRI 70] (Figure 2.16): all transducer layers are taken into account as well as electrical elements such as matching impedances and cables. Numerical methods such as finite element methods are also available [ASS 91] in cases where several acoustic modes coexist.
Figure 2.16. Krimholtz, Leedom and Matthei (KLM) scheme for thickness mode vibration of a piezoelectric plate (thickness t and area A). The force (pressure) at each face of the piezoelectric material is considered through an equivalent voltage while the derivative of displacement (particle velocity) is considered through an equivalent current. The required material parameters are ultrasonic wave velocity V, acoustical impedance Z0, dielectric constant at constant stress εS and electromechanical coupling coefficient kt. The piezoelectric coefficient e and the wave number k=ω/V, with ω the angular frequency, are deduced from these parameters, as well as all other components of the circuit
The last main transducer performance is the acoustic radiation patterns which enables the lateral resolution and acoustic noise level to be deduced. When the lateral resolution is high (i.e. lateral beam dimensions are low) the image is sharper. Acoustic noise level is the off-axis power level measured in dB using the on-axis power level as a reference. The acoustic noise level is increased by the appearance of side lobes, which exist whenever there are amplitude steps on the surface defined by the transducer front-face, or grating lobes which are due to space sampling in arrays. These parasitic lobes are responsible for artifacts in the images. Radiation pattern calculations can be achieved by considering that the transducer surface can be sampled by a series of point-sources (Huygen’s principle). The pressure can then be calculated by summing the contribution of each point-source [KIN 87]. Analytical calculations have been achieved for simple geometries (circular, annular or rectangular transducers) that have been used in impulse diffraction theories, which allow more efficient calculations [PEN 76, SEL 80, ARD 81]. A code has been developed by Jensen and made available on the Internet [JEN 07].
2.5.2. Tools for evaluation of transducer performance
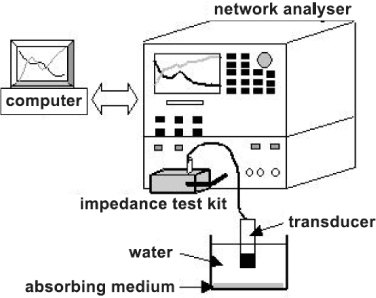
To measure electrical input impedance, the set-up is based on a network or an impedance analyzer. The front face of the transducer must be in contact with water to be in actual mechanical load condition. An absorbing medium is used to prevent reflection from the bottom of the water container (Figure 2.17). Typical frequencies range from one-tenth of the resonance frequency of the piezoelectric layer to over twice its value.
Figure 2.17. Electrical impedance measurement setup
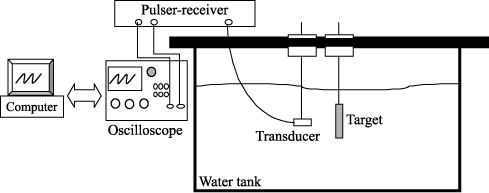
Pulse-echo response between the transducer and a target is obtained in a water tank (Figure 2.18). The duration of the electrical pulse must be less than half the period of the central frequency of the transducer, and the front surface of the target must be large and perfectly reflective. After digitization, fast Fourier transform (FFT) is used to obtain frequency response curves.
Figure 2.18. Setup of a pulse-echo response measurement
In the transmit mode, scanning the half space of the transducer’s front side using a point hydrophone receiver measures the radiation patterns. In the pulse-echo mode, a point-target is scanned, and the amplitude of the echo is plotted as a function of the target position.
2.6. High frequency (HF) acoustic antennas for biomedical microscanning applications
As previously mentioned in section 2.4, for a basic focused transducer (single element), the radiation pattern is defined by the size of the active element (for example the diameter for a circular element) and the focal distance.
Increasing the frequency improves the resolution but decreases the depth of field, and the attenuation in the propagation medium increases. This implies that this imaging modality is limited to superficial explorations. For biomedical microscanning applications, such as skin or eye imaging, the necessary resolutions correspond to several tens of micrometers and a focal distance of few millimeters is ideal. As an example, the typical axial and lateral resolutions required are 30 µm and 75 μm respectively; a focal distance at 7.5 mm, then an operating frequency of 50 MHz is necessary. The corresponding depth of field is 1.3 mm and the diameter of the piezoelectric element (if it is considered circular) is 3 mm. The resonant frequency of the piezoelectric element is inversely proportional to its thickness: for this example considering a typical piezoelectric element such as PZT, the corresponding thickness is around 45 μm. The difficulty is then to fabricate piezoelectric elements with very small sizes while keeping electromechanical performance comparable to those of bulk standard materials.
In this section, the available piezoelectric materials are specified. Antennas integrating these materials in different configurations (single element, annular and linear arrays) are then presented.
Polymers and copolymers
PVDF and P(VDF-TrFE) are widely used. These materials are available in very low thicknesses (from several μm to several tens of μm) and are flexible. Moreover, their acoustical impedance is relatively low (in comparison with standard PZT) and avoids the addition of a matching layer. Their thickness coupling factor is relatively low (around 30% for the best materials) which limits the sensitivity of the transducer integrating these materials.
Crystals
Lithium niobate (LN) is a single crystal used for high frequency applications. This material can be machined in low thicknesses while keeping high electromechanical performance (kt~49%). Other single crystals such as PMN-PT or PZN-PT which deliver very high piezoelectric coefficients (d33> 1500 pC/N) have been used more recently.
To avoid the difficulty of machining, the deposit of very low thicknesses of ZnO (for applications over 100 MHz) has been performed but their thickness coupling factor is relatively low (order of 28%). Moreover, their dielectric constant is low (like PVDF), which is difficult to electrically match with the system.
Thick films
Piezoelectric thick films have thicknesses between 1 to 100 μm. Contrary to bulk crystals or ceramics, these films are directly deposited on a substrate with the required thickness and final shape avoiding machining steps. Several deposition processes have been developed (spray, spin coating, dip-coating, tape casting, screen printing, etc) to obtain, in several cases, similar performance to bulk samples with the same compositions (mainly PZT).
Piezo-composites
The development of piezoelectric composites is one of the most promising ways to improve the performance of high frequency acoustic antennas (at around 30 MHz). These composites contain piezoelectric rods regularly spaced and embedded in a polymer matrix (i.e. 1–3 connectivity). These composites enable electromechanical performance (kt) higher than the piezoelectric phase to be obtained. Moreover, according to the ceramic volume fraction in the composites, the dielectric constant and the acoustic impedance can be adapted. The difficulty is their fabrication since at high frequency the periodic structure has a pitch of only several tens of μm.
Tables 2.1 and 2.2 summarize several properties of typical piezoelectric materials developed for high frequency applications and the performance of single high frequency transducers from the literature [SHA 04, CAN 03, CAN 07, ZHO 04, ZHO 05, ZHO 07a, ZHO 07b, ZHO 08, ZHO 03, WU 07, LOU 06, BAR 08, DUV 04, MAC 07, YUA 06, FEN 04, BRO 07].
Table 2.1. Piezoelectric material performance for the high frequency transducer fabrication
Table 2.2. Performance of single high frequency transducers from the literature
In multi-elements structures, such as annular arrays (with generally between 5 and 7 elements), the limitation of cross-talk between elements is essential and is always a key point for high frequency antenna applications. Different techniques can be used to physically isolate the rings, such as chemical etching or LASER. Mechanical cutting is in this case impossible for circular shapes. An attenuating material must fill the space created between the rings. For high frequency, the width of external rings is low and the lateral mode appears which degrades the performance of the array (radiation pattern). Several studies have been performed to design kerfless annular arrays (40 MHz). By using PVDF as an active material, the cross-talk between elements is low and the obtained performance is higher than in single element transducers (in particular for the depth of field) [KET 05].
MEMS technologies have been used for the fabrication of annular arrays with 7 and 11 elements (Tm-pMUT – thickness mode-piezoelectric micromachined ultrasonic transducer). In this case, many arrays can be fabricated at the same time on a single wafer [DUV 04].
Today, HF annular arrays based on piezoelectric polymers have the highest performance considering the trade-off between fabrication process, sensitivity and cross-talk between elements. Table 2.3 gives a summary of different HF annular arrays fabricated with the different technologies described in this section [KET 05, LUK 99b, LUK 05, SNO 01, CHE 02, BRO 04a, BRO 04b, GOT 05; DOR 07].
The fabrication of linear arrays (or phased arrays) is more complicated due to the high number of elements, which have very low dimensions. The pitch of a half wavelength for a phased array at 50 MHz should typically be 15 μm (with for example an element width of 10 μm and a kerf of 5 μm). Nowadays, these dimensions are almost impossible to reach to deliver lateral modes outside the bandwidth of the transducer in particular for the piezo-composite fabrications. However, most HF linear arrays are fabricated with a mechanical cut between elements and to compensate for the minimal width of the cut, wider elements are designed with a width between 1.5λ and 3λ, compared to 1λ to 2λ at classical frequencies.
Evolution of HF linear arrays has been closely related to the improvement of piezocomposites (in 1–3 or 2–2 connectivity). One of the first commercialized HF linear arrays with a center frequency of 20 MHz was presented in 2001 ([LAC 01]) and based on 1–3 piezocomposite technology. This technology has been improved to deliver antennas with a center frequency of 30 MHz [MIC 04]. Nowadays, efficient antennas with a center frequency over 40 MHz are based on piezocomposites (2–2 connectivity) using a laser to obtain cuts (and one sub-cut) with a width around 8 μm between each element. These antennas possess 128 or 258 elements [LUK 05]. Table 2.4 summarizes all the main characteristics of linear arrays developed during the past 15 years [LAC 01, MIC 04, LUK 05, LET 04; NGU 96, RIT 02, CAR 05, CAN 04, CAN 05, CAN 06, PAN 06, BRO 06, ZHO 07b, JIA 07, MIN 07].
The four tables presented in this section are taken from Filoux 2009.
Table 2.3. Performance of high frequency annular arrays from the literature
Table 2.4. Performance of high frequency linear arrays from the literature
2.7. New acoustic antennas based on technology of capacitive micromachined ultrasonic transducers
2.7.1. Structure of cMUT transducers
cMUTs (capacitive micromachined ultrasonic transducers) are micro-electromechanical systems [SEN 01] introduced by the Khuri-Yakub group [LAD 98] and Peter Eccardt from the company Siemens in 1996 [ECC 96]. They work like in-air microphones used in audio applications where mechanical vibration is produced by electrostatic forces instead of piezoelectric effects used for standard technology. The topology of an acoustic antenna based cMUT is defined by the pitch of the array, the kerf, the elevation and the number of emitters/receivers (Figure 2.19a}. Each acoustic radiator of an array is made with several thousand micro-membranes with periodic layout. The shape of the membranes depends on the acoustic design: square (Figure 2.19b), circular, polygon or rectangular.
Figure 2.19. (a) Topology of an acoustic antenna based cMUT (white squares) and (b) photography of 20 ×20 μm2 square shaped cMUT, lectrical impedance measurement set-up
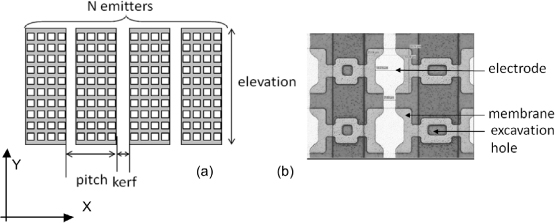
Figure 2.20. Sectional side views of cMUT (a) drawing and (b) SEM from [JEA 08]
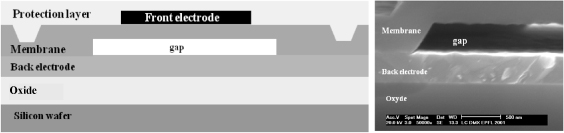
A detailed sectional side view of a cMUT is shown in Figure 2.20. The basic parts of the cMUT are the:
– membrane;
– front electrode when the constitutive material of the membrane is not electrically conducting;
– cavity or gap, sealed under vacuum, inside which the membrane moves;
– back electrode.
The total thickness of the “front electrode/membrane” sandwich varies typically from several hundred nanometers up to a few micrometers. The cavity height is of the same order of magnitude as the membrane thickness. The lateral dimensions of the membrane depend on the final center frequency, typically several tens of micrometers.
The choice of dimensions and material of each component is dependent on the cMUT fabrication technology that is used. This section will not describe in detail all the different micromachining possibilities that have been proposed up to now in the literature, but will concentrate on the two main approaches that exist for the fabrication of cMUTs: the sacrificial release process and the wafer-bonding method. These were first proposed by the Khuri-Yakub group [ERG 05]. Numerous variations of the sacrificial release process have been developed but they are all based on the same principle [CAR 08, GAT 08, JEA 08, CAL 05, DEG 06]. The cavity is created by depositing a sacrificial layer on a substrate.
After the membrane deposition, the sacrificial layer is removed with an etchant, specifically chosen to etch the sacrificial layer material but not the membrane. For the wafer bonding process, membrane and cavity are defined on two different wafers (prime quality silicon and SOI). On the prime silicon wafer cavities are first grooved with the micromachining process. The membrane is then obtained with the second wafer which is finally bonded to the first wafer in a vacuum [ZHU 09].
2.7.2. Basic electromechanical properties of cMUT
CMUTs are electronically driven as standard micro-electromechanical systems (MEMS), i.e. using a constant or time varying electrical voltage applied between the back and front electrodes. Practically, to both emit and receive ultrasound with a cMUT, the excitation voltage combines a dynamic component (for the emission) and a static component (for the reception). The biasing voltage enables us to convert variations of electrical capacitance produced by an incident pressure field into electrical charges.
CMUTs show electromechanical properties similar to those of other microsystems. The first characteristic is defined through static variations of membrane displacement with the value of biasing voltage, through the so-called displacement-voltage curve. To illustrate these variations an experiment example is reported in Figure 2.21. In this experiment ([SEN 10]), cMUTs were made with square shaped membranes of 20 μm width fabricated using the sacrificial release process [JEA 08]. The measurements were performed with a commercially available holographic microscope from Lyncée Tec SA.
In Figure 20.21a, the static displacement profile of the membrane is shown for different biasing voltage values. The corresponding curve of displacement amplitude (at the center of the membrane) as a function of voltage is shown in Figure 2.21b by the continuous line. In this example, for bias voltages from 0 to 45 V, at each of the bias voltage values, the membrane finds a stable position that is an equilibrium state between electrostatic forces and return mechanical forces from the membrane. Beyond 45 V, electrostatic forces cannot be compensated for by mechanical return stresses, which leads to instability and to the collapse of the membrane on the back of the cavity. This voltage limit is called the “collapse” voltage [LAD 98], better known as the pull-in voltage [SEN 01]. When the voltage is decreased, the value for which the membrane is released is called the snapback voltage or pull-out voltage, which is different from the collapse voltage: the displacement-voltage curve of a cMUT exhibits a hysteresis cycle.
Figure 2.21. Evolution of the displacement of a square membrane (20 μm side) with the bias voltage (a), and static displacement/voltage cycle (b)
The electrical impedance of a cMUT is the second practical characteristic from which mechanical resonance frequency, electromechanical coupling coefficient and capacitance can be derived. As for other microsystems, the mass-spring model [SEN 01], where membrane is considered as a pure flat piston, is an efficient tool to fit electrical impedance and then to obtain equivalent 1D parameters of the cMUT. However, as explained by Eccardt [ECC 06] and Yaralioglu [YAR 03], because of electrode bending under bias, mass-spring model must be modified assuming that a part of the electrode is fixed and that it plays the role of a passive capacitance (often described as parasitic).
To illustrate electrical properties of a cMUT, electrical impedance measured on the previously described device is shown in Figure 2.22. The real part shows the electrical anti-resonance peak that corresponds to the mechanical resonance frequency. The observed decrease of the resonance frequency when bias voltage is increased is called the softening effect [LAD 98]. On the capacitance curves, for each bias voltage, two specific values have to be considered to characterize the cMUT: the low frequency capacitance (CLF) far below the resonance and the high frequency capacitance far over the resonance (CHF). CHF is the “pure” electrostatic capacitance, the so-called fixed capacitance, and CLF is the free capacitance. They correspond respectively to values CS and CT of piezoelectric materials.
Figure 2.22. Experimental electrical reactance of one antenna element versus frequency and bias voltage. Membranes are square shaped with 20 μm width
Based on the definition by Berlincourt [BER 64] and more recently works by Caronti [CAR 05], the electromechanical coupling coefficient is defined by [2.1] which is consistent with the well-known definition under energetic considerations given in the IEEE standard of piezoelectricity [IEE 87].
[2.1] ![]()
Figure 2.23. High and low frequency capacitance variations with the bias voltage (left) and electromechanical coupling coefficient versus the bias voltage normalized by the collapse voltage (right)
Figure 2.23 displays variations of the low and high frequency capacitance values with the bias voltage, where voltage values sweep the collapse/snapback cycle. The increase of the two capacitances when the membrane is moved under the electrostatic pressure attraction is clearly visible. Note that the measurement of capacitance requires specific instrumentation, with high precision, since increase of capacitance is lower than 1 pF. Collapse and snapback voltages can also be measured through capacitance and the results are in agreement with values obtained from displacement. The electromechanical coupling coefficient deduced from experimental capacitance curves is shown in Figure 2.23. For comparison purposes only, the theoretical curve (continuous line) obtained with the modified mass-spring model has also been displayed. Input data of the model were fitted from the set of experimental electrical impedance curves [MEY 07]. The good agreement between theory and experiments proves that the modified mass-spring model is relevant to describe electromechanical properties of cMUTs. The theoretical maximum value of the electromechanical coupling coefficient is 1, here a value of 0.6 was measured. Practically, the maximum value of kt for an antenna element is governed by homogeneity of the cMUT population: high kt values are obtained when the set of cMUTs has a homogeneous behavior.
2.7.3. Modeling a cMUT loaded with fluid
When designing a cMUT-based antenna, the mechanical/fluid coupling of the membrane must first be simulated. This means predicting the impact of fluid inertia on the final center frequency, mechanical anti-resonance frequency, bandwidth and sensitivity of the device. A simpler approach to this is the use of the Mason equivalent circuit [BOZ 08, CAR 02, CER 05] where the mechanical impedance of the membrane is coupled to the piston-like radiation impedance through simple lumped modeling. This solution can provide interesting results to simulate one cMUT cell but precision decreases rapidly when the cMUT population is large [EKE 06]. The only way to model a large cMUT population with fluid coupling is to use a distributed model, where numerical solving techniques (mainly the finite element method [EKE 06, CAR 02, ORA 99, BAL 05, BAL 06, BAY 07] are used. In such methods, in order to take into account the radiation of acoustic energy into the surrounding fluid, the meshed domain must include a significant volume of fluid, while the sampling pitch has to be small enough to provide an accurate model of the mechanics of the cMUT membranes themselves. Symmetry and periodicity conditions mean that the case of an antenna is usually reduced to the simulation of a few neighboring cMUTs which leads to a reasonable computation time. Indeed, the modeling of a complete cMUT antenna element with a finite number of cMUT cells would result in an extremely long calculation time. However, using a boundary element matrix, as proposed by Ballandras [BAL 05] and Ekeom [EKE 06], avoids the fluid meshing and thus makes it possible to increase the number of cMUTs included in the model. These situations are two extreme cases corresponding to a 2D periodic layout and an isolated cell, respectively.
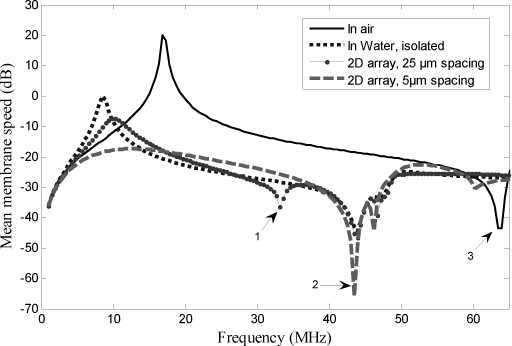
An example of simulation for these two cases is given in Figure 2.24 [MEY 10]. Membrane geometry is the same as previously described. Simulations show the mean speed spectrum of the membrane for four cases: the in-air response of a single cell in air, the same cell loaded with fluid and a membrane with 2D periodic boundary conditions loaded with fluid for two different pitches. The impact of fluid loading on the membrane response is clearly demonstrated. The loaded single cMUT has a resonance frequency of 9 MHz while its resonance in air is 18 MHz. This resonance can be interpreted quite simply, as analogous to a mass-spring system where the membrane has the spring role and the fluid has the mass. It can be noticed that, even for a periodic layout, the center frequency stays around 9 MHz. A small shift toward a higher central frequency is observable when the filling ratio of the periodic lattice increases: in this case the frequency moves from 9 MHz to 11 MHz when the pitch varies from 25 to 5 μm. The filling ratio mainly impacts on the bandwidth of the response, as shown by the comparison between the two periodic lattice simulations. The optimal velocity is much lower for the dense array (5 μm) than for the sparse array (25 μm), but if velocity is weighted by the filling ratio to express the average velocity over the element (which is an important feature when far-field radiation is considered), the denser array is superior at any frequency [PEA 54]. The minimum observed on each spectrum (frequency where the mean velocity is near zero) defines the maximum working frequency of the cMUT. This minimum in air occurs at 63 MHz, which is the first mechanical anti–resonance frequency for which the mechanical impedance of the membrane tends toward infinity. In the fluid, for the three configurations, this mode is shifted to 43 MHz (reference peak 2) due to the loading effect. Regardless of the periodicity effect, for the 25 μm intermembrane distance, another minimum occurs before the mechanical anti-resonance at 33 MHz (reference peak 1). This cut-off frequency is caused by the periodicity of the array and appears when the acoustic wavelength is equal to the pitch periodicity. This minimum is observable at 60 MHz (reference peak 3) for the 5 μm pitch device. It can be seen that depending on the design, the high cut-off frequency of the usable band of the transducer can be determined either by the periodicity or cMUT layout or by the mechanics of the membrane.
Figure 2.24. Average membrane speed spectrum (dB) for four cases: cMUT in air, single cMUT in water and cMUT in water with 2D periodic boundary conditions (two periodic pitches). The maximum of the single cMUT curve is used as a reference value to normalize other curves. Membranes are square with 20 μm width and 450 nm thick [MEY 10]
In Meynier et al. [MEY 10], an alternative modeling approach is presented, in which all physical aspects are dealt with separately in the simulation of antennas under a set of simple assumptions. First, the case of a single fluid-loaded cMUT membrane is considered. This situation provides information both on the mechanics of the membrane and the effects of fluid inertia. The energy dissipated in the membrane, and the energy radiated into the fluid, allows computation of the mechanical impedance of the cMUT and of its self-radiation impedance in fluid loading conditions, respectively [FOL 49, LOH 05].
Moreover, an equivalent electroacoustic circuit of a single fluid-coupled cMUT can be extracted and used to determine the electrical impedance. The second step of the model is to determine self and mutual radiation impedance [PRI 60, SHE 66] of cMUT populations under the assumption of “piston” vibration (i.e. constant speed over a region of the plane). Such calculations are easy to perform using the well-known Rayleigh integral formula expressed in the frequency domain. The last step is the modeling of the antenna element, and a change in the simulation scale is proposed for this purpose. A matrix lumped circuit is described, in which each cMUT is modeled with its equivalent electro-acoustic circuit (mechanical and self radiation impedance) and mutual interactions are determined under the “piston-like vibrations” assumption.
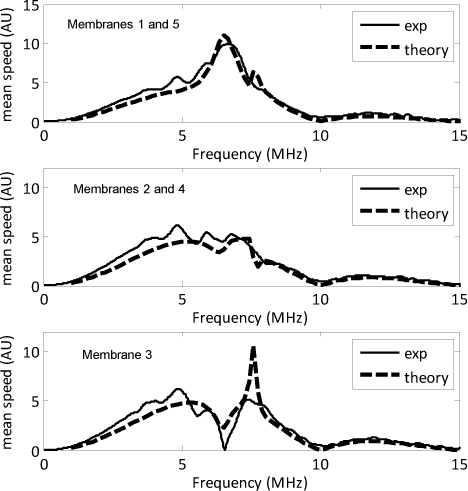
Figure 2.25 shows the displacement response measured over the surface of a cMUT membrane belonging to one element of an antenna. Membranes are the same as previously described and the element is made of five columns of cMUTs. Measurements were performed with a laser interferometer in fluid loading conditions. The excitation voltage was a single sinusoidal pulse with 10 MHz bandwidth centered at 5 MHz. The membranes were polarized at 0.8×Vcollapse. A very good match is obtained with the model; in particular the differences in the shape of the spectrum between the 3 cells are well predicted.
This experimental result clearly demonstrates that the response of each membrane is strongly dependent on its position inside the antenna. The two outer membranes (1 and 5) display a maximum at one particular frequency (7 MHz) that is close to the resonance frequency value of an isolated cMUT in water. This can be explained as a consequence of an acoustic edge effect since outer membranes are obviously less acoustically loaded by neighboring membranes. Membranes 2 and 4 have a large bandwidth response, with no particular frequency (almost reproducing the spectrum of the excitation). The speed spectrum of the central membrane has two lobes separated by a cut-off frequency already observed by Caronti (Caronti et al. 2005) and discussed by Boulme [BOU 10]. This phenomenon is a baffle effect where, at this frequency, local interactions between neighboring cMUTs tend to block their displacement.
Figure 2.25. Displacement measurement performed with laser interferometer at the surface of cMUT membranes inside an array loaded with water: mean membrane displacement (left) and speed spectrum (right), superposition of symmetrical membranes, comparison with model (dashed). Membranes are square with 20 μm width. The antenna element is made of 5 columns of cMUTs respectively numbered 1 2 3 4 5
2.8. Conclusion
The emergence of new modalities such as nonlinear or high frequency imaging, and a combination of ultrasonic therapy and imaging require improved transducer performance. For example, harmonic imaging requires very high transducer bandwidth to cover more than an octave frequency range, while high frequency transducers require micrometer size elements. In the same way, design of 2D arrays for volumetric imaging applications are pushing towards new structures such as multilayer piezoelectric elements and alternative techniques such as capacitive micro-machined ultrasonic transducers (cMUT), or their piezoelectric counterparts (pMUT). These technologies are expected to open new possibilities for transducer integration in the future, such as disposable arrays, but for medical imaging and NDE transducers, PZT piezoceramics remain the de facto standard material, and are often combined with a polymer phase to obtain a piezocomposite with bettter sensitivity-resolution trade-off. Piezoceramic-based transducers should continue to be the workhorse of the industry for many years to come. cMUTs will penetrate the market and are expected to replace standard technologies mainly when a high level of integration is required for example applications of intra-vascular acoustic imaging or applications combining therapeutic and diagnostic ultrasound with the same transducer.
2.9. Bibliography
[ARD 81] ARDITI M., FOSTER F.S., HUNT J.W., “Transient fields of concave annular arrays”, Ultrasonics Imaging, vol. 3, pp. 37–61, 1981.
[ASS 91] ASSAAD J., DUBUS B., HAMONIC B., DECARPIGNY J.N., DEBUS J.C., “Finite element modelling of ultrasonic transducers using the ATILA code”, Proceedings of Ultrasonics International, pp. 371–374, 1991.
[BAL 05] BALLANDRAS S., WILM M., DANIAU W., “Periodic finite element/boundary element modeling of capacitive micromachined ultrasonic transducer”, Journal of Applied Physics, vol. 97, p. 1, 2005.
[BAL 06] BALLANDRAS S., WILM M., GELLY J.F., “Theoretical analysis of micro-machined ultrasonic transducer using a simple 1-D model”, IEEE Trans. Ultrason. Ferroelectr. Freq. Control, vol. 53, pp. 209–223, 2006.
[BAN 83] BANNO H., “Recent development of piezoelectric ceramic products and composites of synthetic rubber and piezoelectric ceramic particles”, Ferroelectrics, vol. 50, pp. 3–1, 1983.
[BAR 08] BARDAINE A., BOY P., BELLEVILE P., ACHER O., LEVASSORT F., “Improvement of composite sol-gel process for manufacturing 40 μm piezoelectric thick films”, J. Euro. Ceram. Soc., vol. 28, pp1649–1655, 2008.
[BAV 07] BAYRAM B. et al., “Finite element modeling and experimental characterization of crosstalk in 1–D CMUT arrays”, IEEE Trans. Ultrason. Ferroelect. Freq. Control, vol. 54, pp. 418–430, 2007.
[BER 64] BERLINCOURT D.A., CURRAN D.R., JAFFE H., “Piezoelectric and piezomagnetic materials and their function in transducers”, in W.P. MASON (ed.) Physical Acoustics, Academic, New York, pp. 169–270, 1964.
[BOU 10] BOULME A., CERTON D., SENEGOND N., MEYNIER C., TESTON F., “A strategy to predict and reduced baffle effects in linear array of CMUTs”, in Proceedings of IEEE Ultrasonics Symposium, San Diego, USA, 2010.
[BOZ 08] BOZKURT A. et al., “A lumped–circuit model for the radiation impedance of a circular piston in a rigid baffle”, IEEE Trans. Ultrason. Ferroelectr. Freq. Control, vol. 55, p. 2046, 2008.
[BOV 01] BOVE T., WOLNY W., RINGAARD E., PEDERSEN A., “New piezoceramic PZT–PNN material for medical diagnosis applications”, Journal of the European Ceramic Society, vol. 21, pp. 1469–1472, 2001.
[BRO 04a] BROWN J.A., MORTON-DEMORE C.A., FOSTER F.S., LOCKWOOD G.R., “Performance of a 50 MHz annular array based imaging system”, IEEE Ultras. Symp., pp. 760–763, 2004.
[BRO 04b] BROWN J.A., DEMORE C.E.M., LOCKWOOD G.R., “Design and fabrication of annular arrays for high frequency ultrasound”, IEEE Trans. Ultras. Ferro. Freq. Cont., vol.51, pp. 1010–1017, 2004.
[BRO 06] BROWN J.A., FOSTER F.S., NEEDLES A., LOCKWOOD G.R., “A 40 MHz linear array based on 1–3 composite with geometric elevation focusing”, IEEE Ultras. Symp., pp. 256– 259, 2006.
[BRO 07] BROWN J.A., CHERIN E., YIN J., FOSTER F.S., “Fabrication and performance of a high-frequency geometrically focused composite transducer with triangular pillar geometry”, IEEE Ultras. Symp., pp. 80–83, 2007.
[CAL 05] CALIANO G. et al., “Capacitive micromachined ultrasonic transducer (cMUT) made by a novel ‘reverse fabrication process’”, Proceedings of IEEE Ultrasonics Symposium, vol. 1, pp. 479–482, 2005.
[CAN 03] CANNATA J.M., RITTER T.A., CHEN W.H., SILVERMAN R.H., “Design of efficient broadband single-element (20–80 MHz) ultrasonic transducers for medical imaging applications”, IEEE Trans. Ultras. Ferro. Freq. Cont., vol. 50, pp. 1548–1557, 2003.
[CAN 04] CANNATA J.M., ZHOU Q.F., SHUNG K.K., “Development of a high frequency (35 MHz) linear array using 2–2 composite elements”, IEEE Ultras. Symp., pp. 894–897, 2004.
[CAN 05] CANNATA J.M., WILLIAMS J.A., SHUNG K.K., “A kerfless 30 MHz linear ultrasonic array”, IEEE Ultras. Symp., pp. 109–112, 2005.
[CAN 06] CANNATA J.M., WILLIAMS J.A., RITTER T.A., SHUNG K.K., “Development of a 35MHz piezo-composite ultrasound array for medical imaging”, IEEE Trans. Ultras. Ferro. Freq. Cont., vol. 53, pp. 224–236, 2006.
[CAN 07] CANNATA J.M., WILLIAMS J.A., ZHOU Q., YU H., SUN L., KIM E.S., SHUNG K.K., “Self–focused ZnO transducers for ultrasonic biomicroscopy”, IEEE Ultras. Symp., pp. 945–948, 2007.
[CAR 04] CAREY S.J., GREGORY C.M., BREWIN M.P., BIRCH M.J., NG S., HATFIELD J.V., “PVDF array characterization for high frequency ultrasonic imaging”, IEEE Ultras. Symp., pp. 1930–1933, 2004.
[CAR 02a] CARONTI A., CALIANO G., IULA A., PAPPALARDO M., “An accurate model for capacitive micromachined ultrasonic transducers”, IEEE Trans. Ultrason. Ferroelectr. Freq. Control, vol. 49, pp. 159–168, 2002.
[CAR 02b] CARONTI A., CAROTENUTO R., CALIANO G., PAPPALARDO M., “Finite element study of cross coupling in 1-D capacitive micromachined ultrasonic transducer arrays”, Proceedings of IEEE Ultrasonics Symposium, pp. 1059–1062, 2002.
[CAR 03] CARONTI A., CAROTENUTO R., AND PAPPALARDO M., “Electromechanical coupling factor of capacitive micromachined ultrasonic transducers”, Journal of Acoustical Society of America, vol. 113, pp. 279–288, 2003.
[CAR 05] CARONTI A., SAVOIA A., CALIANO G., PAPPALARDO M., “Acoustic coupling in capacitive microfabricated ultrasonic transducers: modeling and experiments”, IEEE Trans. Ultrason. Ferroelect. Freq. Control, vol. 52, pp. 2220–2234, 2005.
[CAR 08] CARONTI A. et al., “Curvilinear capacitive micromachined ultrasonic transducer (CMUT) array fabricated using a reverse process”, Proceedings of IEEE Ultrasonics Symposium, pp. 2092–2095, 2008.
[CER 05] CERTON D., TESTON F., PATAT F., “A finite difference model For cMUT devices”, IEEE Trans. Ultrason. Ferroelectr. Freq. Control, vol. 52, pp. 2199–2210, 2005.
[CHE 02] CHEN W.H., SNOOK K.A., CAO P.J., SHUNG K.K., “Design and development of a 30 MHz six-channel annular array ultrasound backscatter microscope”, IEEE Ultras. Symp., pp. 621–624, 2002.
[DES 78] DESILETS C.S., FRASER J.D., KINO G.S., “The design of efficient broadband piezoelectric transducers”, Ultrasonics, vol. 25, pp. 115–125, 1978.
[DES 99] DESMARE R., TRAN HUU HUE L.P., LEVASSORT F., LETHIECQ M., “Modeling of multilayer piezoelectic structures”, Ferroelectrics, vol. 224, pp. 623–630, 1999.
[DOR 07] DOREY RA, DAUCHY F, WANG D, BERRIET R., “Fabrication and characterization of annulat thickness mode piezoelectric micro ultrasonic transducers”, IEEE Trans. Ultras. Ferro. Freq. Cont., vol.54, pp.2462–2468, 2007.
[DUV 04] DUVAL F.F.C., DOREY R.A., WRIGHT R.W., HUANG Z., WHATMORE R.W., “Fabrication and modeling of high frequency PZT composite thick film membrane resonators”, IEEE Trans. Ultras. Ferro. Freq. Cont., vol. 51, pp1255–1261, 2004.
[ECC 96] ECCARDT P.C., NIEDERER K., SCHEITER T., HIEROLD C., “Surface micromachined ultrasound transducers in CMOS technology”, Proceedings of IEEE Ultrasonics Symposium, vol. 2, San Antonio, pp. 959–962, 1996.
[ECC 06] ECCARDT P.C., “Analytical models for micromachined transducers – an overview”, Proceedings of IEEE Ultrasonics Symposium, Vancouver, pp. 572–581, 2006.
[EKE 06] EKEOM D., “Electrostatic-mechanical direct coupling and FEM-BEM coupling for CMUT electroacoustic parameters identification”, Proceedings of IEEE Ultrasonics Symposium, pp. 1971–1974, 2006.
[ERG 05] ERGUN A. et al., “Capacitive micromachined ultrasonic transducers: fabrication technology”, IEEE Trans. Ultrason. Ferroelectr. Freq. Control, vol. 52, no. 12, pp. 2242– 2258, 2005.
[FEN 04] FENG G.H., SHARP C.C., ZHOU Q., PANG W., KIM E.S., SHUNG K.K., “Fabrication of MEMS ZnO dome-shaped-diaphragm transducers for high frequency ultrasonic imaging. IEEE Ultras”, Symp., pp. 1950–1953, 2004.
[FER 07] FERROPERM PIEZOCERAMICS, www.ferroperm-piezo.com, 2007.
[FIL 09] FILOUX E., Modélisation par une méthode pseudospectrale/différences-finies et fabrication de transducteurs ultrasonores pour l’imagerie médicale haute résolution, PhD Thesis (in French), François-Rabelais University, Tours, 2009.
[FOL 49] FOLDY L., “Theory of passive linear electroacoustic transducers with fixed velocity distribution”, Journal of Acoustical Society of America, vol. 21, pp. 595–604, 1949.
[GEN 00] GENTRY K.L., ZARA J.M., BU S., EOM C., SMITH S.W., “Thick film sol PZT transducer using dip coating”, IEEE Ultrasonics Symposium Proceedings, vol. 2, pp. 977– 980, 2000.
[GOL 94] GOLDBERG R.L., SMITH S.W., “Multilayer piezoelectric ceramics for two-dimensional array transducers”, IEEE Trans. Ultrason. Ferroelect. Freq. Contr, vol. 41, 1994.
[GOT 05] GOTTLIEB D., CANNATTA J.M., HU C.H., SHUNG K.K., “High frequency copolymer annular array ultrasound transducer fabrication technology”, IEEE Ultras. Symp., pp. 121– 124, 2005.
[HAS 86] HASHIMOTO K.Y., YAMAGUCHI M., “Elastic, piezoelectric and dielectric properties of composite materials”, IEEE Ultrasonics Symposium Proceedings, pp. 697–702, 1986.
[IEE 87] IEEE, Standard on Piezoelectricity ANSI/IEEE Std, 1987.
[INO 87] INOUE T., OHTA M., TAKAHASHI S., “Design of ultrasonic transducers with multiple acoustic matching layers for medical application”, IEEE Trans. Ultrason. Ferroelect., Freq. Contr, vol. 34, pp. 8–16, 1987.
[JEA 08] JEANNE E., Réalisation et caractérisations électromécaniques de transducteurs ultrasonores capacitifs microusinés, PhD Thesis, François Rabelais University, Tours, 2008.
[JEN 07] JENSEN J.A., www.es.oersted.dtu.dk/staff/jaj/field, 2007.
[JIA 07] JIANG X., SNOOK K., HACKENBERGER W.S., YUAN J.R., CHENG A., SCHAFER M., GENG X., “PC-MUT arrays for ophthalmic ultrasound”, IEEE Ultras. Symp., pp. 309–312, 2007.
[KAW 69] KAWAI M., “The piezoelectricity of polyvinilydene fluoride”, Jpn. J. Appl. Phys, vol. 8, pp. 975–976, 1969.
[KET 05] KETTERLING J.A., ARISTIZABAL O., TURNBULL D.H., “Polyimide backed 40-MHz PVDF transducers”, IEEE Ultras. Symp., pp. 117–120, 2005.
[KET 05] KETTERLING J.A., ARISTIZABAL O., TURNBULL D.H., LIZZI F.L., “Design and fabrication of a 40-MHz annular array transducer”, IEEE Trans. Ultras. Ferro. Freq. Cont., vol. 52, pp. 672–681, 2005.
[KIN 87] KINO G.S., Acoustic Waves: Devices Imaging and Analog Signal Processing: Processing, Prentice-Hall Inc, Englewood Cliffs, New Jersey, 1987.
[KOB 00] KOBAYASHI M., OLDING T.R., ZOU L., SAYER M., JEN C.K., REHMAN A.U., “Piezoelectric thick film ultrasonic transducers fabricated by spray technique”, IEEE Ultrasonics Symposium Proceedings, vol. 2, pp. 985–989, 2000.
[KOS 66] KOSSOF G., “The effects of backing and matching on the performance of piezoelectric ceramic transducers”, IEEE Trans. Sonics and Ultrasonics, vol. 13, pp. 20– 30, 1966.
[KRI 70] KRIMHOLTZ R., LEEDOM D.A., MATTHEI G.L., “New equivalent circuit for elementary piezoelectric transducers”, Electronic Letters, vol. 38, pp. 338–339, 1970.
[KUW 81] KUWATA J., UCHINO K., NOMURA S., “Phase transitions in the Pb(Zn1/3Nb2/3)O3-0.09PbTiO3 system”, Ferroelectrics, vol. 37, pp. 579–582, 1981.
[KUW 82] KUWATA J., UCHINO K., NOMURA S., “Dielectric and piezoelectric properties of 0.91Pb(Zn1/3Nb2/3)O3–0.09PbTiO3 single crystals”, Jpn. J. Appl. Phys., vol. 21, pp. 1298–1302, 1982.
[KWO 97] KWOK K.W., CHAN H.L.W., CHOY C.L., “Evaluation of the material parameters of piezoelectric materials by various method”, IEEE Trans. Ultrason. Ferroelect., Freq. Contr., vol. 44, pp. 733–742, 1997.
[LAC 01] LACAZE E., MICHAU S., MAUCHAMP P., “20 MHz ultrasound array for medical imaging: from design to image evaluation”, IEEE Ultras. Symp., pp. 1139–1142, 2001.
[LAD 98] LADABAUM I., JIN X.C., HYONGSOK S., ATALAR A., KHURI-YAKUB B.T., “Surface micromachined capacitive ultrasonic transducers”, IEEE Trans. Ultrason. Ferroelectr. Freq. Control, vol. 43, pp. 678–690, 1998.
[LET 04] LETHIECQ M., FEUILLARD G., RATSIMANDRESY L., NGUYEN-DINH A., PARDO L., RICOTE J., ANDERSEN B., MILLAR C., “Miniature high frequency array transducers based on new fine grain ceramics”, IEEE Ultras. Symp., pp. 1009–1013, 2004.
[LEV 97] LEVASSORT F., LETHIECQ M., CERTON D., PATAT F., “A matrix method for modeling electroelastic moduli of 0–3 piezo-composite”, IEEE Trans. Ultrason. Ferroelect., Freq. Contr., vol. 44, pp. 445–452, 1997.
[LEV 98] LEVASSORT F., LETHIECQ M., MILLAR C.E., POURCELOT L., “Modeling of highly loaded 0–3 piezoelectric composites using a matrix method”, IEEE Trans. Ultrason. Ferroelect., Freq. Contr., vol. 45, pp. 1497–1505, 1998.
[LEV 00] LEVASSORT F., TRAN-HUU-HUE L.P., LETHIECQ M., BOVE T., WOLNY W., “New piezoceramics films for high resolution medical imaging applications”, IEEE Ultrasonics Symposium Proceedings, vol. 2, pp. 1125–1128, 2000.
[LEV 01] LEVASSORT F., TRAN-HUU-HUE L.P., HOLC J., BOVE T., KOSEC M., LETHIECQ M., “High performance piezoceramic films on substrates for high frequency imaging”, IEEE Ultrasonics Symposium Proceedings, 2001.
[LEV 06] LEVASSORT F., FILOUX E., LOU-MØLLER R., RINGGAARD E., LETHIECQ M., NOWICKI A., “Curved piezoelectric thick films for high resolution medical imaging”, Proc. IEEE International Ultrasonics Symposium, pp. 2361–2364, 2006.
[LEV 07] LEVASSORT F., HOLC J., RINGGAARD E., BOVE T., KOSEC M., LETHIECQ M., “Fabrication, modeling and use of porous ceramics for ultrasonic transducer applications”, Journal of Electroceramics, vol. 19, pp. 127–139, 2007.
[LOH 05] LOHFINK A., ECCARDT P.C., “Linear and nonlinear equivalent circuit modeling of CMUTs”, IEEE Trans. Ultrason. Ferroelect. Freq. Control, vol. 52, pp. 2163–2172, 2005.
[LOU 06] LOU-MOELLER R., BOVE T., RINGGAARD E., PEDERSEN A.F., “Investigation of a commercial PZT thick-film composition on various substrates for high frequency ultrasonic transducers”, IEEE Ultras. Symp., pp. 926–929, 2006.
[LUK 99a] LUKACS M., OLDING T., SAYER M., TASKER R., SHERRIT S., “Thickness mode material constants of a supported piezoelectric film”, J. Appl. Phys., vol. 85, pp. 2835– 2843, 1999.
[LUK 99b] LUKACS M., SAYER M., LOCKWOOD G., FOSTER F.S., “Laser micromachined high frequency ultrasonic arrays”, IEEE Ultras. Symp., pp. 1209–1212, 1999.
[LUK 05] LUKACS M., YIN J., PANG G., GARCIA R., CHERIN E., WILLIAMS J., FOSTER F.S., Mehi J., “Performance and characterization of high frequency linear array”, IEEE Ultras. Symp., pp. 105–108, 2005.
[MAC 07] MACLENNAN D., ELGOHYEN J., BUTTON T.W., DEMORE C.E.M., HUGHES H., MEGGS C., COCHRAN S., “Properties and application-oriented performance of high frequency piezocomposite ultrasonic transducer”, IEEE Ultras. Symp., pp. 100–103, 2007.
[MEY 07] MEYNIER C., CERTON D., TESTON F., FELIX N., FERIN G., “Accurate assessment of CMUT devices through precise electrical impedance measurement in air”, Proceedings of IEEE Ultrasonics Symposium, pp. 2139–2142, 2007.
[MEY 10] MEYNIER C., TESTON F., CERTON D., “A multiscale model for array of capacitive micromachined ultrasonic transducers”, Journal of Acoustical Society of America, vol. 128, no. 5, pp. 2549–2561, 2010.
[MIC 04] MICHAU S., MAUCHAMP P., DUFAIT R., “Piezocomposite 30 MHz linear array for medical imaging: design challenges and performance evaluation of a 128 elements array”, IEEE Ultras. Symp., pp. 898–901, 2004.
MIL 92] MILLAR C.E., WOLNY W.W., PARDO L., “Field dependence of the electromechanical properties of fine grained hydrothermally process lead titanate ceramics”, IEEE ISAF Proceedings, pp. 59, 1992.
[MIL 94] MILLAR E., PEDERSEN L., PARDO L., RICOTE J., ALEMANY C., JIMENEZ B., FEUILLARD G., LETHIECQ M., “Effect of processing on surface acoustic wave properties of modified lead titanate ceramic”, IEEE ISAF Proceedings, pp. 138–141, 1994.
[MIN 07] MINA I.G., KIM H., PARK S.K., CHOI K., JACKSON T.N., TUTWILER R., TROLIER-MCKINSTRY S., “High frequency piezoelectric MEMS ultrasound transducers”, IEEE Trans. Ultras. Ferro. Freq. Cont., vol. 54, pp. 2422–2430, 2007.
[NAJ 00] NAJAMURA K., KAWAMURA Y., “Orientation dependance of electromechanical coupling factors in KnbO3”, IEEE Trans. Ultrason. Ferroelect., Freq. Contr., vol. 47, pp. 750–755, 2000.
[NEW 78] NEWNHAM R.E., SKINNER D.P., CROSS L.E., “Connectivity and piezoelectric-pyroelectric composites”, Mat. Res. Bull., vol. 13, pp. 525–536, 1978.
[NEW 86] NEWNHAM R.E., “Composite electroceramics”, Ferroelectrics, vol. 68, pp. 1–32, 1986.
[NGU 96] NGUYEN-DINH A., RATSIMANDRESY L., MAUCHAMP P., DUFAIT R., FLESCH A., LETHIECQ M., “High frequency piezo-composite transducer array designed for ultrasound scanning applications”, IEEE Ultras. Symp., pp. 943–947, 1996.
[NGU 96] NGUYEN T.N., LETHIECQ M., LEVASSORT F., POURCELOT L., “Experimental verification of elastic properties using scattering approximation in (0–3) connectivity composite materials”, IEEE Trans. Ultrason. Ferroelect., Freq. Contr., vol. 43, pp. 640– 645, 1996.
[OAK 00] OAKLEY C.G., ZIPPARO M.J., “Single Crystal Piezoelectrics: a revolutionary development for transducers”, IEEE Ultrasonics Symposium Proceedings, vol. 1, pp. 1157–1167, 2000.
[OMO 94] OMOTE K., PARK K.S., LI G., OHIGASHI H., “Performance of multilayered ultrasonics transducers comprising vinylidene fluoride and trifluorethylene copolymer films and ferroelectric ceramic plates”, Jpn. J. Appl. Phys, vol. 33, pp. 2966–2971, 1994.
[ORA 99] ORALKAN O., JIN X., DEGERTEKIN F.L., KHURI-YAKUB B.T., “Simulation and experimental characterization of a 2-D capacitive micromachined ultrasonic transducer array element”, IEEE Trans. Ultrason. Ferroelect. Freq. Control, vol. 46, pp. 1337–1340, 1999.
[PAN 06] PANG G., SAYER M., LOCKWOOD G.R., WATT M., “Fabrication of PZT sol gel composite ultrasonic transducers using batch fabrication micromolding”, IEEE Trans. Ultras. Ferro. Freq. Cont., vol. 53, pp.1679–1684, 2006.
[PEA 54] PEAKE W.H., “The lowest resonant frequency of a water-loaded circular plate”, Journal of Acoustical Society of America, vol. 26, p. 166, 1954.
[PEN 76] PENTTINEN A., LUUKKALA M., “The impulse response and pressure nearfield of curved ultrasonics radiators”, J. Phys. D, vol. 9, pp. 1547–1557, 1976.
[POW 80] POWERS J.E., An ultrasonic annular array based on quadrature sampling, PhD Thesis, Washington University, Saint Louis, MO, 1980.
[PRI 60] PRITCHARD R.L., “Mutual acoustic impedance between radiators in an infinite rigid plane”, Journal of Acoustical Society of America, vol. 32, pp. 730–737, 1960.
[RIT 82] RITTENMEYER K., SHROUT T.R., SCHULZE W.A., NEWNHAM R.E., “Piezoelectric 3–3 composites”, Ferroelectrics, vol. 41, pp. 289–295, 1982.
[RIT 00] RITTER T., SHUNG K.K., GENG X., LOPATH P.D., PARK S.E., SHROUT T.R., “Single crystal PZN-PT-polymer composites for ultrasound transducer applications”, IEEE Trans. Ultrason. Ferroelect., Freq. Contr., vol. 47, pp. 792–800, 2000.
[RIT 02] RITTER T.A., SHROUT T.R., TUTWILER R., SHUNG K.K., “A 30–MHz piezo-composite ultrasound array for medical imaging applications”, IEEE Trans. Ultras. Ferro. Freq. Cont., vol. 49, pp. 217–230, 2002.
[SAI 98] SAITOH S., KOBAYASHI T., HARADA K., SHIMANUKI S., YAMASHITA Y., “A 20 MHz Single-element ultrasonic probe using 0.91Pb(Zn1/3Nb2/3)O3-0.09PbTiO3 single crystal”, IEEE Trans. Ultrason. Ferroelect., Freq. Contr., vol. 45, pp. 1071–1076, 1998.
[SAI 99] SAITOH S., TAKEUCHI T., KOBAYASHI T., HARADA K., SHIMANUKI S., YAMASHITA Y., “Forty-channel phased array ultrasonic probe using 0.91Pb(Zn1/3Nb2/3)O3-0.09PbTiO3 single crystal”, IEEE Trans. Ultrason. Ferroelect., Freq. Contr., vol. 46, pp. 152–157, 1999.
[SAI 99] SAITOH S., IMUZI M., SHIMANUKI S., HASHIMOTO S., YAMASHITA Y., US Patent 5,295,487, 1999.
[SAV 81] SAVAKUS H.P., KLICKER K.A., “Newnham RE () PZT-Epoxy piezoelectric transducers: a simpliflied fabrication procedure”, Mat. Res. Bull., vol. 16, pp. 677–680, 1981.
[SEL 80] SELFRIDGE A.R., KINO G.S., KHURY-YAKUB B.T., “A theory for the radiation pattern of a narrow strip acoustic transducer”, Appl. Phys. Lett., vol. 37, pp. 35–36, 1980.
[SÉN 10] SÉNÉGOND N., Approche temporelle de la simulation et de la caractérisation des transducteurs ultrasonores capacitifs micro-usinés, PhD Thesis, Fraçois Rabelais University, Tours, 2010.
[SHA 04] SHARP C.C., FENG G.H., ZHOU Q.F., CANNATA J.M., KIM E.S., SHUNG K.K., “200 MHz self–focused ZnO MEMS ultrasonic transducers for biomedical imaging”, IEEE Ultras. Symp., pp. 1946–1949, 2004.
[SHE 66] SHERMAN C.H., “Analysis of acoustic interactions in transducer arrays”, IEEE Trans. Ultrason. Ferroelectr. Freq. Control, vol. 13, pp. 9–15, 1966.
[SHR 90] SHROUT T.R., CHANG Z.P., KIM N., MARKGRAF S., “Dielectric behavior of single crystals near the (1–x)Pb(Zn1/3Nb2/3)O3-(x)PbTiO3 morphotropic phase boundary”, Ferroelec. Lett., vol. 12, pp. 63–69, 1990.
[SNO 01] SNOOK K.A., RITTER T.A., SHROUT T.R., SHUNG K.K., “Design of a high frequency annular array for medical imaging”, IEEE Ultras. Symp., pp. 1161–1164, 2001.
[SUN 84] SUNG K.M., “Piezoelectric multilayer transducers for ultrasonic pulse compression”, Ultrasonics, pp. 61–68, 1984.
[TRA 97] TRAN-HUU-HUE L.P., LEVASSORT F., LETHIECQ M., CERTON D., PATAT F., “Characterization of the piezoelectric and dielectric relaxation parameters of 0–3 composite and PVDF materials in thickness mode”, Ultrasonics, vol. 34, pp. 317–324, 1997.
[TRA 00] TRAN-HUU-HUE L.P., LEVASSORT F., FELIX N., DAMJANOVIC D., WOLNY W., LETHIECQ M., “Comparison of several methods to characterize the high frequency behavior of piezoelectric ceramics for transducer applications”, Ultrasonics, vol. 38, pp. 219–223, 2000.
[TRA 01] TRAN-HUU-HUE L.P., LEVASSORT F., VANDER MEULEN F., HOLC J., KOSEC M., LETHIECQ M., “Preparation and electromechanical properties of PZT/PGO thick films on alumina substrate”, Journal of the European Ceramic Society, vol. 21, pp. 1445–1449, 2001.
[VEC 99] VECHEMBRE J., SAGALOWICZ L., SETTER N., “Screen printed PZT layer-fabrication and properties”, Ferroelectrics, vol. 224, pp. 145–152, 1999.
[WU 07] WU D.W., CHEN R.M., ZHOU Q.F., LIN D.M., CHAN H.L.W., SHUNG K.K., “Lead-free piezoelectric ceramics for high-frequency ultrasound transducer”, IEEE Ultras. Symp., pp. 2590–2593, 2007.
[YAR 03] YARALIOGLU G.G., BADI M.H., ERGUN A.S., KHURI-YAKUB B.T., “Improved equivalent circuit and finite element method modeling of capacitive micromachined ultrasonic transducers”, Proceedings of IEEE Ultrasonics Symposium, vol. 1, pp. 469– 472, 2003.
[YUA 06] YUAN J.R., JIANG X., CAO P.J., SADAKA A., BAUTISTA R., SNOOK K., REHRIG P.W., “High frequency piezo composites microfabricated ultrasound transducers for intravascular imaging”, IEEE Ultras. Symp., pp. 264–268, 2006.
[ZHO 03] ZHOU W., HOLLAND S., KIM K.Y., SACHSE W., “Wideband high-frequency line-focus PVDF transducer for material characterization”, Ultrasonics, vol. 41, pp 157–161, 2003.
[ZHO 04] ZHOU Q.F., SHUNG K.K., HUANG Y., “Fabrication of sol-gel modified piezoelectric thick films for high frequency ultrasonic applications”, IEEE Ultras. Symp., pp. 1958– 1961, 2004.
[ZHO 05] ZHOU Q.F., CANNATA J.M., GUO H., HUANG C., MARMARELIS V.Z., SHUNG K.K., “Half-thickness inversion layer high frequency ultrasonic transducer using LiNbO3 single crystal”, IEEE Trans. Ultras. Ferro. Freq. Cont., vol. 52, pp 127–133, 2005.
[ZHO 07a] ZHOU Q.F., SHARP C.C., CANNATA J.M., SHUNG K.K., “Self-focused high frequency ultrasonic transducers based on ZnO piezoelectric films”, Applied Physics Letter, vol. 90, 2007.
[ZHO 07b] ZHOU Q.F., WU D., DJUTH F.T., LIU C.G., SHUNG K.K., “High-frequency piezoelectric PZT film micromachined ultrasonic transducers”, IEEE Ultras. Symp., pp. 1057–1060, 2007.
[ZHO 08] ZHOU Q.F., WU D., JIN C., HU J., XU X., WILLIAMS J., CANNATA J.M., SHUNG K.K., “Design and fabrication of PZN-7%PT single crystal high frequency ultrasonic needle transducers for pulsed-wave Doppler applications”, IEEE Trans. Ultras. Ferro. Freq. Cont., vol. 55, pp1394–1399, 2008.
[ZHU 09] ZHUANG X., WYGANT I., LIN D., KUPNIK M., KHURI-YAKUB O., ORALKAN B., “Wafer-bonded 2-D CMUT arrays incorporating through-wafer trench-isolated interconnects with a supporting frame, IEEE Trans. Ultrason. Ferroelectr. Freq. Control, vol. 56, pp. 182–192, 2009.
1 Chapter written by Louis-Pascal TRAN-HUU-HUE, Franck LEVASSORT, Dominique CERTON and Marc LETHIECQ.