
Chapter 11
Advanced Processing for DOA Estimation1
11.1. Introduction
11.1.1. Standard processing for DOA estimation
Conventional direction of arrival (DOA) estimation techniques, using either amplitude (Watson-Watt), phase (Doppler, interferometry [MUL 87]) or both amplitude and phase of observations (beamforming, ecartometry), were developed before the 1960s. They were mainly built to process situations characterized by a unique source with a main path and strongly degrade in the presence of multiple sources and/or multiple propagation paths of a given source. The scarce conventional methods, such as the beamforming method, able to accommodate multiple sources or multiple propagation paths generally generate, in these cases, a bias in the DOA estimation and are limited in resolution by the 3dB beamwidth of the array, called the Rayleigh distance.
To overcome the previous limitations, super-resolution DOA estimation techniques, such as Capon’s [CAP 69] or Auto-Regressive methods [BUR 72], were developed from the end of the 1960s. These techniques come from spectral analysis and are related to the concept of generalized matched filter. These techniques allow us to separate sources and/or propagation multi-paths inside the Rayleigh distance provided their number P does not exceed N – 1 (AR) or N (Capon), where N is the number of antennas. Nevertheless, these techniques generally generate a bias in the DOA estimation in multiple sources context, especially for weak sources.
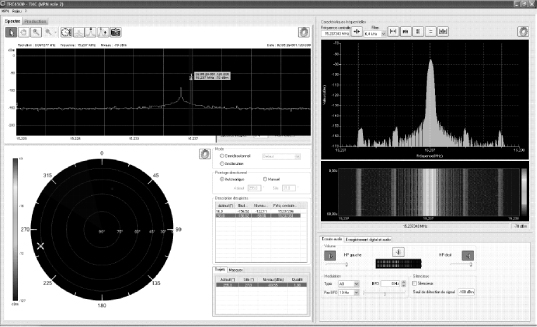
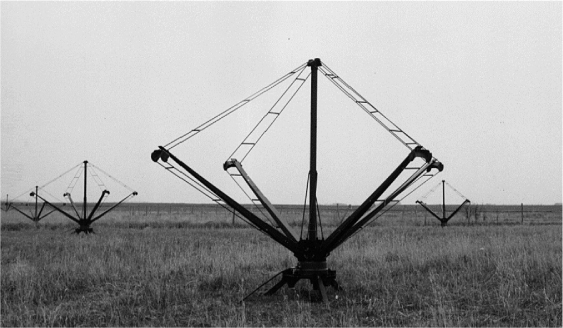
To overcome the limitations of super-resolution methods, high resolution methods [MAR 98] such as subspace methods MUSIC [SCH 86] or ESPRIT [ROY 86] or global methods such as the maximum likelihood methods [BRE 86] were developed from the end of the 1970s. These techniques precisely exploit the observation model structure and are able to process at most N – 1 sources and/or propagation multi-paths from an array of N antennas. Without modeling errors, they are not biased asymptotically and their resolution is potentially not limited regardless of the signal-to-noise ratio of the sources. However, these methods are weakly robust to the presence of background noise whose spatial coherence is unknown and their performance quickly degrades in the presence of modeling errors [FRI 90, SWI 92, FER 06], always present in operational contexts. In particular, the MUSIC technique is implemented in the Thales Product family (TRC6500) (Figures 11.1 and 11.2) for spectrum monitoring in the HVUSHF bands.
Conventional, super-resolution and high resolution standard techniques of DOA estimation share a common property: they do not exploit any a priori information on the impinging sources, which limits their performance.
Figure 11.1. DOA estimation with 3 sub-arrays of N = 5 dipoles for the frequency band [30 MHz – 3 GHz]
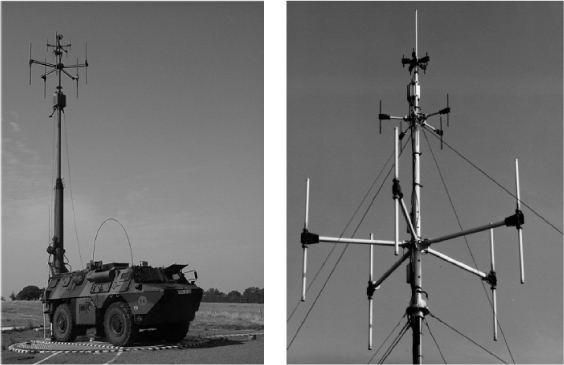
Figure 11.2. Human-machine interface of TRC 6500
11.1.2. New operational needs and advanced DOA estimation techniques
From the beginning of the 1990s, there has been a big increase in both civilian and military radio communications, from the HF to SHF band. This big rise generates a strong increase of spectral congestion due in particular to the throughput, and then to the bandwidth, increase of transmissions, to the necessity to share spectral resources between users and to the frequency reuse concept in cellular networks (Figure 11.3), without forgetting both non-intentional (industrial or atmospheric noise in HF, etc.) or intentional (during a conflict) jamming. In addition, for numerous operational applications such as HF ionospheric links (Figure 11.4) or urban radio communications (Figure 11.5), the propagation generates multiple paths due to wave reflections on ionospheric layers or buildings respectively. On the other hand, the limited size of carriers such as planes or unmanned aerial vehicles (UAV) (Figure 11.6), or the necessity to quickly deploy arrays of antennas are factors which limit both the array size and the number of antennas.
These new operational contexts generate both new requirements for spectrum monitoring and the necessity to implement powerful DOA estimation techniques in the presence of a potentially high density of emitters and/or propagation multi-paths, from antenna arrays having a limited size with respect to the wavelength and a limited number of antennas. In addition, spectrum monitoring systems must be able to process multiple waveforms such as single carrier or orthogonal frequency division multiplex (OFDM) waveforms, with spread spectrum (by frequency hopping, by pseudo-noise modulation) or not, continuous or by burst, with linear or nonlinear modulation, etc.
For these reasons, new DOA estimation techniques, so-called advanced DOA techniques in the following, have been developed and analyzed for several years, both in Thales and in the scientific community. These advanced techniques exploit a priori information about impinging sources, which allows a more powerful discrimination between them. These advanced techniques may be classified into two families corresponding to selective or non-selective DOA estimation techniques respectively. Non-selective techniques process all the received sources but with additional discrimination parameters with respect to standard techniques. On the contrary, selective techniques process the sources in a selective manner, from a given label, and do not process the other sources. The principle of these advanced methods, jointly with the description of their main advantages and drawbacks, are presented in the following sections after a reminder on the standard MUSIC method philosophy which is the reference method.
Figure 11.3. Cellular network
Figure 11.4. HF ionospheric links
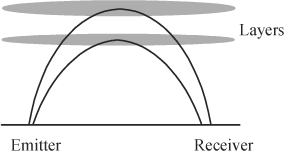
Figure 11.5. Radio communications in urban areas
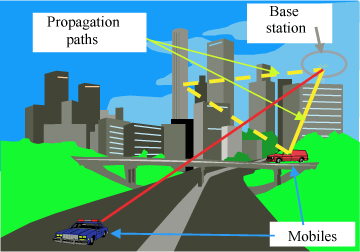
Figure 11.6. Unmanned aerial vehicle

11.2. Observation model, problem formulation and standard MUSIC method
11.2.1. Observation model
We assume that an array of N antennas receives the contribution of P narrow band sources and/or propagation multi-paths and a background noise. Under these assumptions, the vector x(t) of complex envelopes of the signals at the output of these antennas can be written as:
[11.1] ![]()
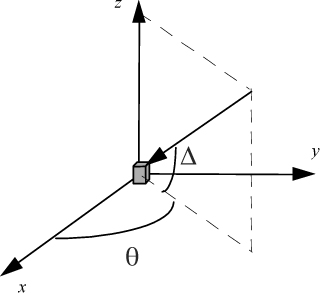
In this equation, b(t) is the noise vector; quantity sp(t) is the complex envelope of source p; s(t) is the vector with components sp(t); quantities θp, Δp, βp and a(θp, Δp, βp) are the azimut angle, the elevation angle (Figure 11.7), the polarization state (2 scalar parameters) and the steering vector of source p; A is the matrix of vectors a(θp, Δp,βp). Assuming plane waves and no coupling between antennas, component n of vector a(θ,Δ,β) can be written as:
[11.2a] 
[11.2b] ![]()
where λ is the wavelength, (xn, yn, zn) are the coordinates of antenna n of the array, fn (θ, Δ, β) is the complex response of antenna n to a unitary field of direction (θ, Δ) having the polarization β and aen(θ, Δ) = exp{j2π [xn cos(θ) cos(Δ) + yn sin(θ) cos(Δ) + zn sin(Δ) ] /λ}.
Figure 11.7. Impinging source in the space
11.2.2. Problem formulation
The problem of DOA estimation is to detect the P impinging sources and, for each source p (1 ≤ p ≤ P), to estimate its DOA (θp, Δp). For this purpose, the beamforming method and standards super-resolution and high resolution methods exploit the information contained in the temporal mean of the first correlation matrix of the observations, defined by Rx = < E[x(t) x(t)H] >, where <.> is the temporal mean operation over the considered observation horizon and where H means transpose and conjugate. On the contrary, the advanced methods generally exploit information contained in other kind of statistics, in addition to (non-selective methods) or instead (selective methods) of those contained in Rx.
11.2.3. Standard MUSIC method
As a reference method, the standard MUSIC method [SCH 86] assumes arrays with identical antennas which are placed at different positions. Under these assumptions, the generic steering vector a(θ, Δ, β) can be written, from [11.2], as:
[11.3] ![]()
where ae(θ, Δ) is the vector with components aen(θ, Δ) and f (θ, Δ, β) is the common complex response of each antenna of the array for impinging DOA (θ, Δ) and polarization β. In these conditions, after the source number estimation P, the standard MUSIC method consists of searching for the P minima of an estimate of the pseudo-spectrum defined by:
[11.4] 
where Πb = Ub UbH is the orthogonal projector on the noise subspace of Rx such that Ub corresponds to the (N x (N – P)) matrix of the normalized eigenvectors associated with the N – P smallest eigenvalues of Rx. In practice, matrix Rx is not known and has to be estimated from K snapshots vectors x(kTe), (1 ≤ k ≤ K) where Te is the sampling period. This then holds true for matrices Ub and Πb.
11.3. Non-selective advanced DOA estimation techniques
11.3.1. Presentation
Non-selective advanced DOA estimation techniques process all the impinging sources by exploiting additional discrimination parameters on the latter such as their polarization, power, phase or spectrum. As a consequence, these techniques allow us to generally increase both the resolution and the robustness to modeling errors with respect to standards methods when the sources may be discriminated by these parameters.
11.3.2. DOA estimation methods exploiting diversely polarized antennas
The polarization of the sources may be exploited as a discrimination parameter from the use of an array with diversely polarized antennas. Such an array is called a heterogeneous array, contrary to homogeneous arrays for which all the antennas are the same. The antennas of a heterogeneous array may be collocated or not. For example, for HF spectrum monitoring (3–30 MHz), we currently use two orthogonal cross-loops A and B (Figure 11.8). A loop is sensitive to the magnetic field component which is orthogonal to its plane. When the outputs of both loops A and B are considered, the associated cross-loop becomes an array of two collocated loops with different polarizations, still called a vectorial antenna. To ensure, for a given polarization, a quasi-omnidirectionality of the received power, we generally prefer to consider the outputs A + jB and A − jB, built from the A and B outputs. An array of vectorial antennas allow us to build arrays exploiting jointly space, pattern and polarization diversities (Figure 11.8).
When the antennas of the array are diversely polarized, the generic steering vector a(θ, Δ, β) depends on the polarization of the associated impinging source, contrary to an homogeneous array for which this vector becomes collinear to the vector ae(θ, Δ), which is independent of the polarization parameter. In these conditions, the MUSIC algorithm [11.4] may still be used but by considering, for sources whose polarization is unknown, a search both in direction (θ, Δ) and in polarization β, i.e. a 4-dimensional search. Such a search is generally very costly to be used operationally and we generally prefer to use a simpler procedure which is described in [FER 83].
More precisely, let us consider two distinct and orthogonal polarizations β1 and β2 (for example, horizontal and vertical) and let us call a 1(θ, Δ) and a2(θ, Δ) the vectors a1(θ, Δ) = a(θ, Δ, β1) and a2(θ, Δ) = a(θ, Δ, β2). These vectors are assumed to be known analytically or measured by calibration for all the directions (θ, Δ). For a plane wave, the complex field of an impinging source with polarization β may be broken down into a linear combination of two complex fields having polarization β1 and β2. We then deduce that a(θ, Δ, β) can be written as a linear combination of a1(θ, Δ) and a2(θ, Δ), i.e.
[11.5] ![]()
In [11.5], A12(θ, Δ) is the (N × 2) matrix of vectors a 1(θ, Δ) and a2(θ, Δ), μ1 and μ2 are complex scalars such that |μ1|2 + |μ2|2 = 1 and β is the vector with components μ1 and μ2. To within a phase term, this vector can be written as β = [cosy, e jφ siny] where y and φ are two angles which characterize the polarization of the impinging source such that ![]() . By replacing in [11.4] ae(θ, Δ) with a(θ, Δ, β) and using [11.5], the MUSIC pseudo-spectrum takes the form:
. By replacing in [11.4] ae(θ, Δ) with a(θ, Δ, β) and using [11.5], the MUSIC pseudo-spectrum takes the form:
[11.6] 
An alternative to the searching procedure for the P sets (θ, Δ, β) minimizing [11.6] is to use the method which is proposed in [FER 83]. This consists first of finding the vector βmin(θ, Δ) minimizing [11.6] with respect to the parameter β, and then finding the P couples (θ, Δ) minimizing [11.6] for β = βmin(θ, Δ). As a result, the final method consists of finding the P minima of:
[11.7] ![]()
where λmin(θ, Δ) is the minimum eigenvalue of the A12(θ, Δ)H Πb A12(θ, Δ) matrix in the A12(θ, Δ)H A12(θ, Δ) metric, verifying:
[11.8] ![]()
where βmin(θ, Δ) is the eigenvector of A12(θ, Δ)H Πb A12(θ, Δ) in the A12(θ, Δ)H A12(θ, Δ) metric associated with the minimum eigenvalue λmin(θ, Δ). To ensure that the minima of [11.7] only correspond to the sources DOA, the A12(θ, Δ)H Πb A12(θ, Δ) matrix must be full-rank with a rank equal to 2 for all the directions which do not correspond to the DOA of the sources. This condition requires that the rank of Πb be at least equal to 2, which generates P ≤ N − 2. Thus removing the searching procedure with respect to the polarization parameter generates a decrease of the maximum number of sources that may be processed. This number of sources becomes N − 2 whereas for the standard MUSIC method it is equal to N − 1.
Figure 11.8. Array of vectorial cross-loops antennas
In the presence of sources with different polarizations, the gain in performances obtained by using a heterogeneous array jointly with the method proposed in [FER 83] instead of using a homogeneous array with the standard MUSIC method is illustrated in [CHE 07]. It is shown that the resolution of the method proposed in [FER 83] is better than the resolution of MUSIC for sources with different polarizations.
11.3.3. Sequential DOA estimation techniques
The potential power difference between the sources may also be exploited to increase the performance of DOA estimation techniques through the implementation of sequential DOA estimation methods. Indeed, the P minima of the MUSIC pseudo-spectrum [11.4] are searched in parallel. However, these minima interact with each other all the more when the spatial correlation between the sources is important, which occurs in particular when the angular separation between the sources decreases or when P increases for a given value of N. This interaction between the sources or minima degrades in general the DOA estimation performance and more particularly that of the weakest sources.
A way to decrease this interaction between minima consists of replacing the parallel search of minima with a sequential search. More precisely, if the minima of the pseudo-spectrum are arranged in increasing order, a sequential search procedure consists of estimating the DOA of the source p associated with the minima p after having removed in the pseudo-spectrum the contribution of sources 1 to p – 1, whose DOA have been estimated. This removing of the sources 1 to p – 1 contribution may be implemented from deflation schemes. We then speak about sequential or deflation DOA estimation methods. Such methods have been proposed these last years in the scientific literature to implement the MUSIC method. These techniques have given rise to S-MUSIC (sequential MUSIC) [OH 93], IES-MUSIC (improved sequential MUSIC) [STO 95], RAP-MUSIC (recursively applied and projected MUSIC) [MOS 99] and D-MUSIC (deflated MUSIC) [CHE 09] methods respectively.
For example, for a homogeneous array of antennas, the search for the minima p of the MUSIC pseudo-spectrum by the D-MUSIC method consists of finding the absolute minima of an estimate of the pseudo-spectrum:
[11.9] 
In this expression,![]() and
and ![]() are estimates of θi and Δi respectively,
are estimates of θi and Δi respectively, ![]() is the orthogonal projector on the space which is orthogonal to the space spanned by the columns of matrix
is the orthogonal projector on the space which is orthogonal to the space spanned by the columns of matrix ![]() , defined by:
, defined by:
[11.10] ![]()
and Πb,p−1 is the orthogonal projector on the noise subspace of matrix ![]() , which corresponds to the correlation matrix of the observations deflated from sources 1 to p – 1.
, which corresponds to the correlation matrix of the observations deflated from sources 1 to p – 1.
Figure 11.9. Good DOA estimation probability (a) and RMS error (b) of sources 1 and 2 using MUSIC as a function of SNR2, square modulus of spatial correlation coefficient = 0, 0.4, 0.5, 0.7, 0.8, 0.9, SNR1 = 30 dB, K = 200, P = 2
In order to compare the performance of the MUSIC and D-MUSIC methods, we consider a homogeneous array of 10 antennas receiving P = 2 temporally uncorrelated QPSK sources. The SNR of source 1 per antenna, denoted by SNR1, is equal to 30 dB. A DOA estimation is assumed to be good when the associated minima in the pseudo-spectrum is lower than a given threshold equal here to 0.1. The correlation matrix of the data is estimated from K = 200 independent snapshots. Under these assumptions, Figures 11.9a and 11.9b show, for different values of the square modulus of the spatial correlation coefficient between the sources (normalized inner product of the associated steering vectors), the variations, as a function of the SNR of source 2, of the good DOA estimation probability and the normalized RMS error of the two sources respectively, when the standard MUSIC method is used. Figures 11.10a and 11.10b show the same variations but for the D-MUSIC method. Performances of source 1 are displayed by a solid line whereas those of source 2 are displayed by a dotted line. Note an increase in performance due to the use of D-MUSIC when the square modulus of the spatial correlation coefficient is not too weak (MUSIC works well for weak values of this parameter), and not too high (resolution limit of D-MUSIC).
Figure 11.10. Good DOA estimation probability (a) and RMS error (b) of sources 1 and 2 using D-MUSIC as a function of SNR2,square modulus of spatial correlation coefficient = 0, 0.4, 0.5, 0.7, 0.8, 0.9, SNR1 = 30 dB, K = 200, P = 2
11.3.4. Non-circular DOA estimation methods
A source whose complex envelope is s(t) is said to be circular when the probability density of s(t) is invariant per phase rotation. It is second order (SO) circular when the second correlation function E[s(t) s(t − τ)] is zero for all the couples (t, τ). A SO non-circular source is then such that there exists at least one couple (t, τ) for which E[s(t) s(t −τ)] ≠ 0. The sources having the strongest SO non-circular character are the rectilinear sources for which s(t)* = s(t) e−2jφ, where φ is the phase of the carrier of s(t) and where * is the complex conjugation operation. Amplitude modulated sources, either analog (AM, PAM modulations) or digital (ASK modulation) and the two states phase modulated digital sources (BPSK) are rectilinear.
Numerous communication systems use BPSK modulation among which we find some CDMA radio communications cellular networks. For such systems, the exploitation of the rectilinear character of the sources allows us to discriminate the latter not only by their DOA (if N > 1) but also by their phase. Indeed, in the presence of P rectilinear sources, we deduce from [11.1] that the extended observation vector ![]() , can be written as:
, can be written as:
[11.11] ![]()
where:
![]()
and:
![]()
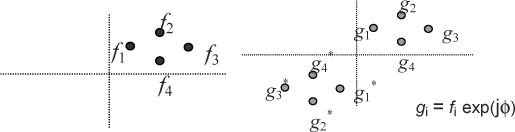
where φp is the phase of the carrier of sp(t). The comparison of expressions [11.1] and [11.11] shows that, for rectilinear sources, the exploitation of extended observations from an array of N antennas generates the virtual multiplication by 2 of the number of antennas and generates sources steering vectors which become functions of DOA, polarization and phase. In other words, to exploit model [11.11] for rectilinear sources is equivalent to exploiting a virtual array of 2N antennas whose complex responses depend on DOA, polarization and the phase of the sources. Figure 11.11 illustrates the link between the virtual array and the true array of antennas [CHE 06a].
In these conditions, when a search in DOA, polarization (for arrays with diversely polarized antennas) and phase is implemented, the MUSIC method applied to model [11.11], called non-circular MUSIC [GOU 98], allows us not only to process 2N – 1 rectilinear sources from N antennas but also allows us to exploit phase discrimination between the sources in addition to the discriminations offered by the initial array of antennas. It is still possible to remove the search procedure with respect to the phase parameter in a similar way as that presented in section 3.2 for the polarization parameter [GOU 98]. This phase discrimination between the sources is in fact possible by the exploitation of information contained in the first, Rx= < E[x(t) x(t)H] >, and second, Cx= < E[x(t) x(t)T] >, correlation matrices of the observations x(t). This additional discrimination by phase allows us to increase the resolution of DOA estimation methods as it is shown in [GOU 98], [DEL 04], [ABE 06]. Used in array filtering, it allows us to reject rectilinear interferences from only one antenna, hence the SAIC (Single Antenna Interference Cancellation) concept [CHE 06a], standardized and implemented in most GSM handsets since the GMSK modulation of the GSM may be considered, after a de-rotation operation, as a BPSK modulation which is filtered by a complex filter [CHE 06a].
Figure 11.11. Virtual array of 2N antennas associated with the initial array of N antennas
11.3.5. Spatio-temporal DOA estimation methods
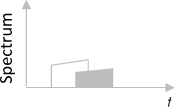
The impinging sources may also be discriminated by their spectrum, when the latter do not completely overlap (Figure 11.12). This may be done through the implementation of spatio-temporal DOA estimation techniques. Such techniques exploit the information contained in the first correlation matrix of a spatio-temporal observation vector built from the concatenation of vectors x(t) at different time instants. For such a model, the associated source steering vector is a function of its DOA, its polarization and its carrier frequency. A search procedure with respect to these three parameters may be implemented but it remains very costly. Such techniques allow us to increase the number of sources to be processed and the resolution of the MUSIC method when sources have spectrums which do not overlap completely.
Figure 11.12. Sources with partially overlapping spectrums
11.4. Selective advanced DOA estimation methods
11.4.1. Presentation
Selective advanced DOA estimation techniques process the sources that have a given label and not the others. They allow us to exploit sources discriminations such as the presence of a reference signal, the potential cyclostationarity, non-Gaussian character or statistical independence of the sources. Selective methods reduce the interaction between sources which do not share the considered label, which generally generates an increase of precision, robustness to modeling errors and resolution. In addition, such methods generate an increase in the number of sources to be processed and, for most of them, allow us to process a number of sources which is greater than the number of antennas.
11.4.2. DOA estimation techniques with a reference or cooperative DOA estimation techniques
DOA estimation techniques may exploit a reference signal, carried by some sources, to process the latter and not the other. We then talk about DOA estimation with a reference or cooperative methods, well-suited for the processing of standardized sources (cellular networks, etc.). This reference signal may correspond to a training sequence, periodically inserted in the wave-form for synchronization purposes or for propagation channel estimation, as is illustrated in Figure 11.13. This figure shows the structure of a GSM burst which is composed of a 26 bits training sequence surrounded with information bits and some tail bits. The reference signal may also correspond to a spreading code for direct sequence spread spectrum sources, typical of CDMA networks in particular.
Figure 11.13. Structure of a GSM burst
After the interception (detection – synchronization) of the sources which carry the chosen reference signal, the principle of cooperative DOA estimation techniques is the following. It consists of estimating the signal space associated with the set of sources and/or propagation multi-paths which carry the chosen reference signal, to potentially whiten residual interferences contained in the noise subspace and to implement a method such as MUSIC on the estimated signal space, potentially whitened. Theoretically, a technique such as cooperative MUSIC allows us to process N – 1 sources per reference signal from an array of N antennas. Of course, the performance of cooperative techniques depends on the number of symbols of reference signals.
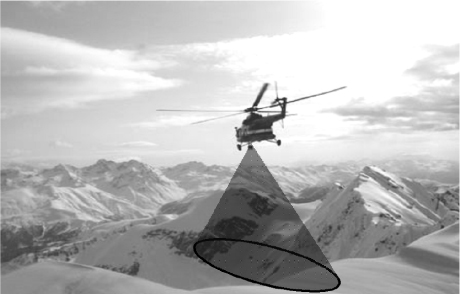
Such methods have been operationally tested by Thales in the LUTECE project for rescue in mountains after an avalanche to localize GSM handsets under the snow (Figure 11.14). The principle consists of activating, from an helicopter flying over the avalanche area and playing the role of a base station, the GSM handsets buried under the snow and to localize them from a cooperative DOA technique after the interception of the associated bursts. The array of antennas which has been used is an array with 5 patches placed under the helicopter.
Figure 11.14. Cooperative DOA estimation technique for GSM handsets localization
11.4.3. Cyclic DOA estimation methods
Most radio communications sources are cyclostationary [GAR 94], which means that their statistics are periodic or quasi-periodic functions of time. Such statistics then have a Fourier serial expansion. In particular, the first and second correlation matrix of the data, respectively defined by Rx(t, τ) = E[x(t) x(t − τ)H] and Cx(t,τ) = E[x(t) x(t − τ)T] have, for cyclostationary sources, Fourier serial expansions given by:
[11.12] ![]()
[11.13] ![]()
In these expressions, α and β are the SO cyclic frequencies of the data associated with the first and second correlation matrix respectively, whereas matrices ![]() and
and ![]() are the first and second cyclic correlation matrices of observations, defined by:
are the first and second cyclic correlation matrices of observations, defined by:
[11.14] ![]()
[11.15] ![]()
Figure 11.15. First cyclic correlation function for a BPSK source
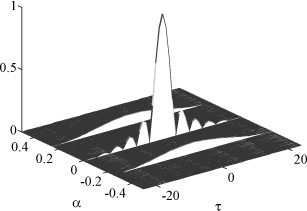
For a digital linearly modulated source, cyclic frequencies α are multiples of the symbol rate of the source whereas cyclic frequencies β correspond, for SO non-circular sources, to multiples of the symbol rate plus twice the carrier frequency of the source. Figure 11.15 shows the variations, as a function of α and τ, of the first cyclic correlation function of a BPSK source having a ½ Nyquist pulse shape filter with a roll-off equal to 0.25 and whose symbol duration is equal to 4Te, where Te is the sampling period. Note the presence of energy at frequencies which are multiples of the symbol rate 0.25 (1/Te).
In the presence of P narrow-band sources for the array of antennas and a stationary SO circular background noise, we deduce from [11.1] that expressions [11.14] and [11.15] can be written as:
[11.16] ![]()
[11.17] ![]()
where Rb(τ) = E[b(t) b(t − τ)H]; δ(α) is the Kronecker symbol equal to zero if α ≠ 0 and equal to 1 otherwise; ![]() and
and ![]() are the first and second cyclic correlation matrices of s(t). Matrices
are the first and second cyclic correlation matrices of s(t). Matrices ![]() and
and ![]() carry only contributions of sources having cyclic frequencies α and β respectively.
carry only contributions of sources having cyclic frequencies α and β respectively.
After the detection of cyclic frequencies α or β, the implementation of the MUSIC method from the estimation of one of the matrices ![]() or
or ![]() is called the cyclic MUSIC method [SCH 89]. Note that as matrices
is called the cyclic MUSIC method [SCH 89]. Note that as matrices ![]() and
and ![]() are not Hermitian, the cyclic MUSIC method uses a SVD instead of an EVD of these matrices. In these conditions, the cyclic MUSIC method is based on the fact that the source steering vectors are orthogonal to the left singular vectors associated with the noise subspace of these matrices. The cyclic MUSIC method theoretically allows us to process up to N − 1 sources per cyclic frequency from an array of N antennas. In addition, it is asymptotically robust to a background noise whose spatial coherence is unknown provided the latter is stationary. An extension of the cyclic MUSIC method enabling us to jointly process the information contained in
are not Hermitian, the cyclic MUSIC method uses a SVD instead of an EVD of these matrices. In these conditions, the cyclic MUSIC method is based on the fact that the source steering vectors are orthogonal to the left singular vectors associated with the noise subspace of these matrices. The cyclic MUSIC method theoretically allows us to process up to N − 1 sources per cyclic frequency from an array of N antennas. In addition, it is asymptotically robust to a background noise whose spatial coherence is unknown provided the latter is stationary. An extension of the cyclic MUSIC method enabling us to jointly process the information contained in ![]() and
and ![]() is presented in [CHA 03]. It corresponds to a combination of non-circular MUSIC and cyclic-MUSIC.
is presented in [CHA 03]. It corresponds to a combination of non-circular MUSIC and cyclic-MUSIC.
11.4.4. Higher Order DOA estimation methods
DOA estimation techniques which discriminate the sources with their non-Gaussian character do not process the Gaussian sources and exploit the information contained in the higher order (HO) statistics of the observations. One of the most popular HO DOA estimation techniques is the 2q-MUSIC method [CHE 06b, CHE 09] which implements the MUSIC method from a 2qth-order cumulant matrix of the observations. This (Nq × Nq) matrix, contains the quantities Cum[xi 1 (t),…, xil (t), ![]() , where l (0≤l≤ q) is an indice which controls the arrangement of the statistics in the statistical matrix. In choosing a natural indexation and assuming a Gaussian background noise, the 2qth-order statistical matrix of observations for the arrangement l can be written as [CHE 06b],
, where l (0≤l≤ q) is an indice which controls the arrangement of the statistics in the statistical matrix. In choosing a natural indexation and assuming a Gaussian background noise, the 2qth-order statistical matrix of observations for the arrangement l can be written as [CHE 06b],
[11.18] ![]()
In this expression, C2qs(l) is the 2qth-order cumulant matrix of s(t) for the arrangement l;η2 is the mean power of the noise per antenna; V(l) is the (N × N) matrix of spatial noise coherence for the arrangement l, such that Tr[V(l)] = N; Tr[.] means trace; ⊗ is the Kronecker product and A ⊗l is the (Nl× Pl) matrix defined by ![]() with a number of Kronecker products equal to l − 1.
with a number of Kronecker products equal to l − 1.
It is shown in [CHE 05] that to implement 2q-MUSIC from an array of N antennas is equivalent to implementing MUSIC from a virtual array with N2q(l) different antennas, whose geometry and number of antennas depend on q, l and the initial array. In particular, N2q(l) controls the maximal number of sources, equal to N2q(l) − 1, which may be processed by 2q-MUSIC method for the arrangement l. For example, for q = 2, an optimal arrangement of the statistics and a uniform circular array with N antennas, where N is a prime number, it is shown in [CHE 05] that N4(l) = N2 − N + 1. For a uniform linear array, N2q(l) = q(N − 1) + 1 [CHE 05]. In addition, the aperture of the virtual array controls the resolution of the 2q-MUSIC algorithm.
Figure 11.16 shows the virtual array associated with a uniform circular array of N = 5 antennas for the optimal arrangement of the statistics and for q = 2 (4− MUSIC). For this configuration, N4(l) = 21. Figure 11.17 shows, for q= 1, 2, 3, 4, the array pattern of the virtual array associated with a uniform circular array of N = 5 antennas having a radius equal to 0.8 λ. Note the increasing resolution with q. Finally, figures 11.18a and 11.18b show the good DOA estimation probability and the RMS error respectively on the estimates of the source 1 DOA by the 2q-MUSIC method, as a function of the number of snapshots L. For these figures, P = 2 poorly angularly separated sources (01 = 90°, θ2 = 97.5°), with a SNR equal to 5 dB, are received by a uniform linear array of N = 3 antennas in the presence of modeling errors. Note, for a sufficient number of snapshots, the increasing performance with q of 2q-MUSIC.
Figure 11.16. Virtual array for q = 2; uniform circular array, N = 5, R = 0.8 λ
Figure 11.17. Virtual array pattern for q = 1, 2, 3, 4; uniform circular array, N = 5, R = 0.8 λ
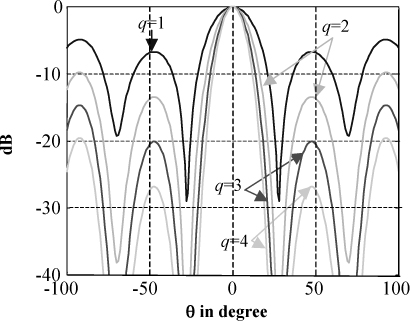
Figure 11.18. Good DOA estimation probability and RMS error for the source 1 as a function of L, q = 1, 2, 3; uniform linear array, N = 3, P = 2, SNR = 5 dB
11.4.5. DOA estimation methods after blind identification of the signatures
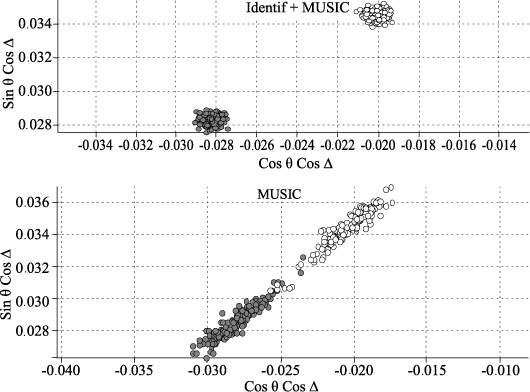
DOA estimation methods which discriminate the sources jointly by the non-Gaussian character and the statistical independence of the sources implement, in a first step, a blind identification of the source steering vectors through the implementation of a HO method such as JADE [CAR 93]. In a second step, a standard method such as MUSIC is implemented from each blindly identified steering vector. In these conditions and in the best case, the DOA estimation problem with P sources is transformed into P mono-source DOA estimation problems, which reduces the interaction between sources and which increases performance, as illustrated in Figure 11.19. In this example, P = 2 poorly angularly separated sources, non-Gaussian and statistically independent are processed by both JADE, followed by a search of a maximum correlation between the identified signature and the array manifold (MAXCOR), and MUSIC from an array with 4 antennas with modeling errors. Note the best performances of JADE + MAXCOR.
Figure 11.19. Comparison of JADE + MAXCOR and MUSIC, P = 2, N = 4
11.5. Conclusion
The development of both civilian and military radio communications jointly with the multi-path propagation problem associated with numerous applications and with the constraints of quick system installation or imposed by the carriers with limited size, generate the increasing necessity to implement advanced DOA estimation techniques. These techniques exploit a priori information on the sources to increase resolution, robustness to modeling errors and the number of sources to be processed from a given array of antennas. These advanced methods, briefly introduced in this chapter, open new perspectives for numerous applications for which standard high resolution techniques such as MUSIC find their limitations.
11.6. Bibliography
[ABE 06] ABEIDA H., DELMAS J.P., “MUSIC–like estimation of direction of arrival for non– circular sources”, IEEE Trans. Signal Processing, vol. 54, no. 7, pp. 2678–2690, July 2006.
[BRE 86] BRESLER Y., MACOVSKI A., “Exact maximum likelihood parameter estimation of superimposed exponential signals in noise”, IEEE Trans. Acou. Speech and Sign. Proc., vol. 34, no. 5, pp. 1081–1089, October 1986.
[BUR 72] BURG J.P., “The relationship between maximum entropy spectra and maximum likelihood spectra”, Geophysics, vol. 37, no. 2, pp. 375–376, April 1972.
[CAP 69] CAPON J., “High resolution frequency-wavenumber spectrum analysis”, Proc. IEEE, vol. 57, no. 8, pp. 1408–1418, February 1969.
[CAR 93] CARDOSO J.F., SOULOUMIAC A., “Blind beamforming for non-Gaussian signals”, IEE Proceedings-F, vol.140, no. 6, pp 362–370, December 1993.
[CHA 03] CHARGE P., WANG Y., SAILLARD J., “An extended cyclic MUSIC algorithm”, IEEE Trans. Signal Processing, vol. 51, no. 7, pp. 1695–1701, July 2003.
[CHE 05] CHEVALIER P., ALBERA L., FERREOL A., COMON P., “On the virtual array concept for higher order array processing”, IEEE Trans. Signal Processing, vol. 53, no. 4, pp. 1254–1271, April 2005.
[CHE 06a] CHEVALIER P., PIPON F., “New insights into optimal widely linear array receivers for the demodulation of BPSK, MSK and GMSK signals corrupted by noncircular interferences – Application to SAIC”, IEEE Trans. Signal Processing, vol. 54, no. 3, pp. 870–883, March 2006.
[CHE 06b] CHEVALIER P., FERREOL A., ALBERA L., “High resolution direction finding from higher order statistics: the 2q-MUSIC algorithm”, IEEE Trans. Signal Processing, vol. 54, no. 8, pp. 2986–2997, August 2006.
[CHE 07] CHEVALIER P., FERREOL A., ALBERA L., BIROT G., “Higher Order direction finding from arrays with diversely polarized antennas: The PD-2q-MUSIC algorithms”, IEEE Trans. Signal Processing, vol. 55, no. 11, pp. 5337–5350, November 2007
[CHE 09] CHEVALIER P., FERREOL A., ALBERA L., “High resolution DOA estimation with higher order statistics”, in E. TUNCER AND B. FRIEDLANDER (eds), Classical and Modern Direction of Arrival Estimation, Academic Press, pp. 289–339, 2009.
[DEL 04] DELMAS J.P., ABEIDA H., “Stochastic Cramer Rao bound for non circular signals with application to DOA estimation”, IEEE Trans. Signal Processing, vol. 52, no. 11, pp. 3192–3199, November 2004.
[FER 83] FERRARA E.R., PARKS JR. T.M., “Direction finding with an array of antennas having diverse Polarizations”, IEEE Trans. Ant. Prop., vol. 31, no. 2, pp. 231–236, March 1983.
[FER 06] FERREOL A., LARZABAL P., VIBERG M., “On the asymptotic performance analysis of subspace DOA estimation in the presence of modeling errors: case of MUSIC”, IEEE Trans. Signal Processing, vol. 54, no. 3, pp. 907–920, March 2006.
[FRI 90] FRIEDLANDER B., “A sensitivity analysis of the MUSIC algorithm”, IEEE Trans. Acou. Speech. and Signal Processing, vol. 38, no. 10, pp. 1740–1751, October 1990.
[GAR 94] GARDNER W.A., Cyclostationarity in Communications and Signal Processing, IEEE Press, New York, 1994.
[GOU 98] GOUNON P., ADNET C., GALY J., “Localisation angulaire de signaux non circulaires”, Traitement du Signal, vol. 15, no. 1, pp. 17–23, January 1998.
[MAR 98] MARCOS S., Les méthodes à haute résolution, ouvrage collectif, Hermès, Paris, 1998.
[MOS 99] MOSHER J.C., LEAHY R.M., “Source localization using recursively applied and projected (RAP) MUSIC”, IEEE Trans. Signal Processing, vol. 47, no. 2, pp. 332–340, February 1999.
[MUL 87] MULTEDO G., “Les techniques d’interférométrie utilisées dans les radiogoniomètres à Thomson-CSF”, Revue Technique Thomson, vol. 19, no. 2, pp. 249– 287, 1987.
[OH 93] OH S.K., UN C.K., “A sequential estimation approach for performance improvement of eigenstructure-based methods in array processing”, IEEE Trans. Signal Processing, vol. 41, no. 1, pp. 457–463, January 1993
[ROY 86] ROY R., PAULRAJ A., KAILATH T., “ESPRIT – A subspace rotation approach to estimation of parameters of cisoids in noise”, IEEE Trans. Acou. Speech and Sign. Proc., vol. 34, no. 5, pp. 1340–1342, October 1986.
[SCH 89] SCHELL S.V., GARDNER W.A., “Cyclic MUSIC algorithms for signal-selective DOA estimation”, Proc. ICASSP, Glasgow, Scotland, pp. 2278–2281, May 1989
[SCH 86] SCHMIDT R.O., “Multiple emitter location and signal parameter estimation”, IEEE Trans. Ant. Prop., vol. 34, no. 3, pp. 276–280, March 1986.
[STO 95] STOICA P., HANDEL P., NEHORAI A., “Improved sequential MUSIC”, IEEE Trans. Aerosp. Elect. System, vol. 31, no. 4, pp. 1230–1239, October 1995.
[SWI 92] SWINDLEHURST A., KAILATH T., “A performance Analysis of Subspace-Based method in the presence of model errors, Part I: the MUSIC algorithm”, IEEE Trans. Signal Processing, vol. 40, no. 3, pp. 1758–1774, July 1992.
1 Chapter written by Pascal CHEVALIER and Anne FERRÉOL.