
In this chapter, you will learn about . . .
The Service Economy
Characteristics of Services
The Service Design Process
Tools for Service Design
Waiting Line Analysis for Service Improvement
Web resources for this chapter include
OM Tools Software
Internet Exercises
Online Practice Quizzes
Lecture Slides in PowerPoint
Virtual Tours
Excel Exhibits
Company and Resource Weblinks
www.wiley.com/college/russell
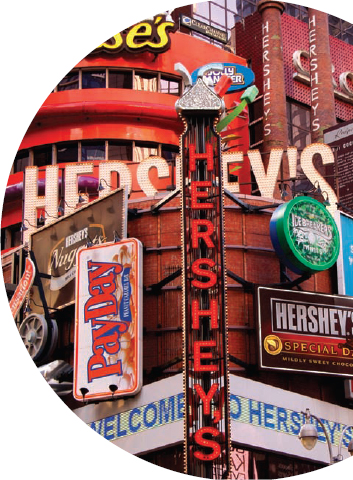
Service Design AT HERSHEY'S
IN ADDITION TO MAKING AND SELLING CHOCOLATE products, Hershey's has several special retail outlets and theme parks that reinforce the Hershey's brand and create shared experiences for Hershey's customers. No visit to Times Square in New York City is complete without a visit to Hershey's with its 215-feet tall, 60-feet wide storefront, the largest permanent fixture ever constructed in Times Square. The store offers interactive activities as well as a wide selection of products and personalized candies. Hershey's Chicago provides a factory worker's view of chocolate making and sponsors field trips, birthday bashes, and scouting events. Hershey's Niagara Falls offers their own rendition of a chocolate waterfall, and Hershey's Shanghai surrounds the customer with the sights and smells of every conceivable chocolate product.
These special stores display Hershey's products and accessories and create an atmosphere of fun and excitement. The theme park located in Hershey, Pennsylvania, is a place for family fun, rides, costumed characters, shows, concerts, a simulated factory tour, a chocolate spa, culinary events and, of course, Hershey's products. For the holiday season, special events include Candylane, Holiday Sweet Lights, and the Holiday Cottage Traditional events. Careful design of these venues and activities helps to build the Hershey's brand, reward customers, and solidify Hershey values.
In this chapter, we'll learn about the principles of service design and the importance of a well-designed customer experience.
Services are the predominant force in our society. In the United States, services account for 80% of the labor force, 94% of job growth, and 81% of GDP. Globally, services account for over 50% of the economics of Brazil, Russia, Japan, Germany, India, and China. The impact of supporting services on product success has turned product-producing companies into service providers. Increased outsourcing of business services demands more in-depth understanding of the service product and standards for quality. Service computing has prompted a new level of understanding of customer requirements and design theory. Major societal problems, such as education, health care, disaster relief, and government services, depend on complex customer-focused processes and benefit significantly from an innovative and interdisciplinary approach to their study and analysis. This unprecedented shift in customer, corporate, and societal demand for services and the management of corresponding resources has created a critical need for the study, analysis, and design of service systems.
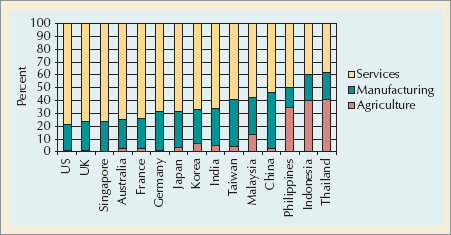
The rise of the service sector is not just U.S. phenomenon, as shown in Figure 5.1. Services represent the fastest growing sector of the global economy and account for two-thirds of global output, one-third of global employment, and nearly 20% of global trade.
Examining the latest U.S. figures on percent of employment by industry sector, we find that manufacturing accounts for a smaller percentage of employment than either education and health, professional services, government, or wholesale and retail trade. The United States has a positive balance of trade in services, and a deficit in manufactured goods.
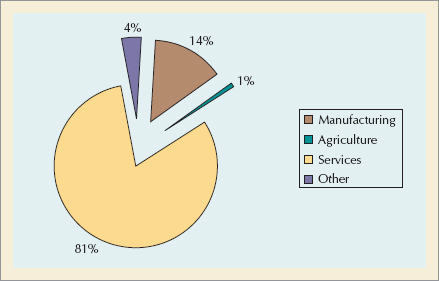
Figure 5.2 shows U.S. figures on percent of GDP by industry sector. Again, services account for the largest percent, over 80%.
Clearly, the effective design and efficient operation of services are paramount to the health of the economy. In this chapter, we discuss the characteristics of services, the service design process, tools for service design, and waiting line theory for service improvement.
Services are acts, deeds, performances or relationships that produce time, place, form or psychological utilities for customers. A cleaning service saves the customer time from doing the chores himself. Department stores and grocery stores provide many commodities for sale in one convenient place. An online broker puts together information in a form more usable for the investor. A night out at a restaurant or movie provides psychological refreshment in the middle of a busy workweek.
•Services: acts, deeds, or performances.
Services can also be defined in contrast to goods. A good is a tangible object that can be created and sold or used later. A service is intangible and perishable. It is created and consumed simultaneously. Although these definitions may seem straightforward, the distinction between goods and services is not always clear-cut. For example, when we purchase a car, are we purchasing a good or the service of transportation? A flat-screen TV is a manufactured good, but what use is it without the service of television broadcasting? When we go to a fast-food restaurant, are we buying the service of having our food prepared for us, or are we buying goods that happen to be ready-to-eat food items?
• Goods: tangible objects.
In reality, almost all purchases of goods are accompanied by facilitating services, and almost every service purchase is accompanied by facilitating goods. Thus, the key to understanding the difference between goods and services lies in the realization that these items are not completely distinct but rather are two poles on a continuum, as shown in Figure 5.3.
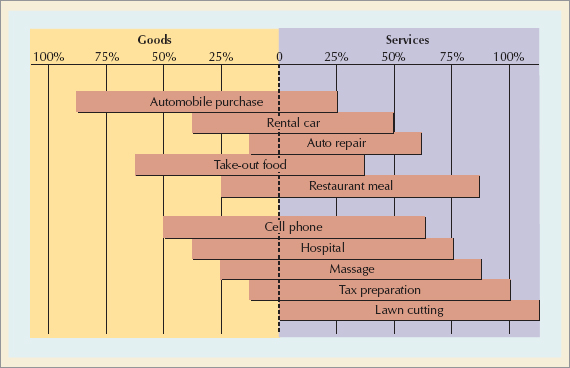
Figure 5.3. A Continuum from Goods to Services: Source: Adapted from Earl W. Sasser, R. P. Olsen, and D. Daryl Wyckoff, Management of Service Operations (Boston: Allyn Bacon, 1978), p. 11.
Understanding the different characteristics of services can help us better design service activities and the systems for their delivery.
Services can be distinguished from manufacturing by the following eight characteristics. Although not all services possess each of these characteristics, they do exhibit at least some of them to some degree.
Services are intangible. It is difficult to design something you cannot see, touch, store on a shelf, or try on for size. Services are experienced, and that experience may be different for each individual customer. Designing a service involves describing what the customer is supposed to "experience," which can be a difficult task. Designers begin by compiling information on the way people think, feel, and behave (called psychographics).
Because of its intangibility, consumers perceive a service to be more risky to purchase than a product. Cues (such as physical surroundings, server's demeanor, and service guarantees) need to be included in service design to help form or reinforce accurate perceptions of the service experience and reduce the consumer's risk.
The quality of a service experience depends largely on the customer's service expectations. Expectations can differ according to a customer's knowledge, experience, and self-confidence.
Customers also have different expectations of different types of service providers. You probably expect more from a department store than from a discount store, or from a car dealer's service center than from an independent repair shop. Understanding the customer and his or her expectations is essential in designing good service.
Service output is variable. This is true because of the various service providers employed and the variety of customers they serve, each with his or her own special needs. Even though customer demands vary, the service experience is expected to remain consistent. According to a recent survey, the most important measures of service quality to the customer are reliability and consistency. Service design, then, must strive for predictability or robustness. Examples of services known for their consistency include McDonald's, Holiday Inn, and ServiceMaster. Extensive employee training, set operating procedures, and standardized materials, equipment, and physical environments are used by these companies to increase consistency.

Services have higher customer contact. The service "encounter" between service provider and customer is the service in many cases. Making sure the encounter is a positive one is part of service design. This involves giving the service provider the skills and authority necessary to complete a customer transaction successfully. Studies show a direct link between service provider motivation and customer satisfaction. Moreover, service providers are not motivated primarily by compensation but rather by concurrence with the firm's "service concept" and being able to perform their job competently.
High customer contact can interfere with the efficiency of a service and make it difficult to control its quality (i.e., there is no opportunity for testing and rework). However, direct contact with customers can also be an advantage for services. Observing customers experiencing a service generates new service ideas and facilitates feedback for improvements to existing services.
Services are perishable. Because services can't be inventoried, the timing and location of delivery are important. Service design should define not only what is to be delivered but also where and when.
The service and the service delivery are inseparable. That means service design and process design must occur concurrently. (This is one area in which services have an advantage over manufacturing—it has taken manufacturing a number of years to realize the benefits of concurrent design.) In addition to deciding what, where, and when, service design also specifies how the service should be provided. "How" decisions include the degree of customer participation in the service process, which tasks should be done in the presence of the customer (called front-room activities) and which should be done out of the customer's sight (backroom activities), the role and authority of the service provider in delivering the service, and the balance of "touch" versus "tech" (i.e., how automated the service should be).
Services tend to be decentralized and geographically dispersed. Many service employees are on their own to make decisions. Although this can present problems, careful service design will help employees deal successfully with contingencies. Multiple service outlets can be a plus in terms of rapid prototyping. New ideas can be field-tested with a minimum disturbance to operations. McDonald's considers each of its outlets a "laboratory" for new ideas.
Services are consumed more often than products, so there are more opportunities to succeed or fail with the customer. Jan Carlzon, former president of SAS Airlines, calls these opportunities "moments of truth." Services are confronted with thousands of moments of truth each day. Careful design and redesign of the service encounter can help make each moment of truth a positive experience. In a sense, the service environment lends itself more readily to continuous improvement than does the manufacturing environment.
Services can be easily emulated. Competitors can copy new or improved services quickly. New ideas are constantly needed to stay ahead of the competition. As a result, new service introductions and service improvements occur even more rapidly than new product introductions.
Services that are allowed to just happen rarely meet customer needs. World-class services that come to mind—McDonald's, Nordstrom, Federal Express, Disney World—are all characterized by impeccable design. McDonald's plans every action of its employees (including 49 steps to making perfect french fries); Nordstrom creates a pleasurable shopping environment with well-stocked shelves, live music, fresh flowers in the dressing rooms, and legendary salespersons; Federal Express designs every stage of the delivery process for efficiency and speed; and Disney World in Japan was so well designed that it impressed even the zero-defect Japanese.
ALONG THE SUPPLY CHAIN
Redbox Brings Self-Service to Movie Rentals
When is movie rental by mail less convenient? . . . when a red box capitalizes on impulse rentals, low cost, and self-service at your local grocery store.
The now familiar Redbox kiosk appearing in supermarkets throughout the United States was the brainchild of McDonald's, who sought to bring fast-food prices and convenience to the movie rental market. Today, Redbox operates more than 25,000 kiosks in supermarkets, drug stores, and big box stores throughout the United States. Each kiosk holds 700 to 800 DVDs and more than 200 movie titles. Customers rent a DVD from the machine for $1 a day using their credit or debit cards, which can be charged an additional day's rental if the DVD is not returned within a 24-hour period. The kiosk resembles a retro London phone booth and allows customers to search movies by title, actor, genre, popularity, and more. Customers can rent and return DVDs to any kiosk. A typical kiosk rents 140 DVDs per day and earns more than $50,000 annually in revenue.
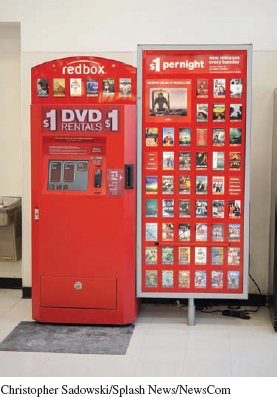
McDonald's eventually sold the company to Coinstar, a coin counting vending machine company that already had a presence and close relationship with the supermarket Industry. The location of the kiosks in grocery stores proved key to the service concept, as the regular flow of traffic and subsequent return home encouraged rentals. Reliable and easy-to-use kiosks were also essential to its success. For those, Redbox contracted with Flextronics, an electronics manufacturing service (EMS) provider, with expertise in lean manufacturing, Six Sigma, and quick turnarounds. Flextronics expanded the capacity of the original kiosks by 400%, reduced material costs by 25%, increased reliability to 99.75%, and introduced a quick-load module for adding up to 75 new DVDs to stock. In addition, Flextronics created designs for both indoor and seroutdoor kiosks, and integrated the hardware with server-side software to manage inventory from a central location. Remarkably, this was accomplished within an eighth-week time period.
Forty percent of Redbox's DVD rentals come from three major studios, Warner Brothers, Universal Studios, and 20th Century Fox. It is this portion of the supply chain that gives Redbox headaches. Unhappy that new releases were offered new for just $1, these studios put an embargo on Redbox for 30 days after release, effectively blacklisting the company for Partnerrefusing to rent new releases at a premium price. Redbox circumvented the studios by simply purchasing the new releases at Walmart, creating their own box art, and adding them to stock on the day of release. Litigation is ongoing. New service design that challenges the status quo can be rocky.
What do you see as the future of movie rentals, given on-demand cable access, video streaming on the Web, and other new technologies? How does a company prepare itself to adapt to these new environments?
Source: Adapted from Dawn Chmielewski, "Redbox's $1 Vending-Machine Video Rentals Worry Studios," Los Angeles Times, March 30, 2009; and "Flextronics and Redbox in Successful Partnerrefusing ship to Build DVD Rental Kiosks," retrieved 01/02/2010 from http://www.extronics.com/webdocuments/redbox.pdf
Service design is more comprehensive and occurs more often than product design. The inherent variability of service processes requires that the service system be carefully designed. Figure 5.4 shows the service design process beginning with a service concept and ending with service delivery.
•Service concept: the purpose of a service; it defines the target market and the customer experience.
The service concept defines the target customer and the desired customer experience. It also defines how our service is different from others and how it will compete in the marketplace. Sometimes services are successful because their service concept fills a previously unoccupied niche or differs from the generally accepted mode of operation. For example, Citibank offers 15-minute mortgage approvals through online computer networks with real estate offices, credit bureaus, and builder's offices, and an expert system loan-application advisor. Amazon excels at customer service for online orders, and eBay's worldwide reach creates more lively auctions with a huge community of buyers and sellers. Shouldice Hospital performs only inguinal hernia operations, for which its doctors are very experienced and its facilities carefully designed. Local anesthesia is used; patients walk into and out of the operating room under their own power; and telephones, televisions, and dining facilities are located in a communal area some distance from patient rooms. As a result, patients quickly become ambulatory, are discharged within hours (compared to normal week-long stays), and pay one-third less for their operations.

From the service concept, a service package is created to meet customer needs. The package consists of a mixture of physical items, sensual benefits, and psychological benefits. For a restaurant the physical items consist of the facility, food, drinks, tableware, napkins, and other touchable commodities. The sensual benefits include the taste and aroma of the food and the sights and sounds of the people. Psychological benefits are rest and relaxation, comfort, status, and a sense of well-being.
•Service package: the mixture of physical items, sensual benefits, and psychological benefits.
Effective service design recognizes and defines all the components of a service package. Finding the appropriate mix of physical items and sensual and psychological benefits and designing them to be consistent with each other and the service concept is also important. A fast-food restaurant promises nourishment with speed. The customer is served quickly and is expected to consume the food quickly. Thus, the tables, chairs, and booths are not designed to be comfortable, nor does their arrangement encourage lengthy or personal conversations. The service package is consistent. This is not the case for an upscale restaurant located in a renovated train station. The food is excellent, but it is difficult to enjoy a full-course meal sitting on wooden benches in a drafty facility, where conversations echo and tables shake when the trains pass by. In the hospitality industry, Marriott Corporation is known for its careful design of specialty hotels. From its Courtyard Marriott to Fairfield Inn to residential centers, each facility "fits" its clientele with a well-researched service package.
From the service package, service specifications are developed for performance, design, and delivery. Performance specifications outline expectations and requirements for general and specific customers. Performance specifications are converted into design specifications and, finally, delivery specifications (in lieu of manufacturing specifications).
Design specifications must describe the service in sufficient detail for the desired service experience to be replicated for different individuals at numerous locations. The specifications typically consist of activities to be performed, skill requirements and guidelines for service providers, and cost and time estimates. Facility size, location, and layout, as well as equipment needs, are also included. Delivery specifications outline the steps required in the work process, including the work schedule, deliverables, and the locations at which the work is to be performed.
•Performance specifications: outline expectations and requirements.
•Design specifications: describe the service in enough detail to be replicated.
•Delivery specifications: specify schedules, deliverables, location.
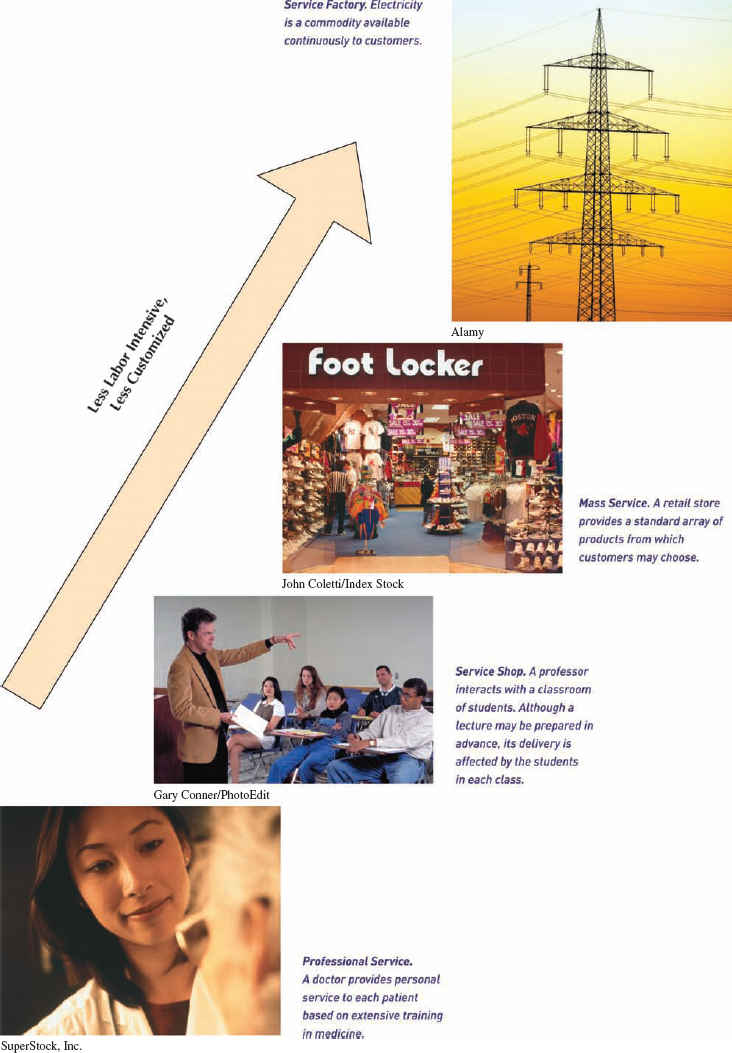
Notice in Figure 5.4 that both customers and service providers may be involved in determining performance, design, and delivery specifications. Service processes can be classified according to the degree of customization (involvement of the customer in service design and the delivery) and labor intensity (involvement of the service provider in service design and delivery).
Figure 5.5 shows a service-process matrix based on these two service characteristics. A professional service, such as accountant, lawyer, or doctor, is highly customized and very labor intensive. A service shop, such as schools and hospitals, is less customized and labor intensive but still attentive to individual customers. A mass service, such as retailing and banking, offers the same basic services to all customers and allows less interaction with the service provider. Services with the least degree of customization and labor intensity, such as airlines and trucking, are most like manufactured products and are thus best processed by a service factory.
The degree of contact between the customer and service provider has an impact on how individual services are designed and delivered. A large lecture class is taught differently than a senior-level seminar class. Charter airline flights entail more customer and provider participation than a commercial flight. Commissioning a work of art or custom building a home can involve the customer throughout the design and delivery process. Table 5.1 describes the design decisions involved in high-contact versus low-contact services. Think about how these decisions affect the operations and supply chain system.
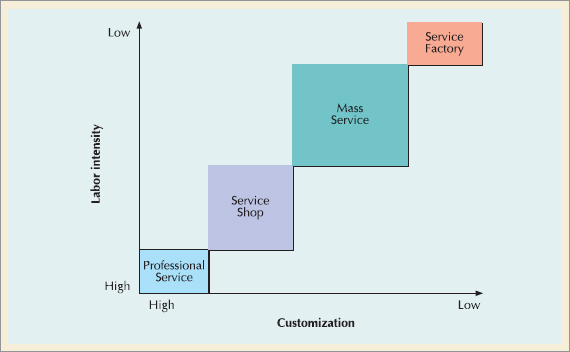
Figure 5.5. The Service- Process Matrix Source: Adapted from Roger Schmenner, "How Can Service Businesses Survive and Prosper?" Sloan Management Review 27(3);29.
Table 5.1. Differences in Design for High-Contact Services
Design Decision | High-Contact Service | Low-Contact Service |
|---|---|---|
Source: Adapted from R. Chase, N. Aquilano, and R. Jacobs, Operations Management for Compensative Advantage (New York: McGraw-Hill, 2001), p. 210. | ||
Facility location | Convenient to customer | Near labor or transportation source |
Facility layout | Must look presentable, accommodate customer needs, and facilitate interaction with customer | Designed for efficiency |
Quality control | More variable since customer is involved in process; customer expectations and perceptions of quality may differ, customer present when defects occur | Measured against established standards; testing and rework possible to correct defects |
Capacity | Excess capacity required to handle peaks in demand | Planned for average demand |
Worker skills | Must be able to interact well with customers and use judgment in decision making | Technical skills |
Scheduling | Must accommodate customer schedule | Customer concerned only with completion date |
Service process | Mostly front-room activities; service may change during delivery in response to customer | Mostly back-room activities; planned and executed with minimal interference |
Service package | Varies with customer; includes environment as well as actual service | Fixed, less extensive |
There are many different tools for designing services. Quality function deployment (QFD), discussed in the previous chapter, has wide application in services. Other common tools are service blueprints, scripting, servicescapes, and waiting line analysis.
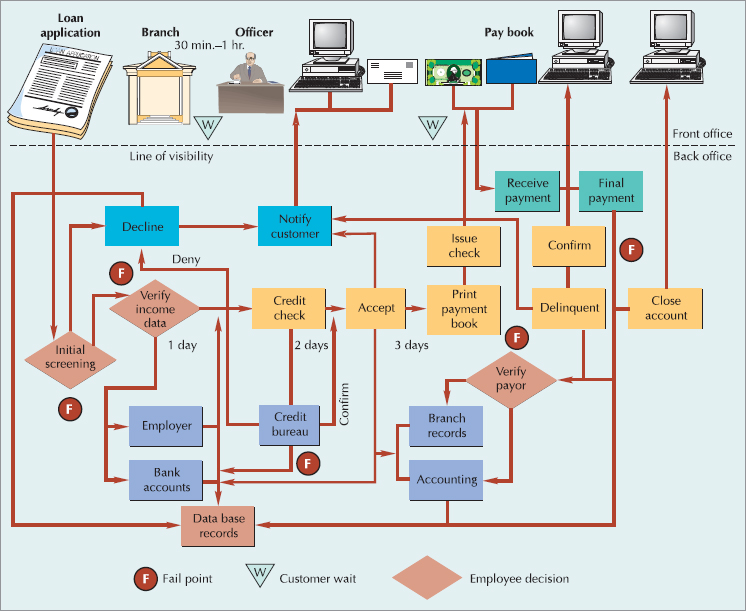
Service operations involve several different players (the customer, other customers in the system, the primary service provider, other service providers), both front and back room operations, and different opportunities for interaction among the players during the service process. Service blueprinting is the process of recording in graphical form the activities and interactions in a service process. The term blueprinting is used to reinforce the idea that services need to be as carefully designed as a physical product and documented with a blueprint of its own. Figure 5.6 shows a service blueprint for an installment loan process. Notice the line visibility behind which "back office" operations are performed. Potential failure points
•Service blueprinting: a specialized flow chart used for service processes.
Figure 5.7 shows an expanded service blueprint of a coffee shop operation. Several more lines have been added to the diagram. The line of influence shows activities designed to influence the customer to enter the service facility. The line of interaction is where the customer interacts with the service provider and other customers. The line of visibility separates front office (or onstage) activities from back office (or backstage) activities. In this example, the barista prepares the coffee in front of the customer, but must go backstage to retrieve cups from the stockroom. The line of support is where the service provider interacts with backstage support personnel to complete their tasks. Moving these various lines on the service blueprint allows the designer to experiment with expanding or decreasing the activities in each area. For example, the barista could disappear behind a curtain to prepare the coffee, or the customer could serve the coffee herself and interact with the service provider only when paying.
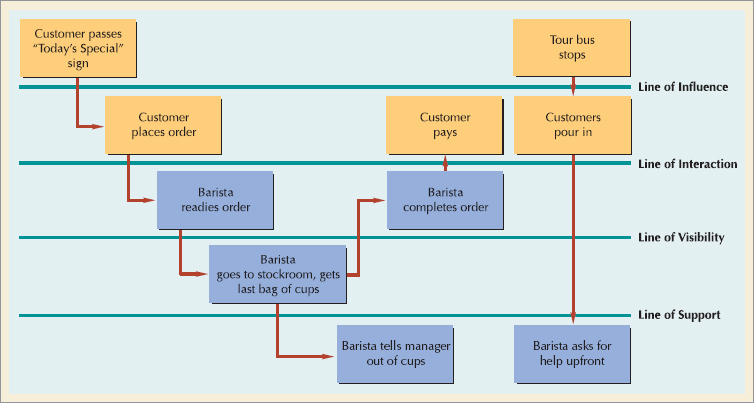
In manufacturing firms, the focus of activities is on the back office (i.e., producing products efficiently). Whereas, in service firms, the focus is on the front office, interacting with the customer. Every firm needs both a front and back office, but firms may structure these in different ways.
In the front office, the customer interface can be an individual, the service provider, or a self-service kiosk or machine. The interactions in the front office influence the customer's perception of the service and thus are critical to a successful design. Typical front office goals are courtesy, transparency, responsiveness, usability, and fun.
The back office processes material or information to support the front office needs. Typical goals of the back office are efficiency, productivity, standardization, and scalability.
Obvious conflicts exist between front and back officers. Connecting the front and back offices in a meaningful way and encouraging the flow of information and support are two of the challenges of service design. Designing the service with an eye to the entire system will help alleviate some of the tensions. Mass customization is an example of a front/back compromise. Instead of giving customers the freedom to order anything they want, present a menu of options from which the customer may choose. This provides some stability to the back office, while also being responsive to the customer.
It is precisely because services are so intangible that physical cues to service quality are needed. Servicescapes design (1) the space and function where the service takes places; (2) the ambient conditions, such as music, temperature, décor, and noise; and (3) signs, symbols, and artifacts. It is important that the servicescape be consistent with the service concept, and that all the elements be consistent with each other.
•Servicescapes: the design of the physical environment (including signs, symbols, and artifacts) in which a service takes place.
Servicescapes have proved to be extremely important to customer perception of service quality and to their satisfaction with the service.
Anyone who goes shopping, to the post office, or to a movie experiences the inconvenience of waiting in line. Not only do people spend time waiting in lines, but machinery waits in line to be serviced or repaired, trucks line up to be loaded or unloaded at a shipping terminal, and planes wait to take off and land. Waiting takes place in virtually every productive process or service. Since the time spent by people and things waiting in line is a valuable resource, the reduction of waiting time is an important aspect of operations management.
Companies are able to reduce waiting time and provide faster service by increasing their service capacity, which usually means adding more servers—that is, more tellers, more mechanics, or more checkout clerks. However, increasing service capacity has a monetary cost, and therein lies the basis of waiting line, analysis; the trade-off between the cost of improved service and the cost of making customers wait.
Providing quick service is an important aspect of quality customer service.
Waiting lines are analyzed with a set of mathematical formulas which comprise a field of study called queuing theory. Different queuing models and mathematical formulas exist to deal with different types of waiting line systems. Although we discuss several of the most common types of queuing systems, we do not investigate the mathematical derivation of the queuing formulas. They are generally complex and not really pertinent to our understanding of the use of waiting line analysis to improve service.
Waiting lines form because people or things arrive at the server faster than they can be served. This does not mean that the service operation is understaffed or does not have the capacity to handle the influx of customers. Most businesses and organizations have sufficient serving capacity available to handle its customers in the long run. Waiting lines result because customers do not arrive at a constant, evenly paced rate, nor are they all served in an equal amount of time. Customers arrive at random times, and the time required to serve each individual is not the same. A waiting line is continually increasing and decreasing in length (and is sometimes empty) but in the long run approaches an average length and waiting time. For example, your local bank may have enough tellers to serve an average of 100 customers in an hour, and in a particular hour only 60 customers might arrive. However, at specific points in time during the hour, waiting lines may form because more than an average number of customers arrive and they have transactions that require more than the average amount of time.
Decisions about waiting lines and the management of waiting lines are based on these averages for customer arrivals and service times. They are used in queuing formulas or models to compute operating characteristics such as the average number of customers waiting in line and the average time a customer must wait in line. Different sets of formulas are used, depending on the type of waiting line system being investigated. A bank drive-up teller window at which one bank clerk serves a single line of customers in cars is different from a single line of passengers at an airline ticket counter that are served by three or four airline agents. In this section we present the elements that make up waiting lines before looking at waiting line formulas.
•Operating characteristics: average values for characteristics that describe the performance of a waiting line system.
The basic elements of a waiting line, are the calling population, arrivals, servers, and the waiting line or queue. The relationship between these elements is shown in Figure 5.8 for the simplest type of waiting line system, a single server with a single queue. Following is a brief description of each of these waiting line elements.
•Queue: a single waiting line.
A waiting line system consists of arrivals, servers, and waiting line structure.
In our discussions of waiting lines, a customer is a person or thing that wants service from an operation. The calling population is the source of the customers to the waiting line system, and it can be either infinite or finite. An infinite calling population assumes such a large number of potential customers that it is always possible for one more customer to arrive to be served. For example, for the department store in Figure 5.8, we assume the calling population is infinite; to have, that is, the whole town or geographic area.
•Calling population: the source of customers; infinite or finite.
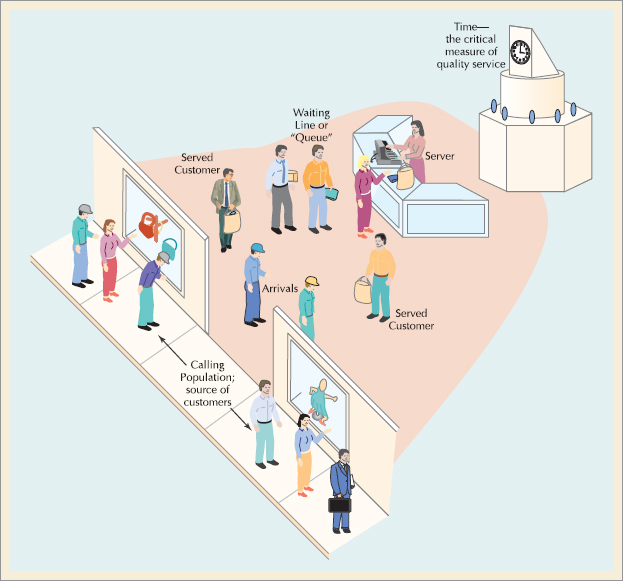
A finite calling population has a specific, countable number of potential customers. Examples of a finite calling population are a repair person in a shop who is responsible for a fixed number of machines to work on, a trucking terminal that services a fleet of ten trucks, or a nurse assigned to attend to only 12 patients.
The arrival rate is the rate at which customers arrive at the service facility during a specified period. This rate can be estimated from empirical data derived from studying the system or a similar system, or it can be an average of these empirical data. For example, if 100 customers arrive at a store checkout counter during a 10-hour day, we could say the arrival rate averages 10 customers per hour. However, it might be that no customers would arrive during one hour and 20 customers would arrive during another hour. Arrivals are assumed to be independent of each other and to vary randomly over time.
•Arrival rate: the frequency at which customers arrive at a waiting line; most frequently described by a Poisson distribution.
The variability of arrivals at a service facility often conform to a probability distribution. Arrivals could be described by many distributions, but it has been determined (through years of research and the practical experience of people in the field of queuing) that the number of arrivals per unit of time at a service facility can frequently be described by a Poisson distribution. In queuing, the average arrival rate, or how many customers arrive during a period of time, is signified by λ.
Arrival rate is less than service rate; λ < μ
For the models presented in this chapter, we assume there is no balking (refusing to join a line), reneging (leaving a line), or jockeying (changing lines) by customers in the waiting line system. We also assume that the arrival rate is less than the service rate (or else the line would grow infinitely long).
In waiting line analysis arrivals are described in terms of a rate, and service in terms of time. Service times in a queuing process may also be any one of a large number of different probability distributions. The distribution most commonly assumed for service times is the negative exponential distribution. Although this probability distribution is for service times, service must be expressed as a rate to be compatible with the arrival rate. The average service rate, or how many customers can be served in a period of time is expressed as μ.
•Service time: the time required to serve a customers most frequently described by the negative exponential distribution.
Empirical research has shown that the assumption of negative exponentially distributed service times is not valid as often as is the assumption of Poisson-distributed arrivals. For actual applications of queuing analysis, the assumptions for both arrival rate and service time distribution would have to be verified.
Interestingly, if service times are exponentially distributed, then the service rate is Poisson distributed. For example, if the average time to serve a customer is three minutes (and exponentially distributed), then the average service rate is 20 customers per hour (and Poisson distributed). The converse holds true for Poisson arrivals. If the arrival rate is Poisson distributed, then the time between arrivals is exponentially distributed.
The queue discipline is the order in which waiting customers are served. The most common type of queue discipline is first come, first served—the first person or item waiting in line is served first. Other disciplines are possible. For example, a machine operator might stack parts to be worked on beside a machine so that the last part is on top of the stack and will be selected first. This queue discipline is last in, first out. Or the machine operator might reach into a box full of parts and select one at random. This queue discipline is random. Often customers are scheduled for service according to a predetermined appointment, such as patients at a dentist's office or diners at a restaurant where reservations are required. These customers are taken according to a prearranged schedule regardless of when they arrive at the facility. Another example of the many types of queue disciplines is when customers are processed alphabetically according to their last names, such as at school registration or at job interviews.
•Queue discipline: the order in which customers are served; most commonly first come, first served.
In manufacturing operations, sometimes jobs with the shortest expected processing times are selected first in order to get the most jobs processed in the shortest time period. In emergency services like emergency rooms at hospitals, the most critical problem is typically served first.
Queues can be of an infinite or finite size or length. An infinite queue can be of any size, with no upper limit, and is the most common queue structure. For example, it is assumed that the waiting line at a movie theater could stretch through the lobby and out the door if necessary. A finite queue is limited in size. An example is the driveway at a bank teller window that can accommodate only a limited number of cars, before it backs up to the street.
•Infinite queue: can be of any length.
•Finite queue: the length is limited.
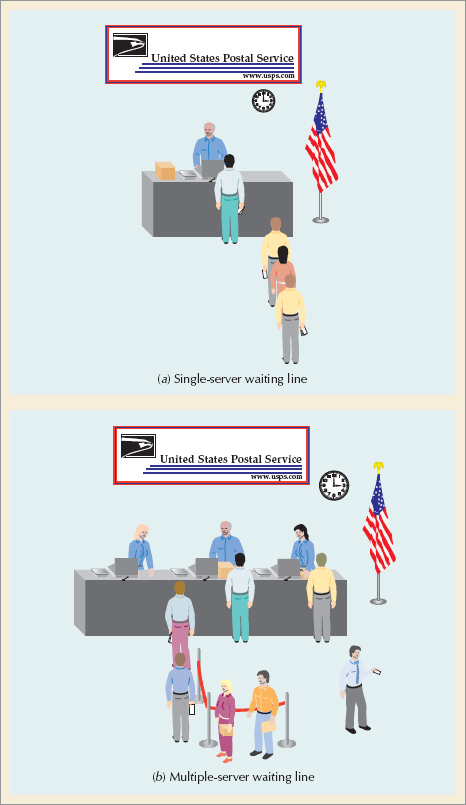
Waiting line processes are generally categorized into four basic structures, according to the nature of the service facilities. In technical terminology they are called single-channel, single-phase; single-channel, multiple-phase; multiple-channel, single-phase; and multiple-channel, multiple-phase processes.
The number of channels in a queuing process is the number of parallel servers available. The number of phases, on the other hand, denotes the number of sequential servers each customer must go through to complete service. An example of a single-channel, single-phase queuing operation is a post office with only one postal clerk waiting on a single line of customers. This is more commonly called simply a single-server waiting line, and it is illustrated in Figure 5.9a. A post office with several postal clerks waiting on a single line of customers is an example of a multiple-channel, single-phase process or simply a multiple-server waiting line. It is illustrated in Figure 5.9b. These are the two basic waiting line structures we will focus on in this chapter.
•Channels: the number of parallel servers for servicing customers.
•Phases: the number of servers in sequence a customer must go through.
The other two waiting line structures we mentioned have multiple phases; that is, they have a sequence of servers, one following another. For example, when patients go to a clinic for treatment or check into a hospital, they first wait in a reception room, then they may go to an office to fill out some paperwork. When they get to the treatment room, the patients receive an initial checkup or treatment from a nurse, followed by treatment from a doctor. This arrangement constitutes a single-channel, multiple-phase queuing process. If there are several doctors and nurses, the process is a multiple-channel, multiple-phase process. Another example of a multiple-phase system is a manufacturing assembly line in which a product is worked on at several sequential machines or by several sequential operators at workstations. These are more complex structures and are beyond the scope of this text.
You may quickly visualize a familiar waiting situation that fits none of these categories of waiting line structures. The four waiting line structures we have described are simply the four basic general categories; but there are many variations, which often require very complex mathematical formulas to analyze. In some cases they can only be analyzed using simulation (the topic of Supplement 12). However, the basic fundamentals of waiting line analysis for the simpler queuing models that we will discuss in this chapter are relevant to the analysis of all queuing problems, regardless of their complexity.
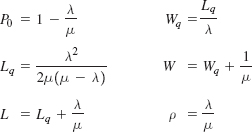
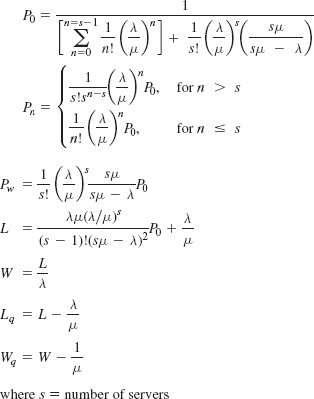
Table 5.2. Queuing System Operating Characteristics
Operating Characteristic | |
|---|---|
L | Average number of customers in the system (waiting and being served) |
Lq | Average number of customers in the waiting line |
W | Average time a customer spends in the system (waiting and being served) |
Wq | Average time a customer spends waiting in line |
Po | Probability of no (i.e., zero) customers in the system |
Pn | Probability of n customer in the system |
ρ | Utilization rate; the proportion of the time the system is in use |
The mathematics used in waiting line analysis do not provide an optimal, or "best," solution. Instead they generate measures referred to as operating characteristics that describe the performance of the waiting line system and that management uses to evaluate the system and make decisions. It is assumed these operating characteristics will approach constant, average values after the system has been in operation for a long time, which is referred to as a steady state. These basic operating characteristics used in a waiting line analysis are defined in Table 5.2.
A steady state is a constant, average value for performance characteristics that the system will attain after a long time.
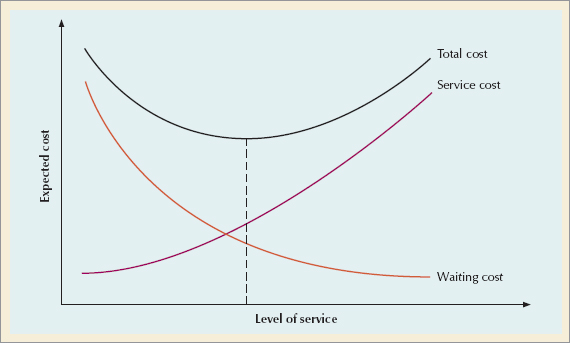
There is generally an inverse relationship between the cost of providing service and the cost of making customers wait, as reflected in the cost curves in Figure 5.10. As the level of service, reflected by the number of servers, goes up, the cost of service increases, whereas waiting cost decreases. In the traditional view of waiting line analysis, the level of service should coincide with the minimum point on the total cost curve.
As the level of service improves, the cost of service increases.
The cost of providing the service is usually reflected in the cost of the servers, such as the cost of the tellers at a bank, postal workers at a post office counter, or the repair crew in a plant or shop. As the number of servers is increased to reduce waiting time, service cost goes up. Service cost is normally direct and easy to compute. The cost of waiting is not as easy to determine. The major determinant of waiting cost is the loss of business that might result because customers get tired of waiting or frustrated and leave. This business loss can be temporary (a single event) or permanent (the customer never comes back). The cost due to a loss of business is especially difficult to determine, since it is not part of normal accounting records, although some trade organizations for businesses and industries occasionally provide such data. Other types of waiting costs include the loss of production time and salary for employees waiting to use machinery or load and unload vehicles.
Better service typically requires more servers.
Most companies and organizations that have waiting as an integral part of their service process usually establish a goal for customer waiting time that corresponds to a level of service they want to achieve. For example, Taco Bell has determined that a three-minute average waiting time will result in only 2.5% of customers leaving, which they consider to be an acceptable service goal. Bank of America has a similar waiting time goal for serving its bank customers. The U.S. Postal Service has a goal of five minutes to serve its retail customers.
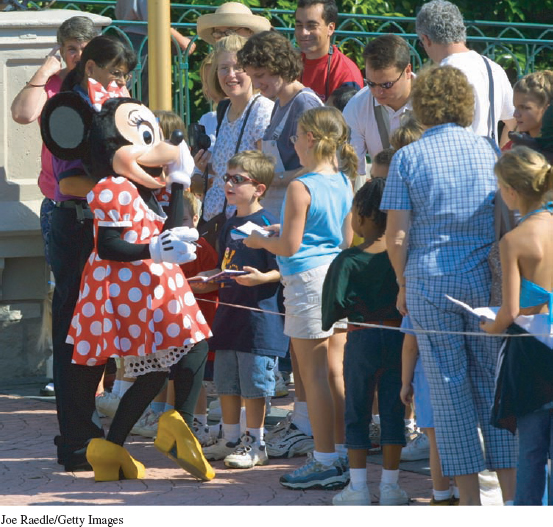
In some instances, it is not possible to reduce waiting times, or other important issues besides cost may be involved. When these situations occur, the problem of providing quality service often depends more on psychological solutions. In other words, the organization will try to make waiting more palatable. For example, long lines are fairly common at Disney World, especially at certain peak times during the day. Although it is unlikely that any company has analyzed the technical aspects of waiting more than Disney, customers must still wait for long periods of time at certain shows, exhibits, and rides. Given the limited physical capacity of some attractions, the time required for a customer to complete them, and the large flow of customers, it is simply not possible to make the lines shorter or the service quicker without letting fewer people into the park. In these cases Disney management attempts to improve service in other ways to reduce customer dissatisfaction. For example, they make use of costumed characters to entertain customers waiting in line and distract them from the long waits. Mobile vendors sell food, drinks, and souvenirs to people in line. They provide accurate wait times, which are more tolerable than vague ones, and they provide frequent updates. For customers who are particularly annoyed by long waits, they sell special passes for a fee that allows customers to go to the front of the line for some attractions and to get into the park early before its normally scheduled opening.
Disney uses costumed characters like Minnie Mouse to entertain customers waiting in line to distract them from their long wait.
Waiting rooms, such as at a doctor's office, provide magazines and newspapers for customers to read while waiting. Televisions are occasionally available in auto repair waiting areas, in airport terminals, or in bars and lounges of restaurants where customers wait. Mirrors are purposely located near elevators to distract people while they wait. Supermarkets locate magazines and other "impulse-purchase" items at the checkout counter, not only as a diversion while waiting but as potential purchases. All these tactics are designed to improve the quality of service that requires waiting without actually incurring the cost of reducing waiting time.
Some service companies attempt to handle customer arrivals in a "smarter" way, by providing selective preferential treatment to certain types of customers in order to reduce their waiting time. For example, grocery stores have express lanes for customers with only a few purchases. Airlines and car rental agencies issue special cards to frequent-use customers or customers who pay an additional fee that allows them to join special waiting lines at their check-in counters. Telephone retailers check the phone numbers of incoming calls, and based on a customer's sales history, route the call to more experienced or specialized salespeople.
For some critical service providers, waiting times of any duration are simply not allowable. A police or fire department must provide sufficient service capacity so that calls for assistance can have quick response. This often results in long periods of underutilization where police officers, or firefighters are not doing anything. In these cases, cost takes a back seat to service.
The simplest, most basic waiting line structure illustrated in Figure 5.9 is the single-server model. We run into this type of waiting line every day. When you buy a cup of coffee at your local Star-bucks, when you go to a professor's office, when you use the copier in the library, and when you buy a ticket to see a movie, you wait in line to be served by one server.
There are several variations of the single-server waiting line system, however, in the basic single-server model we assume the following:
Poisson arrival rate
Exponential service times
First-come, first-served queue discipline
Infinite queue length
Infinite calling population
Assumptions of the basic single-server model.
λ = mean arrival rate;
μ = mean service rate.
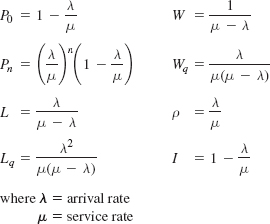
The basic operating characteristics of this single-server model are computed using the following formulas, where λ = mean arrival rate, μ = mean service rate, and n = the number of customers in the waiting line system, including the customer being served (if any).
The probability that no customers are in the queuing system (either in the queue or being served) is
Basic single-server queuing formulas.
The probability of exactly n customers in the queuing system is
The average number of customers in the queuing system (i.e., the customers being serviced and in the waiting line) is
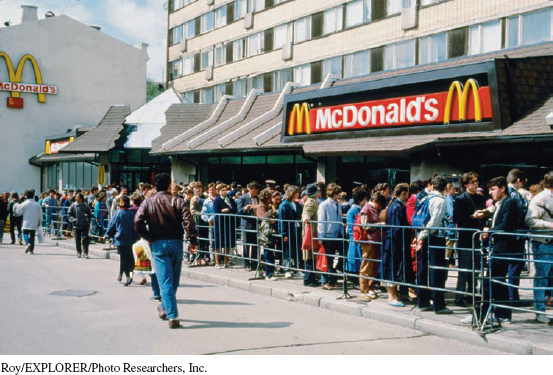
"Good" operating characteristics for a waiting line system, and hence good service, are relative and must have some basis for comparison. For example, the waiting time at this McDonald's in Pushkin Square in Moscow averages about 45 minutes. Americans would not accept this level of service. To Muscovites used to waiting in lines that often consume the better part of a day, the waiting time at this McDonald's is amazingly short. It represents good service to them.
The average number of customers in the waiting line is
The average time a customer spends in the queuing system (i.e., waiting and being served) is
The average time a customer spends waiting in line to be served is
The probability that the server is busy and a customer has to wait, known as the utilization factor, is
The probability that the server is idle and a customer can be served is
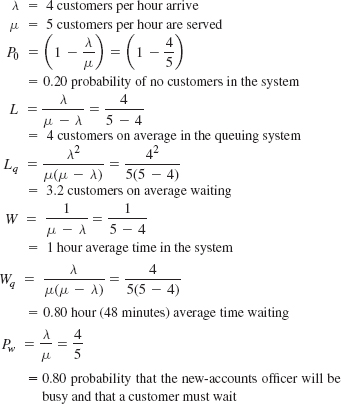
Remember that these operating characteristics are averages that result over a period of time; they are not absolutes. In other words, customers who arrive at the bookstore checkout counter will not find 3.2 customers in line. There could be no customers or 1, 2, 3, or 4 customers. The value 3.2 is simply an average over time, as are the other operating characteristics. Notice that there are four customers in the system (L = 4) and 3.2 customers in line (Lq = 3.2). The difference is only 0.8 customer being served because 20% of the time there is no customer being served (I = .20). Also note that the total time in the system of 10 minutes (W = 10) is exactly equal to the waiting time of 8 minutes (Wq = 8) plus the service time of 2 minutes (i.e., 60/30).
The operating characteristics developed from the queuing formulas in Example 5.1 indicate the quality of service at the Tech auxiliary bookstore. The average waiting time of eight minutes is excessive and would likely cause customers to become frustrated and leave without making a purchase. Normally, a waiting time of two to three minutes is the most a customer will comfortably tolerate at a store like this. Thus, the bookstore management could use the operating characteristics to formulate new strategies to improve service and then test these strategies.
A Single-Server Model
The auxiliary bookstore in the student center at Tech is a small facility that sells school supplies and snacks. It has one checkout counter where one employee operates the cash register. The cash register and operator represent the server in this waiting line system; the customers who line up at the counter to pay for their selections form the waiting line.
Customers arrive at a rate of 24 per hour according to a Poisson distribution (λ = 24), and service times are exponentially distributed, with a mean rate of 30 customers per hour (μ = 30). The bookstore manager wants to determine the operating characteristics for this waiting line system.
Solution
The operating characteristics are computed using the queuing formulas for the single-server model as follows:
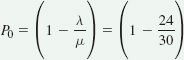
= 0.20 probability of no customers in the system
= 4 customers on the average in the queuing system
= 3.2 customers on the average in the waiting line
= 0.167 hour (10 minutes) average time in the system per customer
= 0.133 hour (8 minutes) average time in the waiting line per customer
= 0.80 probability that the server will be busy and the customer must wait
I = 1 – ρ = 1 – 0.80
= 0.20 probability that the server will be idle and a customer can be served
For example, the bookstore might consider adding an additional employee to assist the present operator. This would enable more customers to be served in less time, thus increasing the service rate. If the service rate were increased from 30 customers per hour to 40 customers per hour, the waiting time would be reduced to only 2.25 minutes. Management would then have to decide whether the cost of the new employee is worth the reduction in waiting time. Alternatively, the bookstore could be redesigned to add an additional cash register as well as another employee to operate it. This would have the effect of reducing the arrival rate. If exiting customers split evenly between the two cash registers, then the arrival rate at each register would decrease from 24 per hour to 12 per hour with a resulting customer waiting time of 1.33 minutes. Again, management would have to determine whether the reduction in waiting time is worth the cost of a new cash register and employee. This is the crux of waiting line analysis: determining whether the improvement in service is worth the cost to achieve it.
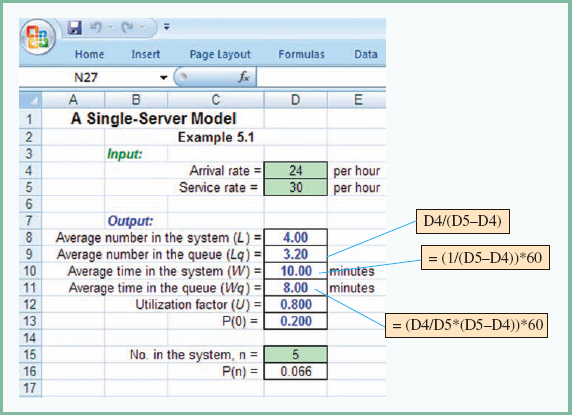
Excel can be used to solve all of the queuing models in this chapter. The Excel solution screen for the single-server model for the auxiliary bookstore at Tech in Example 5.1 is shown in Exhibit 5.1. Excel files for this exhibit and all other exhibits in this chapter can be downloaded from the text Web site.
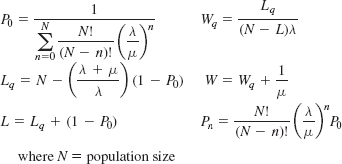
There are many variations of the single-server model as shown in Figure 5.11. The most common are: constant service times, finite queue length, and finite calling populations.
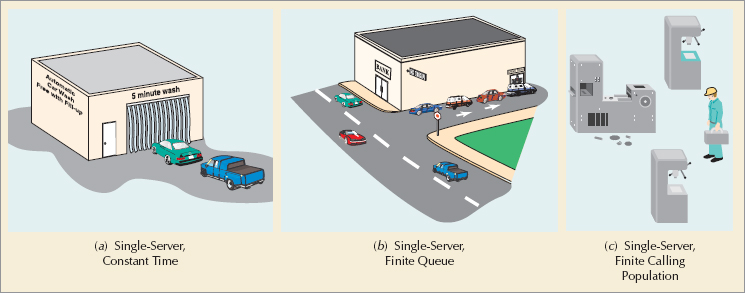
Constant service times occur most often when automated equipment or machinery performs the service. Examples are vending machines, car washes, and many manufacturing operations.
Finite queue lengths occur when there is a physical limitation to the length of the waiting line. For example, this can occur when cars waiting at a bank for an ATM machine are prohibited from extending into the street.
A finite calling population refers to a situation when the number of "customers" that can arrive to a system is limited, such as invitation-only events, student advisees, or maintenance for a fleet of rental cars.
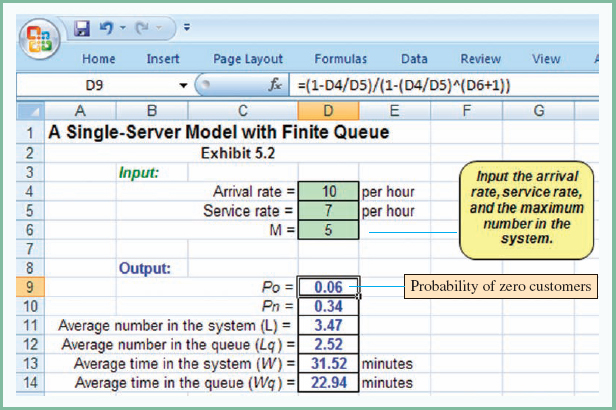
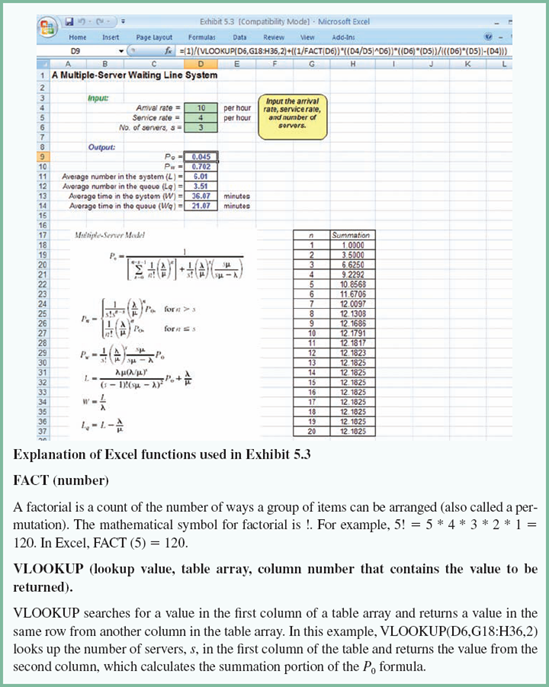
The formulas for these models, included in the Summary of Key Formulas at the end of the chapter, can be quite involved. For that reason, all of these models, along with the single-server model and the multiple-server model discussed in the next section, can be solved with the Excel add-in that accompanies this book, OM Tools. Exhibit 5.2 shows the OM Tools solution to a single-server finite queue problem.
A large number of operational waiting line systems include multiple servers. These models can be very complex, so in this section we present only the most basic multiple-server (or channel) waiting line structure. This system includes a single waiting line and a service facility with several independent servers in parallel, as shown in Figure 5.9b. An example of a multiple-server system is an airline ticket and check-in counter, where passengers line up in a roped-off single line waiting for one of several agents for service. The same waiting line structure is found at the post office, where customers in a single line wait for service from several postal clerks, or at a multiplex theater where customers typically line up in a single line to buy movie tickets from one of several ticket sellers.
With multiple-server models, two or more independent services in parallel serve a single waiting line.
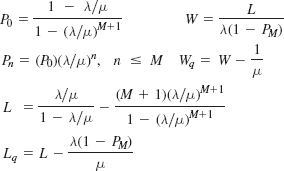
The formulas for determining the operating characteristics for the multiple-server model are based on the same assumptions as the single-server model—Poisson arrival rate, exponential service times, infinite calling population and queue length, and FIFO queue discipline. Also, recall that in the single-server model, μ > λ; however, in the multiple-server model, sμ > λ, where s is the number of servers. The operating characteristics formulas are as follows.
sμ > λ: The total number of servers must be able to serve customers faster than they arrive.
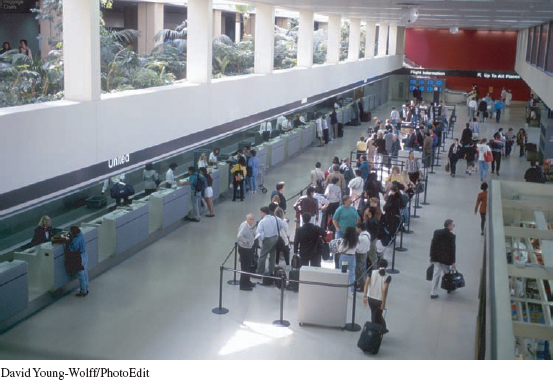
These passengers waiting in line to purchase tickets or check baggage and get a boarding pass at LAX are part of a waiting line system with multiple servers. Passengers are cordoned into a single line to wait for one of several airline agents to serve them. The number of agents scheduled for duty at the check-in counter is determined by waiting line operating characteristics based on different passenger arrival rates during the day and for different days.
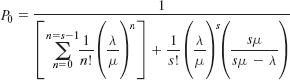
The probability that there are no customers in the system (all servers are idle) is
The probability of n customers in the queuing system is
The probability that a customer arriving in the system must wait for service (i.e., the probability that all the servers are busy) is
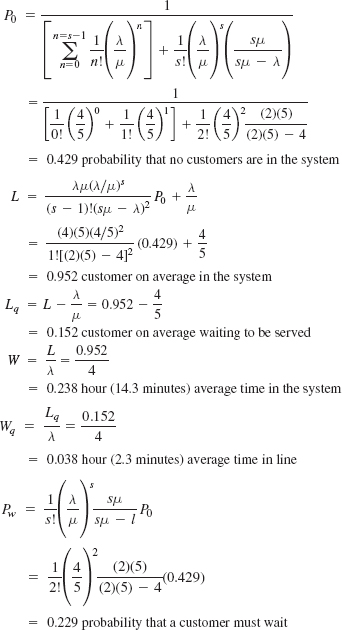
A Multiple-Server Waiting Line System
The student health service at Tech has a waiting room in which chairs are placed along a wall, forming a single waiting line. Some students have health problems that only require a nurse. The students are served by three nurses, each located in a separate room. Students are treated on a first-come, first-served basis.
The health service administrator wants to analyze this queuing system because excessive waiting times can make students angry and they complain. Students have a medical problem and thus are impatient anyway. Waiting increases their impatience.
A study of the health service for a six-month period shows that an average of 10 students arrive per hour (according to a Poisson distribution), and an average of four students can be served per hour by a nurse (Poisson distributed). Compare a three-server versus four-server system.
Solution
λ = 10 students per hour
μ = 4 students per hour per service representative
s = 3 service representatives
sμ = (3)(4) = 12 (> λ = 10)
= 0.703 probability that a student must wait for service
(i.e., that there are three or more students in the system)
The health service administrator has observed that students are frustrated by the waiting time of 21 minutes and the 0.703 probability of waiting. To try to improve matters, the administrator is considering adding another nurse. The operating characteristics for this system must be recomputed with s = 4 nurses.
b) Four-server system
Substituting s = 4 along with λ and μ in the queuing formulas results in the following operating characteristics:
P0 = 0.073 probability that no students are in the health service
L = 3.0 students in the health service
W = 0.30 hour, or 18 minutes, in the health service
Lq = 0.5 students waiting to be served
Wq = 0.05 hour, or 3 minutes, waiting in line
Pw = 0.31 probability that a student must wait for service
These results are significantly better; waiting time is reduced from 21 minutes to 3 minutes. This improvement in the quality of the service would have to be compared to the cost of adding an extra nurse.
Services represent the fastest growing sector of the global economy and account for two thirds of global output, one third of global employment and nearly 20% of global trade. The world's most industrialized nations are predominantly service economies.
Service design and operations present unique challenges due to the intangible nature of services, the inherent variability in service delivery, and the co-production of value by the customer and service provide. The design process involves developing a service concept, defining the service package, and determining performance, design and delivery specifications. Design tools such as service blueprints, servicescapes, service scripts, and waiting line analysis facilitate the design process.
Since waiting is an integral part of many service-related operations, it is an important area of analysis. The mathematical formulas presented in this chapter for modeling various waiting line structures provide the basis for designing and improving service systems.
arrival rate the rate (λ) at which customers arrive at a service facility during a specified period.
calling population the source of customers to a waiting line.
channels the number of parallel servers.
delivery specification specify schedules, deliverables, location.
design specification describe the service in enough detail to be replicate.
goods tangible objects that can be created and sold at a later date.
infinite queue a waiting line that grows to any length.
line of influence signs or activities that influences a customer to seek a service.
line of interaction point where a customer and service provider interact.
line of support point where a service provider interacts with support personnel.
line of visibility separates front office and back office activities.
operating characteristics measures of waiting line performance expressed as averages.
performance specification outline expectations and requirements.
phases the number of sequential servers a customer must go through to receive service.
queue a single waiting line that forms in front of a service facility.
queue discipline the order in which customers are served.
services acts, deeds or performances that provide value to the customer.
servicescapes the design of the physical environment (including signs, symbols and, artifacts) in which a service takes place.
service blueprinting a specialized flow chart used for service processes.
service concept the purpose of a service; it defines the target market and the customer experience.
service package the mixture of physical items, sensual benefits, and psychological benefits provided to the customer.
service time the time required to serve a customer; the time period divided by service time yields the service rate (μ).
utilization factor (ρ) the probability the server is busy and the customer must wait.
Single-Server Model
Single-Server Model with Finite Calling Population
Single-Server Model with Finite Queue
where M = maximum number allowed in the system
Single-Server Model with Constant Service Times
Multiple-Server Model
1. SINGLE-SERVER MODEL
The new-accounts officer at the Citizens Northern Savings Bank enrolls all new customers in checking accounts. During the three-week period in August encompassing the beginning of the new school year at State University, the bank opens a lot of new accounts for students. The bank estimates that the arrival rate during this period will be Poisson distributed with an average of four customers per hour. The service time is exponentially distributed with an average of 12 minutes per customer to set up a new account. The bank wants to determine the operating characteristics for this system to determine if the current person is sufficient to handle the increased traffic.
SOLUTION
Determine operating characteristics for the single-server system:
The average waiting time of 48 minutes and the average time in the system are excessive, and the bank needs to add an extra employee during the busy period.
2. MULTIPLE-SERVER MODEL
The Citizens Northern Bank wants to compute the operating characteristics if an extra employee were added to assist with new-accounts enrollments.
SOLUTION
Determine the operating characteristics for the multiple-server system:
λ = 4 customers per hour arrive
μ = 5 customers per hour are served
s = 2 servers
The waiting time with the multiple-server model is 2.3 minutes, which is a significant improvement over the previous system; thus, the bank should add the second new-accounts officer.
5-1. How would you define a service?
5-2. List eight characteristics of services and explain what impact each characteristic has on the design process.
5-3. Describe the service package for (a) a bank, (b) an airline, and (c) a lawn service.
5-4. Generate as many ideas as you can for additional services or improvements in service delivery for (a) banking, (b) higher education, and (c) health care.
5-5. Go to www.ibm.com and search for SSME. Why is it important to IBM?
5-6. Identify 10 real-life examples of queuing systems with which you are familiar.
5-7. Why must the utilization factor in a single-server model be less than one?
5-8. Give five examples of real-world queuing systems with finite calling populations.
5-9. List the elements that define a queuing system.
5-10. How can the results of queuing analysis be used by a decision maker for making decisions?
5-11. What is the mean effective service rate in a multiple-server model, and what must be its relationship to the arrival rate?
5-12. For each of the following queuing systems, indicate if it is a single- or multiple-server model, the queue discipline, and if its calling population is infinite or finite:
Hair salon
Bank
Laundromat
Doctor's office
Adviser's office
Airport runway
Service station
Copy center
Team trainer
Mainframe computer
5-13. For Example 5.1 in this chapter, discuss why the multiple-server model would or would not be appropriate as an alternative to reduce waiting time.
5-14. Discuss briefly the relationship between waiting line analysis and quality improvement.
5-15. Define the four basic waiting line structures and give an example of each.
5-16. Describe the traditional cost relationship in waiting line analysis.
5-17.
Is the following statement true or false? The single-phase, single-channel model with Poisson arrivals and undefined service times will always have larger (i.e., greater) operating characteristic values (i.e., W, Wq, L, Lq) than the same model with exponentially distributed service times. Explain your answer.
Is the following statement true or false? The single-phase, single-channel model with Poisson arrivals and constant service times will always have smaller (i.e., lower) operating characteristic values (i.e., W, Wq, L, Lq) than the same model with exponentially distributed service times. Explain your answer.
5-18. Under what conditions can the basic single-server and multiple-server models be used to analyze a multiple-phase waiting line system?
5-19. Why do waiting lines form at a service facility even though there may be more than enough service capacity to meet normal demand in the long run?
5-20. Provide an example of when a first-in, first-out (FIFO) rule for queue discipline would not be appropriate.
5-21. Under what conditions will the single-channel, single-phase queuing model with Poisson arrivals and undefined service times provide the same operating characteristics as the basic model with exponentially distributed service times?
5-22. What types of waiting line systems have constant service times?
5-1. McBurger's fast-food restaurant has a drive-through window with a single server who takes orders from an intercom and also is the cashier. The window operator is assisted by other employees who prepare the orders. Customers arrive at the ordering station prior to the drive-through window every 3.6 minutes (exponentially distributed) and the service time is 2.4 minutes (exponentially distributed). Determine the average length of the waiting line and the waiting time. Discuss the quality implications of your results. If you decide that the quality of the service could be improved, indicate what things you might do to improve quality.
5-2. The ticket booth on the Tech campus is operated by one person, who is selling tickets for the annual Tech versus State football game on Saturday. The ticket seller can serve an average of 12 customers per hour (Poisson distributed); on average, 8 customers arrive to purchase tickets each hour (Poisson distributed). Determine the average time a ticket buyer must wait and the portion of time the ticket seller is busy.
5-3. The Minute Stop Market has one pump for gasoline, which can service 10 customers per hour (Poisson distributed). Cars arrive at the pump at a rate of 5 per hour (Poisson distributed).
Determine the average queue length, the average time a car is in the system, and the average time a car must wait.
If, during the period from 4:00 p.m. to 5:00 p.m., the arrival rate increases to 12 cars per hour, what will be the effect on the average queue length?
5-4. The Universal Manufacturing Company produces a particular product in an assembly-line operation. One of the machines on the line is a drill press that has a single assembly line feeding into it. A partially completed unit arrives at the press to be worked on every 8 minutes, on average, according to an exponential distribution. The machine operator can process an average of 10 parts per hour (Poisson distributed). Determine the average number of parts waiting to be worked on, the percentage of time the operator is working, and the percentage of time the machine is idle.
5-5. The management of Universal Manufacturing Company (Problem 5-4) likes to have its operators working 90% of the time. What must the assembly line arrival rate be in order for the operators to be as busy as management would like?
5-6. The Peachtree Airport in Atlanta serves light aircraft. It has a single runway and one air traffic controller to land planes. It takes an airplane 8 minutes to land and clear the runway (exponentially distributed). Planes arrive at the airport at the rate of 5 per hour (Poisson distributed).
Determine the average number of planes that will stack up waiting to land.
Find the average time a plane must wait in line before it can land.
Calculate the average time it takes a plane to clear the runway once it has notified the airport that it is in the vicinity and wants to land.
The FAA has a rule that an air traffic controller can, on the average, land planes a maximum of 45 minutes out of every hour. There must be 15 minutes of idle time available to relieve the tension. Will this airport have to hire an extra air traffic controller?
5-7. The National Bank of Union City currently has one outside drive-up teller. It takes the teller an average of three minutes (exponentially distributed) to serve a bank customer. Customers arrive at the drive-up window at the rate of 12 per hour (Poisson distributed). The bank operations officer is currently analyzing the possibility of adding a second drive-up window at an annual cost of $20,000. It is assumed that arriving cars would be equally divided between both windows. The operations officer estimates that each minute's reduction in customer waiting time would increase the bank's revenue by $2000 annually. Should the second drive-up window be installed? What other factors should be considered in the decision besides cost?
5-8. During registration at Tech every quarter, students in the Department of Management must have their courses approved by the departmental advisor. It takes the advisor an average of five minutes (exponentially distributed) to approve each schedule, and students arrive at the adviser's office at the rate of 10 per hour (Poisson distributed). Compute L, Lq, W, Wq, and ρ. What do you think about this system? How would you change it?
5-9. All trucks traveling on Interstate 40 between Albuquerque and Amarillo are required to stop at a weigh station. Trucks arrive at the weigh station at a rate of 120 per eight-hour day (Poisson distributed), and the station can weigh, on the average, 140 trucks per day (Poisson distributed).
Determine the average number of trucks waiting, the average time spent at the weigh station by each truck, and the average waiting time before being weighed for each truck.
If the truck drivers find out they must remain at the weigh station longer than 15 minutes on the average, they will start taking a different route or traveling at night, thus depriving the state of taxes. The state of New Mexico estimates it loses $10,000 in taxes per year for each extra minute (over 15) that trucks must remain at the weigh station. A new set of scales would have the same service capacity as the present set of scales, and it is assumed that arriving trucks would line up equally behind the two sets of scales. It would cost $50,000 per year to operate the new scales. Should the state install the new set of scales?
5-10. In Problem 5-9(a), suppose arriving truck drivers look to see how many trucks are waiting to be weighed at the weigh station. If they see four or more trucks in line, they will pass by the station and risk being caught and ticketed. What is the probability that a truck will pass by the station?
5-11. In Problem 5-8, the head of the Management Department at Tech is considering the addition of a second advisor in the college advising office to serve students waiting to have their schedules approved. This new advisor could serve the same number of students per hour as the present advisor. Determine L, Lq, W, and Wq for this altered advising system. As a student, would you recommend adding the advisor?
5-12. Annie Campbell is a nurse on the evening shift from 10:00 p.m. to 6:00 a.m. at Community Hospital. She is responsible for 15 patients in her area. She averages two calls from each of her patients every evening (Poisson distributed), and she must spend an average of 10 minutes (negative exponential distribution) with each patient who calls. Nurse Smith has indicated to her shift supervisor that although she has not kept records she believes her patients must wait about 10 minutes on average for her to respond and she has requested that her supervisor assign a second nurse to her area. The supervisor believes 10 minutes is too long to wait, but she does not want her nurses to be idle more than 40% of the time. Determine what the supervisor should do.
5-13. Wallace Publishers has a large number of employees who use the company's single fax machine. Employees arrive randomly to use the fax machine at an average rate of 20 per hour. This arrival process is approximated by a Poisson distribution. Employees spend an average of two minutes using the fax machine, either transmitting or receiving items. The time spent using the machine is distributed according to a negative exponential distribution. Employees line up in single file to use the machine, and they obtain access to it on a first-come, first-served basis. There is no defined limit to the number who can line up to use the machine.
Management has determined that by assigning an operator to the fax machine rather than allowing the employees to operate the machine themselves, it can reduce the average service time from the current 2 minutes to 1.5 minutes. However, the fax operator's salary is $8 per hour, which must be paid 8 hours per day even if there are no employees wishing to use the fax machine part of the time. Management has estimated the cost of employee time spent waiting in line and at the fax machine during service to be 17¢ per minute (based on an average salary of $10.20 per hour per employee). Should the firm assign an operator to the fax machine?
5-14. The Universal Manufacturing Company has a single assembly line that feeds two drill presses in parallel. As partially completed products come off the line, they are lined up to be worked on as drill presses become available. The units arrive at the workstation (containing both presses) at the rate of 90 per hour (Poisson distributed). Each press operator can process an average of 60 units per hour (Poisson distributed). Compute L, Lq, W, and Wq.
5-15. The Escargot is a small French restaurant with 6 waiters and waitresses. The average service time at the restaurant for a table (of any size) is 80 minutes (exponentially distributed). The restaurant does not take reservations and parties arrive for dinner (and stay and wait) every 16 minutes (Poisson distributed). The restaurant is concerned that a lengthy waiting time might hurt its business in the long run. What is the current waiting time and queue length for the restaurant? Discuss the quality implications of the current waiting time and any actions the restaurant might take.
5-16. Cakes baked by the Freshfood Bakery are transported from the ovens to be packaged by one of three wrappers. Each wrapper can wrap an average of 120 cakes per hour (Poisson distributed). The cakes are brought to the wrappers at the rate of 300 per hour (Poisson distributed). If a cake sits longer than 5 minutes before being wrapped, it will not be fresh enough to meet the bakery's quality control standards. Does the bakery need to hire another wrapper?
5-17. The Draper Clinic has two general practitioners who see patients daily. An average of 6.5 patients arrive at the clinic per hour (Poisson distributed). Each doctor spends an average of 15 minutes (exponentially distributed) with a patient. The patients wait in a waiting area until one of the two doctors is able to see them. However, since patients typically do not feel well when they come to the clinic, the doctors do not believe it is good practice to have a patient wait longer than an average of 20 minutes. Should this clinic add a third doctor, and, if so, will this alleviate the waiting problem?
5-18. The Wearever Shoe Company is going to open a new branch at a mall, and company managers are attempting to determine how many salespeople to hire. Based on an analysis of mall traffic, the company estimates that customers will arrive at the store at the rate of 9 per hour (Poisson distributed), and from past experience at its other branches, the company knows that salespeople can serve an average of 6 customers per hour (Poisson distributed). How many salespeople should the company hire in order to maintain a company policy that on average a customer should have to wait for service no more than 30% of the time?
5-19.. When customers arrive at Gilly's Ice Cream Shop, they take a number and wait to be called to purchase ice cream from one of the counter servers. From experience in past summers, the store's staff knows that customers arrive at the rate of 35 per hour (Poisson distributed) on summer days between 3:00 p.m. and 10:00 p.m. and a server can serve 15 customers per hour on average (Poisson distributed). Gilley's wants to make sure that customers wait no longer than 5 minutes for service. Gilley's is contemplating keeping three servers behind the ice cream counter during the peak summer hours. Will this number be adequate to meet the waiting time policy?
5-20.. Huang's television-repair service receives an average of four TV sets per 8-hour day to be repaired. The service manager would like to be able to tell customers that they can expect their TV back in 3 days. What average repair time per set will the repair shop have to achieve to provide 3-day service on the average? (Assume that the arrival rate is Poisson distributed and repair times are exponentially distributed.)
5-21.. Partially completed products arrive at a workstation in a manufacturing operation at a mean rate of 40 per hour (Poisson distributed). The processing time at the workstation averages 1.2 minutes per unit (exponentially distributed). The manufacturing company estimates that each unit of in-process inventory at the workstation costs $31 per day (on the average). However, the company can add extra employees and reduce the processing time to 0.90 minute per unit at a cost of $52 per day. Determine whether the company should continue the present operation or add extra employees.
5-22. The Seaboard Shipping Company has a warehouse terminal in Spartanburg, South Carolina. The capacity of each terminal dock is three trucks. As trucks enter the terminal, the drivers receive numbers, and when one of the three dock spaces becomes available, the truck with the lowest number enters the vacant dock. Truck arrivals are Poisson distributed, and the unloading and loading times (service times) are exponentially distributed. The average arrival rate at the terminal is five trucks per hour, and the average service rate per dock is two trucks per hour (30 minutes per truck).
Compute L, Lq,W, and Wq.
The management of the shipping company is considering adding extra employees and equipment to improve the average service time per terminal dock to 25 minutes per truck. It would cost the company $18,000 per year to achieve this improved service. Management estimates that it will increase its profit by $750 per year for each minute it is able to reduce a truck's waiting time. Determine whether management should make the investment.
Now suppose that the managers of the shipping company have decided that truck waiting time is excessive and they want to reduce the waiting time. They have determined that there are two alternatives available for reducing the waiting time. They can add a fourth dock, or they can add extra employees and equipment at the existing docks, which will reduce the average service time per location from the original 30 minutes per truck to 23 minutes per truck. The costs of these alternatives are approximately equal. Management desires to implement the alternative that reduces waiting time by the greatest amount. Which alternative should be selected?
5-23. Drivers who come to get their licenses at the department of motor vehicles have their photograph taken by an automated machine that develops the photograph onto the license card and laminates the complete license. The machine requires a constant time of 4.5 minutes to develop a completed license. If drivers arrive at the machine at the mean rate of 11 per hour (Poisson distributed), determine the average length of the waiting line and the average waiting time.
5-24. A vending machine at Municipal Airport dispenses hot coffee, hot chocolate, or hot tea in a constant service time of 30 seconds. Customers arrive at the vending machine at a mean rate of 50 per hour, Poisson distributed. Determine the average length of the waiting line and the average time a customer must wait.
5-25. In Problem 5-20 suppose that Huang's television-repair service cannot accommodate more than 10 TV sets at a time (under repair and waiting for service). What is the probability that the number of TV sets on hand will exceed the shop capacity?
5-26. Norfolk, Virginia, a major seaport on the East Coast, has a ship coal-loading facility. Currently, coal trucks filled with coal arrive at the port facility at the mean rate of 149 per day (Poisson distributed). The facility operates 24 hours a day. The coal trucks are unloaded one at a time on a first-come, first-served basis by automated mechanical equipment that empties the trucks in a constant time of eight minutes per truck, regardless of truck size. The port authority is negotiating with a coal company for an additional 30 trucks per day. However, the coal company will not use this port facility unless the port authority can assure them that their coal trucks will not have to wait to be unloaded at the port facility for more than 12 hours per truck on the average. Can the port authority provide this assurance?
5-27. The Waterfall Buffet in the lower level of the National Art Gallery serves food cafeteria-style daily to visitors and employees. The buffet is self-service. From 7:00 a.m. to 9:00 a.m. customers arrive at the buffet at a rate of eight per minute; from 9:00 a.m. to noon, at four per minute; from noon to 2:00, at 14 per minute; and from 2:00 p.m. to closing at 5:00 p.m., at eight per minute (Poisson distributed). All the customers take about the same amount of time to serve themselves and proceed to the buffet. Once a customer goes through the buffet, it takes an average of 0.4 minute (exponentially distributed) to pay the cashier. The gallery does not want a customer to have to wait longer than four minutes to pay. How many cashiers should be working at each of the four times during the day?
5-28. The Hair Port is a hair-styling salon at Riverside Mall. Four stylists are always available to serve customers on a first-come, first-served basis. Customers arrive at an average rate of four per hour (Poisson distributed), and the stylists spend an average of 45 minutes (exponentially distributed) on each customer.
Determine the average number of customers in the salon, the average time a customer must wait, and the average number waiting to be served.
The salon manager is considering adding a fifth stylist. Would this have a significant impact on waiting time?
5-29. The Riverton Police Department has eight patrol cars that are on constant call 24 hours per day. A patrol car requires repairs every 30 days, on average, according to an exponential distribution. When a patrol car is in need of repair it is driven into the motor pool, which has a repairperson on duty at all times. The average time required to repair a patrol car is 12 hours (exponentially distributed). Determine the average time a patrol car is not available for use and the average number of patrol cars out of service at any one time, and indicate if the repair service seems adequate.
5-30. The Crosstown Cab Company has four cabs on duty during normal business hours. The cab company dispatcher receives requests for service every seven minutes, on average, according to an exponential distribution. The average time to complete a trip is 20 minutes (exponentially distributed). Determine the average number of customers waiting for service and the average time a customer must wait for a cab.
5-31. A retail catalogue operation employs a bank of six telephone operators who process orders using computer terminals. When a terminal breaks down, it must be disconnected and taken to a nearby electronics repair shop, where it is repaired. The mean time between terminal breakdowns is six working days, and the mean time required to repair a terminal is two working days (both exponentially distributed). As a result of lost sales, it costs the mail-order operation an estimated $50 per day in lost profits each day a terminal is out for repair. The company pays the electronics repair shop $3000 per year on a service agreement to repair the terminals. The company is considering the possibility of signing a new service agreement with another electronics repair shop that will provide substitute terminals while the broken ones are at the repair shop. However, the new service agreement would cost the mail-order operation $15,000 per year. Assuming that there are 250 working days in a year, determine what the mail-order operation should do.
5-32. The Baytown Post Office has four stations for service. Customers line up in single file for service on an FIFO basis. The mean arrival rate is 40 per hour, Poisson distributed, and the mean service time per server is five minutes, exponentially distributed. Compute the operating characteristics for this operation. Does the operation appear to be satisfactory in terms of: (a) postal workers' (servers') idle time; (b) customer waiting time and/or the number waiting for service; and (c) the percentage of the time a customer can walk in and get served without waiting at all?
5-33. Andromeda Books is a small independent publisher of fiction and nonfiction books. Each week the publisher receives an average of eight unsolicited manuscripts to review (Poisson distributed). The publisher has 12 freelance reviewers in the area who read and evaluate manuscripts. It takes a reviewer an average of 10 days (exponentially distributed) to read a manuscript and write a brief synopsis. (Reviewers work on their own, seven days a week.) Determine how long the publisher must wait on average to receive a reviewer's manuscript evaluation, how many manuscripts are waiting to be reviewed, and how busy the reviewers are.
5-34. Amanda Fall is starting up a new house painting business, Fall Colors. She has been advertising in the local newspaper for several months, and based on inquiries and informal surveys of the local housing market she anticipates that she will get painting jobs at the rate of four per week (Poisson distributed). Amanda has also determined that it will take a four-person team of painters an average of 0.7 week (exponentially distributed) for a typical painting job.
Determine the number of teams of painters Amanda needs to hire so that customers will have to wait no longer than two weeks to get their houses painted.
If the average price for a painting job is $1700 and Amanda pays a team of painters $500 per week, will she make any money?
5-35. The Associate Dean in the College of Business at Tech is attempting to determine which of two copiers he should lease for the college's administrative suite. A regular copier leases for $8 per hour and it takes an employee an average of six minutes (exponentially distributed) to complete a copying job. A deluxe, high-speed copier leases for $16 per hour, and it requires an average of three minutes to complete a copying job. Employees arrive at the copying machine at the rate of seven per hour (Poisson distributed) and an employee's time is valued at $10 per hour. Determine which copier the college should lease.
5-36. The Corner Cleaners 24-hour laundromat has 16 washing machines. A machine breaks down every 20 days (exponentially distributed). The repair service the laundromat contracts takes an average of one day to repair a machine (exponentially distributed). A washing machine averages $5 per hour in revenue. The laundromat is considering a new repair service that guarantees repairs in 0.50 day, but they charge $10 more per hour than the current repair service. Should the laundromat switch to the new repair service?
5-37. The Ritz Hotel has enough space for six taxicabs to load passengers, line up, and wait for guests at its entrance. Cabs arrive at the hotel every 10 minutes and if a taxi drives by the hotel and the line is full it must drive on. Hotel guests require taxis every five minutes on average and then it takes a cab driver an average of 3.5 minutes to load passengers and luggage and leave the hotel (exponentially distributed).
What is the average time a cab must wait for a fare?
What is the probability that the line will be full when a cab drives by and it must drive on?
5-38. The local Quick Burger fast food restaurant has a drive-through window. Customers in cars arrive at the window at the rate of 10 per hour (Poisson distributed). It requires an average of four minutes (exponentially distributed) to take and fill an order. The restaurant chain has a service goal of an average waiting time of three minutes.
Will the current system meet the restaurant's service goal?
If the restaurant is not meeting its service goal, it can add a second drive-in window that will reduce the service time per customer to 2.5 minutes. Will the additional window enable the restaurant to meet its service goal?
During the two-hour lunch period the arrival rate of drive-in customers increases to 20 per hour. Will the two-window system be able to achieve the restaurnt's service goal during the rush period?
5-39. From 3:00 p.m. to 8:00 p.m. the local Big-W Supermarket has a steady arrival of customers. Customers finish shopping and arrive at the checkout area at the rate of 80 per hour (Poisson distributed). It is assumed that when customers arrive at the cash registers they will divide themselves relatively evenly so that all the checkout lines are even. The average checkout time at a register is seven minutes (exponentially distributed). The store manager's service goal is for customers to be out of the store within 12 minutes (on average) after they complete their shopping and arrive at the cash register. How many cash registers must the store have open in order to achieve the manager's service goal?
5-40. Customers arrive at the lobby of the exclusive and expensive Ritz Hotel at the rate of 40 per hour (Poisson distributed) to check in. The hotel normally has three clerks available at the desk to check guests in. The average time for a clerk to check in a guest is four minutes (exponentially distributed). Clerks at the Regency are paid $12 per hour and the hotel assigns a goodwill cost of $2 per minute for the time a guest must wait in line. Determine if the present check-in system is cost effective; if it is not, recommend what hotel management should do.
5-41. The Delacroix Inn in Alexandria is a small exclusive hotel with 20 rooms. Guests can call housekeeping from 8:00 a.m. to midnight for any of their service needs. Housekeeping keeps one person on duty during this time to respond to guest calls. Each room averages 0.7 call per day to housekeeping (Poisson distributed), and a guest request requires an average response time of 30 minutes (exponentially distributed) from the staff person. Determine the portion of time the staff person is busy and how long a guest must wait for his or her request to be addressed. Does the housekeeping system seem adequate?
5-42. Jim Carter builds custom furniture, primarily cabinets, bookcases, small tables, and chairs. He only works on one piece of furniture for a customer at a time. It takes him an average of five weeks (exponentially distributed) to build a piece of furniture. An average of 14 customers approach Jim to order pieces of furniture each year (Poisson distributed): however, Jim will only take a maximum of eight advance orders. Determine the average time a customer must wait to receive a furniture order once it is placed and how busy Jim is. What is the probability that a customer will be able to place an order with Jim?
5-43. Judith Lewis is a doctoral student at State University, and she also works full time as an academic tutor for 10 scholarship student athletes. She took the job hoping it would leave her free time between tutoring to devote to her own studies. An athlete visits her for tutoring an average of every 16 hours (exponentially distributed), and she spends an average 1.5 hours (exponentially distributed) with the athlete. She is able to tutor only one athlete at a time, and athletes study while they are waiting.
Determine how long a player must wait to see her and the percentage of time Judith is busy. Does the job seem to meet Judith's expectations, and does the system seem adequate to meet the athlete's needs?
If the results in part (a) indicate that the tutoring arrangement is ineffective, suggest an adjustment that could make it better for both the athletes and Judith.
5-44. Agents at the security gate at the Hurtsfield County Regional Airport are able to check passengers and process them through the security gate at the rate of 52 per hour (Poisson distributed). Passengers arrive at the gate throughout the day at the rate of 45 per hour (Poisson distributed).
Determine the average waiting time and waiting line.
The passenger traffic arriving at the airport security gate varies significantly during the day and flight takeoffs tend to cluster making the passenger traffic very heavy at specific times while at other times there is little or no passenger traffic through the security gate. At the times leading up to flight takeoffs passengers arrive at a rate of 125 per hour (Poisson distributed). Develop and solve a waiting line system that can accommodate this increased level of passenger traffic.
5-45. The inland port at Pittsburgh is a transportation hub that transfers shipping containers from trucks coming from eastern seaports to rail cars for shipment to inland destinations. Containers arrive at the inland ports at the rate of nine per hour. It takes 25 minutes (exponentially distributed) for a crane to unload a container from a truck, place it on a flatbed railcar, and secure it. Suggest a waiting line system that will effectively handle this level of container traffic at the inland port.
5-46. The Dominion Landing theme park has a new water ride, the Raging Rapids. The ride holds 36 people in boat-cars and it takes 4.1 minutes to complete the ride circuit. It also takes the ride attendants another 3.5 minutes (with virtually no variation) to load and unload passengers. Passengers arrive at the ride during peak park hours at the rate of 4.4 per minute (Poisson distributed). Determine the length of the waiting line for the ride.
Streamlining the Refinancing Process
First National Bank has been swamped with refinancing requests this year. To handle the increased volume, it divided the process into five distinct stages and created departments for each stage.
The process begins with a customer completing a loan application for a loan agent. The loan agent discusses the refinancing options with the customer and performs quick calculations based on customer-reported data to see if the customer qualifies for loan approval. If the numbers work, the customer signs a few papers to allow a credit check and goes home to wait for notification of the loan's approval.
The customer's file is then passed on to a loan processor, who requests a credit check, verification of loans or mortgages from other financial institutions, an appraisal of the property, and employment verification. If any problems are encountered, the loan processor goes to the loan agent for advice. If items appear on the credit report that are not on the application or if other agencies have requested the credit report, the customer is required to explain the discrepancies in writing. If the explanation is acceptable, the letter is placed in the customer's file and the file is sent to the loan agent (and sometimes the bank's board) for final approval.
The customer receives a letter of loan approval and is asked to call the closing agent to schedule a closing date and to lock in a loan rate if the customer has not already done so.
The closing agent requests the name of the customer's attorney to forward the loan packet. The attorney is responsible for arranging a termite inspection, a survey, a title search, and insurance and for preparing the closing papers. The attorney and the closing agent correspond back and forth to verify fees, payment schedules, and payoff amounts.
The loan-servicing specialist makes sure the previous loan is paid off and the new loan is set up properly. After the closing takes place, the bank's loan-payment specialist takes care of issuing payment books or setting up the automatic drafting of mortgage fees and calculating the exact monthly payments, including escrow amounts. The loan-payment specialist also monitors late payment of mortgages.
It is difficult to evaluate the success or failure of the process, since the volume of refinancing requests is so much greater than it has ever been before. However, customer comments solicited by the loan-servicing specialist have been disturbing to management.
Customer Comments:
I refinanced with the same bank that held my original loan, thinking erroneously that I could save time and money. You took two months longer processing my loan than the other bank would have, and the money I saved on closing costs was more than eaten up by the extra month's higher mortgage payments.
I just got a call from someone at your bank claiming my mortgage payment was overdue. How can it be overdue when you draft it automatically from my checking account?
How come you do everything in writing and through the mail? If you would just call and ask me these questions instead of sending forms for me to fill out, things would go much more quickly.
If I haven't made any additions to my house or property in the past year, you appraised it last year, and you have access to my tax assessment, why bother with another appraisal? You guys just like to pass around the business.
I never know who to call for what. You have so many people working on my file. I know I've repeated the same thing to a dozen different people.
It took so long to get my loan approved that my credit report, appraisal report, and termite inspection ran out. You should pay for the new reports, not me.
I drove down to your office in person today to deliver the attorney's papers, and I hoped to return them with your signature and whatever else you add to the closing packet. The loan specialist said that the closing agent wouldn't get to my file until the morning of the scheduled closing and that if she hit a snag, the closing could be postponed! I'm taking off half a day from work to attend the closing and "rescheduling" is not convenient. I know you have lots of business, but I don'te being treated this way.
I received a letter from one of your loan-payment specialists today, along with a stack of forms to complete specifying how I want to set up my mortgage payments. I signed all these at closing—don't you read your own work? I'm worried that if I fill them out again you'll withdraw the payment twice from my account!
Create a service blueprint of the refinancing process. Why do you think the bank organized its process this way? What problems have ensued?
Examine the process carefully. Look at customer/ provider interactions. Which steps create value for the customer? Which steps can be eliminated? Construct a new blueprint showing how the overall process can be improved.
Herding the Patient
Bayside General Hospital is trying to streamline its operations. A problem-solving group consisting of a nurse, a technician, a doctor, an administrator, and a patient is examining outpatient procedures in an effort to speed up the process and make it more cost-effective. Listed here are the steps that a typical patient follows for diagnostic imaging:
Patient enters main hospital entrance.
Patient takes a number and waits to be called to reg istration desk.
Patient registers.
Patient is taken to diagnostic imaging department.
Patient registers at diagnostic imaging reception.
Patient sits in department waiting area until dressing area clears.
Patient changes in dressing area.
Patient waits in dressing area.
Patient is taken to exam room.
Exam is performed.
Patient is taken to dressing area.
Patient dresses.
Patient leaves.
Create a service blueprint of the procedure and identify opportunities for improvement.
Describe what elements of a servicescape would make this service more palatable to the customer and efficient for the hospital staff.
The College of Business Copy Center
The copy center in the College of Business at State University has become an increasingly contentious item among the college administrators. The department heads have complained to the associate dean about the long lines and waiting times for their secretaries at the copy center. They claim that it is a waste of scarce resources for the secretaries to wait in line talking when they could be doing more productive work in the office. Hanford Burris, the associate dean, says the limited operating budget will not allow the college to purchase a new copier or copiers to relieve the problem. This standoff has been going on for several years.
To make her case for improved copying facilities, Lauren Moore, a teacher in Operations Management, as signed students in her class to gather some information about the copy center as a class project. The students were to record the arrivals at the center and the length of time it took to do a copy job once the secretary actually reached a copy machine. In addition, the students were to describe how the copy center system worked.
When the students completed the project, they turned in a report to Professor Moore. The report described the copy center as containing two machines. When secretaries arrive for a copy job, they join a queue, which looked more like milling around to the students, but they acknowledged that each secretary knew when it was his or her turn, and, in effect, the secretaries formed a single queue for the first available copy machine. Also, since copy jobs are assigned tasks, secretaries always stayed to do the job no matter how long the line was or how long they had to wait. They never left the queue.
From the data the students gathered, Professor Moore was able to determine that secretaries arrived every eight minutes for a copy job and that the arrival rate was Poisson distributed. Furthermore, she was able to deter mine that the average time it takes to complete a job was 12 minutes, and this is exponentially distributed.
Using her department's personnel records and data from the university personnel office, Dr. Moore determined that a secretary's average salary is $8.50 per hour. From her academic calendar she added up the actual days in the year when the college and departmental offices were open and found there were 247. However, as she added up working days, it occurred to her that during the summer months the workload is much less, and the copy center would probably get less traffic. The summer included about 70 days, during which she expected the copy center traffic would be about half of what it is during the normal year, but she speculated that the average time of a copying job would remain about the same.
Professor Moore next called a local office supply firm to check the prices on copiers. A new copier of the type in the copy center now would cost $36,000. It would also require $8000 per year for maintenance and would have a normal useful life of 6 years.
Do you think Dr. Moore will be able to convince the associate dean that a new copy machine will be cost effective?
Northwoods Backpackers
Bob and Carol Packer operate a successful outdoor wear store in Vermont called Northwoods Backpackers. They stock mostly cold-weather outdoor items such as hiking and backpacking clothes, gear, and accessories. They established an excellent reputation throughout New England for quality products and service. Eventually, Bob and Carol noticed that more and more of their sales were from customers who did not live in the immediate vicinity but were calling in orders on the telephone. As a result, the Packers decided to distribute a catalog and establish a phone-order service. The order department consisted of five operators working eight hours per day from 10:00 a.m. to 6:00 p.m., Monday through Friday. For a few years the mail-order service was only moderately successful; the Packers just about broke even on their investment. However, during the holiday season of the third year of the catalog order service, they were overwhelmed with phone orders. Although they made a substantial profit, they were concerned about the large number of lost sales they estimated they incurred. Based on information provided by the telephone company regarding call volume and complaints from customers, the Packers estimated they lost sales of approximately $100,000. Also they felt they had lost a substantial number of old and potentially new customers because of the poor service of the catalog order department.
Prior to the next holiday season, the Packers explored several alternatives for improving the catalog order service. The current system includes the five original operators with computer terminals who work eight-hour days, five days per week. The Packers have hired a consultant to study this system, and she reported that the time for an operator to take a customer order is exponentially distributed with a mean of 3.6 minutes. Calls are expected to arrive at the telephone center during the six-week holiday season according to a Poisson distribution with a mean rate of 175 calls per hour. When all operators are busy, callers are put on hold, listening to music until an operator can answer. Waiting calls are answered on a first-in, first-out basis. Based on her experience with other catalog telephone order operations and data from Northwoods Backpackers, the consultant has determined that if Northwoods Backpackers can reduce customer call waiting time to approximately one-half minute or less, the company will save $135,000 in lost sales during the coming holiday season.
Therefore, the Packers have adopted this level of call service as their goal. However, in addition to simply avoiding lost sales, the Packers believe it is important to reduce waiting time to maintain their reputation for good customer service. Thus, they would like about 70% of their callers to receive immediate service.
The Packers can maintain the same number of work stations/computer terminals they currently have and increase their service to 16 hours per day with two operator shifts running from 8:00 a.m. to midnight. The Packers believe when customers become aware of their extended hours the calls will spread out uniformly, resulting in a new call average arrival rate of 87.5 calls per hour (still Poisson distributed). This schedule change would cost Northwoods Backpackers approximately $11,500 for the six-week holiday season.
Another alternative for reducing customer waiting times is to offer weekend service. However, the Packers believe that if they do offer weekend service, it must coincide with whatever service they offer during the week. In other words, if they have phone order service eight hours per day during the week, they must have the same service during the weekend; the same is true with 16-hours per-day service. They feel that if weekend hours differ from weekday hours it will confuse customers. If eight-hour service is offered seven days per week, the new call arrival rate will be reduced to 125 calls per hour at a cost of $3600. If Northwoods offers 16-hour service, the mean call arrival rate will be reduced to 62.5 calls per hour, at a cost of $7300.
Still another possibility is to add more operator stations. Each station includes a desk, an operator, a phone, and a computer terminal. An additional station that is in operation five days per week, eight hours per day, will cost $2900 for the holiday season. For a 16-hour day the cost per new station is $4700. For seven-day service, the cost of an additional station for eight-hour per-day service is $3800; for 16-hour-per-day service the cost is $6300.
The facility Northwoods Backpackers uses to house its operators can accommodate a maximum of 10 stations. Additional operators in excess of 10 would require the Packers to lease, remodel, and wire a new facility, which is a capital expenditure they do not want to undertake this holiday season. Alternatively, the Packers do not want to reduce their current number of operator stations.
Determine what order service configuration the Packers should use to achieve their goals, and explain your recommendation.
Chase, R., F. R. Jacobs, and N. Aquilano. Operations Management for Competitive Advantage. New York: McGraw-Hill/Irwin, 2005.
Cooper, R. B. Introduction to Queuing Theory, 2nd ed. New York: North Holland, 1981.
Davis, M., and J. Heineke. Operations Management. New York: McGraw-Hill/Irwin, 2004.
Fitzsimmons, J., and M. Fitzsimmons. Service Management. New York: McGraw-Hill/Irwin, 2004.
Gross, D., and C. Harris. Fundamentals of Queuing Theory, 2nd ed. New York: Wiley, 1985.
Hillier, F. S., and O. S. Yu. Queuing Tables and Graphics. New York: North Holland, 1981.
Kleinrock, L. Queuing Systems, vols. 1 and 2. New York: Wiley, 1975.
Lee, A. Applied Queuing Theory. New York: St. Martin's Press, 1966.
Lovelock, C. H. Managing Services: Marketing, Operations, and Human Resources. Englewood Cliffs, NJ. Prentice Hall, 1992.
Morse, P. M. Queues, Inventories, and Maintenance. New York: Wiley, 1958.
Prahalad, C. K., and Venkat Ramaswamy. The future of Competition: Co-creating Unique Value with Customers. Boston: Harvard Business School Press, 2004.
Saaty, T. L. Elements of Queuing Theory with Applications. New York: Dover, 1983.
Sampson, S. E. Understanding Service Businesses. Salt Lake City, UT: Brigham Young University, 1999.
Shostack, G. L. "Designing Services That Deliver". Harvard Business Review (January-February 1984), pp. 133-139.
Solomon, S. L. Simulation of Waiting Line Systems. Upper Saddle River, NJ: Prentice Hall, 1983.
White, J. A., J. W. Schmidt, and G. K. Bennett. Analysis of Queuing Systems. New York: Academic Press, 1975.
Zeithaml, V. Service Quality. Cambridge, MA: Marketing Science Institute 2004.