
In this supplement, you will learn about. . .
At the operational level hundreds of decisions are made in order to achieve local outcomes that contribute to the achievement of a company's overall strategic goal. These local outcomes are usually not measured directly in terms of profit, but instead are measured in terms of quality, cost-effectiveness, efficiency, productivity, and so forth. Achieving good results for local outcomes is an important objective for individual operational units and individual operations managers. However, all these decisions are interrelated and must be coordinated for the purpose of attaining the overall company goals. Decision making is analogous to a great stage play or opera, in which all the actors, the costumes, the props, the music, the orchestra, and the script must be choreographed and staged by the director, the stage managers, the author, and the conductor so that everything comes together for the performance.
For many topics in operations management, there are quantitative models and techniques available that help managers make decisions. Some techniques simply provide information that the operations manager might use to help make a decision; other techniques recommend a decision to the manager. Some techniques are specific to a particular aspect of operations management; others are more generic and can be applied to a variety of decision-making categories. These different models and techniques are the "tools" of the operations manager. Simply having these tools does not make someone an effective operations manager, just as owning a saw and a hammer does not make someone a carpenter. An operations manager must know how to use decision-making tools. How these tools are used in the decision-making process is an important and necessary part of the study of operations management. In this supplement and others throughout this book, we examine several different aspects of operational decision making using these tools.
Quantitative methods are the tools of the operations manager.
• Decision analysis: a set of quantitative decision-making techniques for decision situations in which uncertainty exists.
In this supplement we demonstrate a quantitative technique called decision analysis for decision-making situations in which uncertainty exists. Decision analysis is a generic technique that can be applied to a number of different types of operational decision-making areas.
Many decision-making situations occur under conditions of uncertainty. For example, the demand for a product may not be 100 units next week but may vary between 0 and 200 units, depending on the state of the market, which is uncertain. Decision analysis is a set of quantitative decision-making techniques to aid the decision maker in dealing with a decision situation in which there is uncertainty. However, the usefulness of decision analysis for decision making is also a beneficial topic to study because it reflects a structured, systematic approach to decision making that many decision makers follow intuitively without ever consciously thinking about it. Decision analysis represents not only a collection of decision-making techniques but also an analysis of logic underlying decision making.
A decision-making situation includes several components—the decisions themselves and the events that may occur in the future, known as states of nature. Future states of nature may be high or low demand for a product or good or bad economic conditions. At the time a decision is made, the decision maker is uncertain which state of nature will occur in the future and has no control over these states of nature.
When probabilities can be assigned to the occurrence of states of nature in the future, the situation is referred to as decision making under risk. When probabilities cannot be assigned to the occurrence of future events, the situation is called decision making under uncertainty. We discuss the latter case next.
To facilitate the analysis of decision situations, they are organized into payoff tables. A payoff table is a means of organizing and illustrating the payoffs from the different decisions, given the various states of nature, and has the general form shown in Table S1.1.
Payoff table: a method for organizing and illustrating the payoffs from different decisions given various states of nature.
Payoff: the outcome of the decision.
Each decision, 1 or 2, in Table S1.1 will result in an outcome, or payoff, for each state of nature that will occur in the future. Payoffs are typically expressed in terms of profit, revenues, or cost (although they may be expressed in terms of a variety of quantities). For example, if decision 1 is to expand a production facility and state of nature a is good economic conditions, payoff 1a could be $100,000 in profit.
Once the decision situation has been organized into a payoff table, several criteria are available to reflect how the decision maker arrives at a decision, including maximax, maximin, minimax regret, Hurwicz, and equal likelihood. These criteria reflect different degrees of decision-maker conservatism or liberalism. On occasion they result in the same decision; however, they often yield different results. These decision-making criteria are demonstrated by the following example.
Decision-making criteria
Maximax criterion: a decision criterion that results in the maximum of the maximum payoffs.
Maximax criterion: a decision criterion that results in the maximum of the maximum payoffs.
Minimax regret criterion: a decision criterion that results in the minimum of the maximum regrets for each alternative.
Hurwicz criterion: a decision criterion in which the decision payoffs are weighted by a coefficient of optimism, α.
Coefficient of optimism (α): a measure of a decision maker's optimism, from 0 (completely pessimistic) to 1 (completely optimistic).
Equal likelihood (La Place) criterion: decision criterion in which each state of nature is weighted equally.
Different decision criteria often result in a mix of decisions. The criteria used and the resulting decisions depend on the decision maker. For example, the extremely optimistic decision maker might disregard the preceding results and make the decision to maintain the status quo, because the maximax criterion reflects his or her personal decision-making philosophy.
Throughout this book we will demonstrate how to solve quantitative models using the computer with Microsoft Excel spreadsheets. Exhibit S1.1 shows the Excel spreadsheet solutions for the different decision-making criteria in Example S1.1. The "call out" boxes displayed on and around the spreadsheet define the cell formulas used to compute the criteria values. For example, the spreadsheet formula used to compute the maximum payoff value for the decision to "Expand," =MAX(C6:D6), is embedded in cell E6 and is also shown on the toolbar at the top of the spreadsheet. The formula for the Maximax decision, =MAX(E6:E8), is embedded in cell C10.
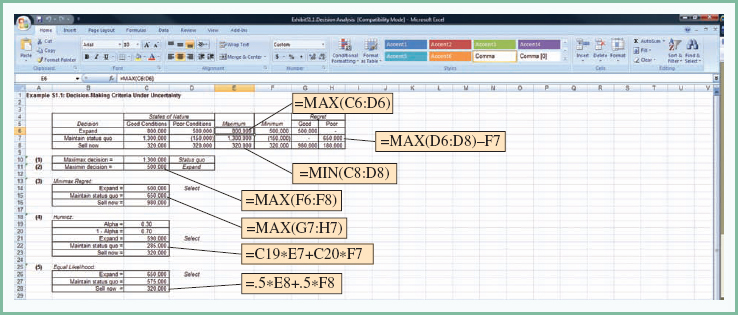
The Excel file for Exhibit S1.1 and the Excel files for all of the exhibits in the subsequent chapters in this text are contained on the text Web site. Students and instructors can download this file to see how the spreadsheet was constructed as well as the individual cell formulas. This spreadsheet can also be used as a guideline or template to solve the homework problems at the end of the chapter using Excel.
OM Tools is an Excel-based software package published by Wiley that was specifically designed for use with this text. It includes solution modules for most of the quantitative techniques in this text. After downloading OM Tools, modules can be selected by clicking on the "OM Tools" button on the tool bar at the top of the page, which provides a drop-down list of modules, and then clicking on the specific module you want to use. In this case we want to use the "Decision Analysis" module with "Decision Making Under Uncertainty." A window for providing the initial problem data, including the problem name and the number of decision alternatives and states of nature, will then be displayed. Exhibit S1.2 shows the OM Tools Excel spreadsheet for Example S1.1 with all of the problem data input into the cells. Notice that the difference between this spreadsheet and the one in Exhibit S1.1 is that the spreadsheet has already been set up with all of the Excel formulas for the various decision criteria in the cells. Thus, all you have to do to solve the problem is type in the problem data.

Risk involves assigning probabilities to states of nature.
For the decision-making criteria we just used we assumed no available information regarding the probability of the states of nature. However, it is often possible for the decision maker to know enough about the future states of nature to assign probabilities that each will occur, which is decision making under conditions of risk. The most widely used decision-making criterion under risk is expected value, computed by multiplying each outcome by the probability of its occurrence and then summing these products according to the following formula:
Expected value: a weighted average of decision outcomes in which each future state of nature is assigned a probability of occurrence.
where

Occasionally, additional information is available, or can be purchased, regarding future events, enabling the decision maker to make a better decision. For example, a company could hire an economic forecaster to determine more accurately the economic conditions that will occur in the future. However, it would be foolish to pay more for this information than it stands to gain in extra profit from having the information. The information has some maximum value that is the limit of what the decision maker would be willing to spend. This value of information can be computed as an expected value—hence its name, the expected value of perfect information (EVPI)
To compute the expected value of perfect information, first look at the decisions under each state of nature. If information that assured us which state of nature was going to occur (i.e., perfect information) could be obtained, the best decision for that state of nature could be selected. For example, in the textile company example, if the company executives knew for sure that good competitive conditions would prevail, they would maintain the status quo. If they knew for sure that poor competitive conditions will occur, then they would expand.
•Expected value of perfect information (EVPI): the maximum value of perfect information to the decision maker.
The probabilities of each state of nature (i.e., 0.70 and 0.30) indicate that good competitive conditions will prevail 70% of the time and poor competitive conditions will prevail 30% of the time (if this decision situation is repeated many times). In other words, even though perfect information enables the investor to make the right decision, each state of nature will occur only a certain portion of the time. Thus, each of the decision outcomes obtained using perfect information must be weighted by its respective probability:
$1,300,000(0.70) + (500,000)(0.30) = $1,060,000
The amount of $1,060,000 is the expected value of the decision given perfect information, not the expected value of perfect information. The expected value of perfect information is the maximum amount that would be paid to gain information that would result in a decision better than the one made without perfect information. Recall from Example S1.2 that the expected-value decision without perfect information was to maintain the status quo and the expected value was $865,000.
The expected value of perfect information is computed by subtracting the expected value without perfect information from the expected value given perfect information:
EVPI = expected value given perfect information – expected value without perfect information
For our example, the EVPI is computed as
EVPI = $1,060,000 – 865,000 = $195,000
The expected value of perfect information, $195,000, is the maximum amount that the investor would pay to purchase perfect information from some other source, such as an economic forecaster. Of course, perfect information is rare and is usually unobtainable. Typically, the decision maker would be willing to pay some smaller amount, depending on how accurate (i.e., close to perfection) the information is believed to be.
A payoff table is limited to a single decision situation. If a decision requires a series of decisions, a payoff table cannot be created, and a sequential decision tree must be used. We demonstrate the use of a decision tree in the following example.
• Sequential decision tree: a graphical method for analyzing decision situations that require a sequence of decisions over time.
A Sequential Decision Tree
The Southern Textile Company is considering two alternatives: to expand its existing production operation to manufacture a new line of lightweight material; or to purchase land on which to construct a new facility in the future. Each of these decisions has outcomes based on product market growth in the future that result in another set of decisions (during a 10-year planning horizon), as shown in the following figure of a sequential decision tree. In this figure the square nodes represent decisions, and the circle nodes reflect different states of nature and their probabilities.
The first decision facing the company is whether to expand or buy land. If the company expands, two states of nature are possible. Either the market will grow (with a probability of 0.60) or it will not grow (with a probability of 0.40). Either state of nature will result in a payoff. On the other hand, if the company chooses to purchase land, three years in the future another decision will have to be made regarding the development of the land.
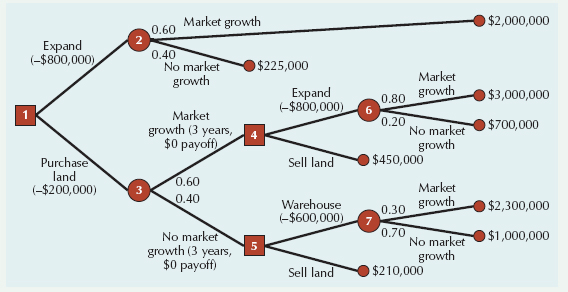
At decision node 1, the decision choices are to expand or to purchase land. Notice that the costs of the ventures ($800,000 and $200,000, respectively) are shown in parentheses. If the plant is expanded, two states of nature are possible at probability node 2: The market will grow, with a probability of 0.60, or it will not grow or will decline, with a probability of 0.40. If the market grows, the company will achieve a payoff of $2,000,000 over a 10-year period. However, if no growth occurs, a payoff of only $225,000 will result.
If the decision is to purchase land, two states of nature are possible at probability node 3. These two states of nature and their probabilities are identical to those at node 2; however, the payoffs are different. If market growth occurs for a three-year period, no payoff will occur, but the company will make another decision at node 4 regarding development of the land. At that point, either the plant will be expanded at a cost of $800,000 or the land will be sold, with a payoff of $450,000. The decision situation at node 4 can occur only if market growth occurs first. If no market growth occurs at node 3, there is no payoff, and another decision situation becomes necessary at node 5: A warehouse can be constructed at a cost of $600,000 or the land can be sold for $210,000. (Notice that the sale of the land results in less profit if there is no market growth than if there is growth.)
If the decision at decision node 4 is to expand, two states of nature are possible: The market may grow, with a probability of 0.80, or it may not grow, with a probability of 0.20. The probability of market growth is higher (and the probability of no growth is lower) than before because there has already been growth for the first three years, as shown by the branch from node 3 to node 4. The payoffs for these two states of nature at the end of the 10-year period are $3,000,000 and $700,000, respectively.
If the company decides to build a warehouse at node 5, two states of nature can occur: Market growth can occur, with a probability of 0.30 and an eventual payoff of $2,300,000, or no growth can occur, with a probability of 0.70 and a payoff of $1,000,000. The probability of market growth is low (i.e., 0.30) because there has already been no market growth, as shown by the branch from node 3 to node 5.
Solution
We start the decision analysis process at the end of the decision tree and work backward toward a decision at node 1.
First, we must compute the expected values at nodes 6 and 7:
EV(node 6) = 0.80($3,000,000) + 0.20($700,000) = $2,540,000
EV(node 7) = 0.30($2,300,000) + 0.70($1,000,000) = $1,390,000
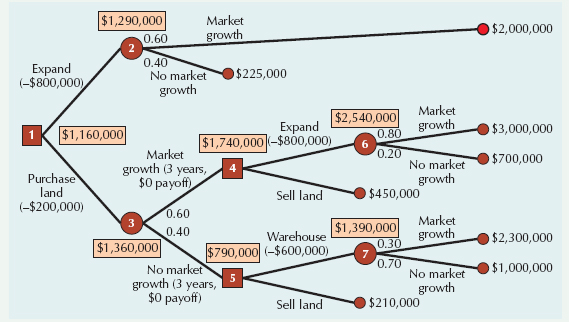
These expected values (as well as all other nodal values) are shown in boxes in the figure.
At decision nodes 4 and 5, a decision must be made. As with a normal payoff table, the decision is made that results in the greatest expected value. At node 4 the choice is between two values: $1,740,000, the value derived by subtracting the cost of expanding ($800,000) from the expected payoff of $2,540,000, and $450,000, the expected value of selling the land computed with a probability of 1.0. The decision is to expand, and the value at node 4 is $1,740,000.
The same process is repeated at node 5. The decisions at node 5 result in payoffs of $790,000 (i.e., $1,390,000 – 600,000 = $790,000) and $210,000. Since the value $790,000 is higher, the decision is to build a warehouse.
Next, the expected values at nodes 2 and 3 are computed:
EV(node 2) = 0.60($2,000,000) + 0.40($225,000) = $1,290,000
EV(node 3) = 0.60($1,740,000) + 0.40($790,000) = $1,360,000
(Note that the expected value for node 3 is computed from the decision values previously determined at nodes 4 and 5.)
Now the final decision at node 1 must be made. As before, we select the decision with the greatest expected value after the cost of each decision is subtracted.
Expand: $1,290,000 – 800,000 = $490,000
Land: $1,360,000 – 200,000 = $1,160,000
Since the highest net expected value is $1,160,000, the decision is to purchase land, and the payoff of the decision is $1,160,000.
Decision trees allow the decision maker to see the logic of decision making by providing a picture of the decision process. Decision trees can be used for problems more complex than this example without too much difficulty.
In this supplement we have provided a general overview of decision analysis. To a limited extent, we have also shown that the logic of such operational decisions throughout the organization are interrelated to achieve strategic goals.
Expected Value
Expected Value of Perfect Information
EVPI = expected value given perfect information – expected value without perfect information
coefficient of optimism (α) a measure of a decision maker's optimism, from 0 (completely pessimistic) to 1 (completely optimistic), used in the Hurwicz decision criterion.
decision analysis a set of quantitative decision-making techniques to aid the decision maker in dealing with decision situations in which uncertainty exists.
equal likelihood (La Place) criterion a decision criterion in which each state of nature is weighted equally.
expected value a weighted average of decision outcomes in which each future state of nature is assigned a probability of occurence.
expected value of perfect information (EVP) the maximum value that a decision maker would be willing to pay for perfect information about future states of nature.
Hurwicz criterion a decision criterion in which the decision payoffs are weighted by a coefficient of optimism, α.
maximax criterion a decision criterion that results in the maximum of the maximum payoffs.
maximin criterion a decision criterion that results in the maximum of the minimum payoffs.
minimax regret criterion a decision criterion that results in the minimum of the maximum regrets for each alternative.
payoff the outcome of a decision.
payoff table a means of organizing and illustrating the payoffs from different decisions given various states of nature.
sequential decision tree a graphical method for analyzing decision situtations that require a sequence of decisions over time.
Consider the following payoff table for three product decisions (A, B, and C) and three future market conditions (payoffs = $ millions).
DECISION | MARKET CONDITIONS | ||
|---|---|---|---|
1 | 2 | 3 | |
A | $1.0 | $2.0 | $0.5 |
B | 0.8 | 1.2 | 0.9 |
C | 0.7 | 0.9 | 1.7 |
SOLUTION
Step 1. Maximax criterion
MAXIMUM PAYOFFS | ||
|---|---|---|
A | $2.0 | ← maximun |
B | 1.2 | |
C | 1.7 | |
Decision: Product A
Determine the best decision using the following decision criteria.
Maximax
Maximin
Step 2. Maximin criteria
MINIMUM PAYOFFS | ||
|---|---|---|
A | 0.5 | |
B | 0.8 | ← maximum |
C | 0.7 | |
Decision: Product B
S1-1. Telecomp is a U.S.-based manufacturer of cellular telephones. It is planning to build a new manufacturing and distribution facility in either South Korea, China, Taiwan, Poland, or Mexico. The cost of the facility will differ between countries and will even vary within countries depending on the economic and political climate, including monetary exchange rates. The company has estimated the facility cost (in $ millions) in each country under three different future economic/political climates as follows.
Country | Economic/Political Climate | ||
|---|---|---|---|
Decline | Same | Improve | |
South Korea | 21.7 | 19.1 | 15.2 |
China | 19.0 | 18.5 | 17.6 |
Taiwan | 19.2 | 17.1 | 14.9 |
Poland | 22.5 | 16.8 | 13.8 |
Mexico | 25.0 | 21.2 | 12.5 |
Determine the best decision using the following decision criteria. (Note that since the payoff is cost, the maximax criteria becomes minimin and maximin becomes minimax.)
Minimin
Minimax
Hurwicz (α = 0.40)
Equal likelihood
S1-2. A global economist hired by Telecomp, the U.S.-based computer manufacturer in Problem S1-1, estimates that the probability that the economic and political climate overseas and in Mexico will decline during the next five years is 0.30, the probability that it will remain approximately the same is 0.40, and the probability that it will improve is 0.30. Determine the best country to construct the new facility in and the expected value of perfect information.
S1-3. Landloc, a real estate development firm, is considering several alternative development projects. These include building and leasing an office building, purchasing a parcel of land and building a parking lot, buying and leasing a warehouse, building a shopping mall, and building and selling condominiums. The financial success of these projects depends on interest rate movement in the next five years. The various development projects and their five-year financial return ($ millions) given that interest rates will decline, remain stable, or increase are shown in the following payoff table.
Determine the best investment using the following decision criteria.
Maximax
Maximin
Equal likelihood
Hurwicz (α = 0.3)
Project | Interest Rates | ||
|---|---|---|---|
Decline | Stable | Increase | |
Office building | 0.5 | 1.7 | 4.5 |
Parking lot | 1.5 | 1.9 | 2.4 |
Warehouse | 1.7 | 1.4 | 1.0 |
Shopping mall | 0.7 | 2.4 | 3.6 |
Condominiums | 3.2 | 1.5 | 0.6 |
S1-4. In Problem S1-3 the Landloc real estate development firm has hired an economist to assign a probability to each direction interest rates may take over the next five years. The economist has determined that there is a 0.50 probability that interest rates will decline, a 0.40 probability that rates will remain stable, and a 0.10 probability that rates will increase.
Using expected value, determine the best project.
Determine the expected value of perfect information.
S1-5. Nicole Nelson has come into an inheritance from her grandparents. She is attempting to decide among several investment alternatives. The return after one year is dependent primarily on the interest rate during the next year. The rate is currently 7%, and she anticipates it will stay the same or go up or down by at most 2 points. The various investment alternatives plus their returns ($10,000s) given the interest rate changes are shown in the following table.
Investments | Interest Rates | ||||
|---|---|---|---|---|---|
5% | 6% | 7% | 8% | 9% | |
Money market fund | 1.7 | 2.8 | 3.0 | 3.6 | 4.5 |
Stock growth fund | −5 | −3 | 3.5 | 5 | 7.5 |
Bond fund | 5 | 4 | 3.5 | 3 | 2 |
Government fund | 4 | 3.6 | 3.2 | 2.8 | 2.1 |
Risk fund | −12 | −7 | 4.2 | 9.3 | 16.7 |
Savings bonds | 3 | 3 | 3.2 | 3.4 | 3.5 |
Determine the best investment using the following decision criteria.
Maximax
Maximin
Equal likelihood
Assume that Nicole, with the help of a financial newsletter and some library research, has been able to assign probabilities to each of the possible interest rates during the next year as follows:
Interest Rate
5%
6%
7%
8%
9%
Probability
0.1
0.2
0.4
0.2
0.1
Using expected value, determine her best investment decision.
S1-6. The Tech football coaching staff has six basic plays it runs every game. Tech has an upcoming game against State on Saturday, and the coaches know State employs five different defenses. The coaches have estimated the number of yards Tech will gain with each play against each defense, as shown in the following payoff table.
Play | Defense | ||||
|---|---|---|---|---|---|
54 | 63 | Wide Tackle | Nickel | Blitz | |
Off Tackle | 2 | −2 | 6 | 8 | −2 |
Option | 3 | 7 | −1 | 10 | 16 |
Toss Sweep | 5 | 14 | −5 | 6 | 12 |
Draw | −2 | −3 | 2 | 8 | 7 |
Pass | 10 | 20 | 12 | −7 | −6 |
Screen | −5 | −3 | 8 | 7 | 16 |
If the coaches employ an offensive game plan, they will use the maximax criterion. What will their best play be?
If the coaches employ a defensive plan, they will use the maximin criterion. What will their best play be?
What will their best play be if State is equally likely to use any of its defenses?
The Tech coaches have reviewed game films and have determined the following probabilities that State will use each of its defenses.
Defense | 54 | 63 | Wide Tackle | Nickel | Blitz |
Probability | 0.40 | 0.10 | 0.20 | 0.20 | 0.10 |
Using expected value, rank Tech's plays from best to worst. During the actual game, Tech has a third down and 10 yards to go and the coaches are 60% certain State will blitz, with a 10% chance of any of the other four defenses. What play should Tech run, and is it likely Tech will make the first down?
S1-7. The Dynamax Company is going to introduce one of three new products: a widget, a hummer, or a nimnot. The market conditions (favorable, stable, or unfavorable) will determine the profit or loss the company realizes, as shown in the following payoff table.
Product | Market Conditions | ||
|---|---|---|---|
Favorable 0.2 | Stable 0.5 | Unfavorable 0.3 | |
Widget | $160,000 | $90,000 | −$50,000 |
Hummer | 70,000 | 40,000 | 20,000 |
Nimnot | 45,000 | 35,000 | 30,000 |
Compute the expected value for each decision and select the best one.
Determine how much the firm would be willing to pay to a market research firm to gain better information about future market conditions.
Assume that probabilities cannot be assigned to future market conditions, and determine the best decision using the maximax, maximin, minimax regret, and equal likelihood criteria.
S1-8. John Wiley Publishing Company publishes an operations management textbook that is scheduled for a revision. The book has been moderately successful, but each year more new books enter the market, some existing books are dropped by publishers, and various innovative pedagogical approaches are introduced by authors and publishers, such that the competitive market is always highly uncertain. In addition, the role the Internet will play in future textbook publishing is an unknown. As a result, Wiley is trying to decide whether to publish the next edition of the OM book as a smaller paperback, publish a new edition very similar in size and content to the current edition, significantly revise the book with an emphasis on services and processes, or make a major revision with significant physical changes including adding color and more graphics. The following payoff table summarizes the possible revision decisions with profits (or losses) for the three-year lifecycle of the new edition, and the future states of nature relative to the competitive market.
Publication Decision | Competitive Market | ||
|---|---|---|---|
Unfavorable | Same | Favorable | |
Paperback | $68,000 | $170,000 | $395,000 |
Similar revision | 24,000 | 375,000 | 672,000 |
Major content revision | 31,000 | 515,000 | 725,000 |
Major physical revision | −105,000 | 280,000 | 972,000 |
Determine the best decision for the publisher using the following criteria.
Maximax
Minimax
Equal likelihood
Hurwicz (α = .35)
S1-9. In Problem S1-8, if Wiley Publishing is able to assign probabilities of occurrence of 0.23 to unfavorable market conditions, 0.46 for the same market conditions, and 0.31 for favorable market conditions, what is the best decision using expected value? Based on the results in Problem S1-8 and the expected value result in this problem, does there appear to be an overall "best" decision? Compute the expected value of perfect information, and explain its meaning.
S1-10. Amtrex International is a major U.S.-based electronics firm that manufactures a number of electronic components for domestic and global consumer electronics companies. It imports most of its materials and the components used in its products to the United States from overseas suppliers. Amtrex is in the process of trying to improve its global supply chain operations, and as part of this process the company wants to determine a single supplier located at one of the major ports around the world to contract with for the majority of its business. The company is considering six suppliers, each located at one of the following ports: Hong Kong, Singapore, Shanghai, Busan, and Kaohsiung. The company has estimated the possible profit (or loss) it might achieve with each of the potential suppliers depending on a variety or possible future company and port conditions, including IT capability, port growth and expansion, ship and container availability, security, regional market and political environment, and transport to the port from the supplier's suppliers. Depending on these various factors, further supplier and port conditions could decline, grow and expand, or remain the same. The following payoff table summarizes the increased outcomes (in $ millions) for the potential suppliers and the possible future sates of nature for a specific time frame.
Decision | States of Nature | ||
|---|---|---|---|
Declining Conditions | Same Conditions | Growth Conditions | |
Hong Kong | −$31 | $28 | $67 |
Singapore | −24 | 33 | 71 |
Shaghai | −28 | 35 | 55 |
Busan | −17 | 25 | 49 |
Kaohsiumg | −15 | 41 | 59 |
Determine the best decision using each of the following criteria.
Maximax
Maximin
Equal likelihood
Hurwicz (α = 0.65)
Minimax regret
S1-11. In Problem S1-10, suppose Amtrex is able to assign probabilities to each of the states of nature for each of the suppliers/ports as follows:
Decision | States of Nature | ||
|---|---|---|---|
Declining Conditions | Same Conditions | Growth Conditions | |
Hong Kong | .27 | .45 | .28 |
Singapore | .18 | .51 | .31 |
Shanghai | .22 | .61 | .17 |
Busan | .15 | .45 | .40 |
Kaohsiung | .25 | .38 | .37 |
Using expected value, determine the port/supplier Amtrex should use.
Based on the results from Problem S1-10, and the result from part a, is there a best overall decision?
S1-12. The Willow Café is located in an open-air mall. Its lease expires this year and the restaurant owner has the option of signing a 1-, 2-, 3-, 4-, or 5-year lease. However, the owner is concerned about recent energy price increases (including the price of gasoline), which affect virtually every aspect of the restaurant operation including the price of food items and materials, delivery costs, and its own utilities. The restaurant was very profitable when energy prices were lower, and the owner believes if prices remain at approximately their current level profits will still be satisfactory; however, if prices continue to rise he believes that he might be forced to close. In these latter circumstances a longer term lease could be a financial disaster, but with a shorter term lease the mall landlord could always rent the restaurant's space out from under it when the lease expires. As such, the restaurant owner's estimates of future profits must also reflect the possibility that the lease will not be renewable. The following payoff table summarizes the owner's profit (and loss) estimates for each future state of nature of energy prices (over a five-year period).
Lease Decision | Energy Prices | ||
|---|---|---|---|
Decrease .17 | Same .34 | Increase .49 | |
1-year | $156,000 | $93,000 | $16,000 |
2-year | 427,000 | 150,000 | −42,000 |
3-year | 642,000 | 319,000 | −171,000 |
4-year | 933,000 | 473,000 | −337,000 |
5-year | 1,228,000 | 516,000 | −551,000 |
Determine the best decision using expected value.
S1-13. Compute the expected value of perfect information for the Willow Café in Problem S1-12. Explain what this value means and how such information might be obtained.
S1-14. The Weight Club (see Case Problem 1.4) is considering adding a new service facility among several possible alternatives including a child care center, a swimming pool, new locker rooms and showers, a health-oriented food court, and a spa. The success of each alternative depends on their demand (i.e., new members who would join because of the new facility), which is uncertain. The following payoff table summarizes the returns (based on costs and increased enrollments) for each alternative service facility given three future levels of demand.
Service Facility | Demand | ||
|---|---|---|---|
Poor | Moderate | High | |
Child care center | $17,000 | $27,000 | $41,000 |
Swimming pool | −75,000 | 26,000 | 71,000 |
New lockers and showers | 12,000 | 37,000 | 57,000 |
Food court | −31,000 | 19,000 | 87,000 |
Spa | 6,000 | 25,000 | 32,000 |
Determine the best decision for the club using the following criteria.
Maximax
Minimax
Hurwicz (α = .45)
Equal likelihood
S1-15. In Problem S1-14, assume the Weight Club is able to estimate probabilities of occurrence for each possible future demand state, as follows:
Service Facility | Demand | ||
|---|---|---|---|
Poor | Moderate | High | |
Child care center | .12 | .54 | .34 |
Swimming pool | .24 | .63 | .13 |
New lockers and showers | .09 | .44 | .47 |
Food court | .18 | .74 | .08 |
Spa | .31 | .48 | .21 |
Determine the best decision using expected value.
S1-16. The Midtown Market purchases apples from a local grower. The apples are purchased on Monday at $2.00 per pound, and the market sells them for $3.00 per pound. Any apples left over at the end of the week are sold to a local zoo for $0.50 per pound. The possible demands for apples and the probability for each are as follows.
Demand [lb] | Probability |
|---|---|
20 | 0.10 |
21 | 0.20 |
22 | 0.30 |
23 | 0.30 |
24 | 0.10 |
1.00 |
The market must decide how many apples to order in a week. Construct a payoff table for this decision situation and determine the amount of apples that should be ordered using expected value.
Assuming that probabilities cannot be assigned to the demand values, what would the best decision be using the maximax and maximin criteria?
S1-17. The manager of the greeting card section of Harvey's department store is considering her order for a particular line of holiday cards. The cost of each box of cards is $3; each box will be sold for $5 during the holiday season. After the holiday season, the cards will be sold for $2 a box. The card section manager believes that all leftover cards can be sold at that price. The estimated demand during the holiday season for the cards, with associated probabilities, is as follows:
Demand (boxes) | Probability |
|---|---|
25 | 0.10 |
26 | 0.15 |
27 | 0.30 |
28 | 0.20 |
29 | 0.15 |
30 | 0.10 |
Develop the payoff table for this decision situation and compute the expected value for each alternative and identify the best decision.
Compute the expected value of perfect information.
S1-18. Assume that the probabilities of demand in Problem S1-17 are no longer valid; the decision situation is now one without probabilities. Determine the best number of cards to stock using the following decision criteria.
Maximin
Maximax
Hurwicz (α = 0.4)
Minimax regret
S1-19. A machine shop owner is attempting to decide whether to purchase a new drill press, a lathe, or a grinder. The return from each will be determined by whether the company succeeds in getting a government military contract. The profit or loss from each purchase and the probabilities associated with each contract outcome are shown in the following payoff table. Compute the expected value for each purchase and select the best one.
Purchase | Contract 0.40 | No Contract 0.60 |
|---|---|---|
Drill press | $40,000 | $–8,000 |
Lathe | 20,000 | 4,000 |
Grinder | 12,000 | 10,000 |
S1-20. The Extron Oil Company is considering making a bid for a shale oil development contract to be awarded by the federal government. The company has decided to bid $110 million. The company estimates that it has a 60% chance of winning the contract with this bid. If the firm wins the contract, it can choose one of three methods for getting the oil from the shale: It can develop a new method for oil extraction, use an existing (inefficient) process, or subcontract the processing out to a number of smaller companies once the shale has been excavated. The results from these alternatives are given as follows.
Decelop New Process | ||
|---|---|---|
Outcomes | Probability | Profit (millions) |
Great success | 0.30 | $600 |
Moderate success | 0.60 | 300 |
Failure | 0.10 | −100 |
Use Present Process | ||
|---|---|---|
Outcomes | Probability | Profit (millions) |
Great success | 0.50 | $300 |
Moderate success | 0.30 | 200 |
Failure | 0.20 | −40 |
Subcontract | ||
|---|---|---|
Outcomes | Probability | Profit (millions) |
Moderate success | 1.00 | $250 |
The cost of preparing the contract proposal is $2,000,000. If the company does not make a bid, it will invest in an alternative venture with a guaranteed profit of $30 million. Construct a sequential decision tree for this decision situation and determine whether the company should make a bid.
S1-21. The New England Bombers professional basketball team just missed making the playoffs last season and believes it only needs to sign one very good free agent to make the playoffs next season. The team is considering four players: Jamelle Morris, Rayneal O'Neal, Marvin Jackson, and Michael Gordon. Each player differs according to position, ability, and attractiveness to fans. The payoffs (in $ millions) to the team for each player based on their contract, profits from attendance, and team product sales for several different seasonal outcomes are provided in the following table.
Player | Season Outcome | ||
|---|---|---|---|
Loser | Competitive | Playoffs | |
Morris | $–3.2 | $1.3 | $4.4 |
O'Neal | −5.1 | 1.8 | 6.3 |
Jackson | −2.7 | 0.7 | 5.8 |
Gordon | −6.3 | −1.6 | 9.6 |
Determine the best decision using the following decision criteria.
Maximax
Maximin
Hurwicz (α = .25)
Equal likelihood
The Bombers' management has determined the following probabilities of the occurrence of each future seasonal outcome for each player.
Player | Probability | ||
|---|---|---|---|
Loser | Competitive | Playoffs | |
Morris | 0.15 | 0.55 | 0.30 |
O'Neal | 0.18 | 0.26 | 0.56 |
Jackson | 0.21 | 0.32 | 0.47 |
Gordon | 0.30 | 0.25 | 0.45 |
Compute the expected value for each player and indicate which player the team should try to sign.
S1-22. The director of career advising at Grand Valley Community College wants to use decision analysis to provide information to help students decide which two-year degree program they should pursue. The director has set up the following payoff table for six of the most popular and successful degree programs at GVCC that shows the estimated five-year gross income ($) from each degree for four future economic conditions:
Degree Program | Economic Conditions | |||
|---|---|---|---|---|
Recession | Average | Good | Robust | |
Graphic Design | 115,000 | 155,000 | 190,000 | 220,000 |
Nursing | 140,000 | 175,000 | 210,000 | 225,000 |
Real Estate | 95,000 | 135,000 | 230,000 | 350,000 |
Medical Technology | 120,000 | 180,000 | 210,000 | 270,000 |
Culinary Technology | 85,000 | 125,000 | 180,000 | 290,000 |
Computer Information Technology | 125,000 | 160,000 | 200,000 | 260,000 |
Determine the best degree program in terms of projected income, using the following decision criteria:
Maximax
Maximin
Equal likelihood
Hurwicz (α = .25)
S1-23. In Problem S1-22 the director of career advising at Grand Valley Community College has paid a local economic forecasting firm to indicate a probability for each future economic condition over the next five years. The firm estimates that there is a .15 probability of a recession, a .50 probability that the economy will be average, a .25 probability that the economy will be good, and a .10 probability that it will be robust. Using expected value determine the best degree program in terms of projected income. If you were the director of career advising which degree program would you recommend?
S1-24. The Sharks major league baseball team is going to enter the free agent market over the winter to sign a new starting pitcher. They have five prospects that will enter the free agent market that they are considering. All five pitchers are in their mid-twenties, have been in the major leagues for approximately five years, and have been relatively successful. The team's general manager has compiled a lot of information about the pitchers from scouting reports and their playing histories since high school. He has developed a chart projecting how many wins each pitcher will likely have during the next 10 years given three possible future states of nature—that the pitchers will be relatively injury free, they will have a normal career with injuries, or that they will have excessive injuries, as shown in the following payoff table:
Pitcher | Physical Condition | ||
|---|---|---|---|
No Injuries | Normal | Excessive Injuries | |
Miguel Garcia | 142 | 117 | 65 |
Juan Ramon | 164 | 140 | 58 |
Fred Terry | 129 | 108 | 76 |
Alan Rodriguez | 112 | 92 | 87 |
Jared Washburn | 124 | 94 | 63 |
Determine the best pitcher to sign, using the following decision criteria:
Maximax
Maximin
Equal likelihood
Hurwicz (α = .35)
S1-25. In Problem S1-24 the Sharks general manager has asked a super scout to assign a probability to each of the three states of nature that may occur for the pitchers during the next 10 years. The scout estimates that there is a .08 probability that these pitchers at this stage of their careers will have no injuries, a .56 probability that they will have a career with the normal amount of injuries, and a .36 probability that they will have excessive injuries.
(a) Using expected value, determine the best pitcher to sign.
(b) Given the following 10-year contract price for each pitcher (in $ millions), which would you recommend signing?
Miguel Garcia
$96.2
Juan Ramon
$118.4
Fred Terry
$81.6
Alan Rodriguez
$102.8
Jared Washburn
$75.7
(c) Suppose that the general manager asked the super scout to determine the probabilities of each state of nature for each individual pitcher, as follows:
Pitcher
Physical Condition
No Injuries
Normal
Excessive Injuries
Miguel Garcia
0.27
0.46
0.27
Juan Ramon
0.14
0.45
0.41
Fred Terry
0.37
0.35
0.28
Alan Rodriguez
0.43
0.45
0.12
Jared Washburn
0.21
0.57
0.22
Determine the expected number of wins for each pitcher, and combined with the contract price in part (b), indicate which pitcher you would recommend signing.
S1-26. Federated Electronics, Ltd., manufactures display screens and monitors for computers and televisions, which it sells to companies around the world. It wants to construct a new warehouse and distribution center in Asia to serve emerging markets there. It has identified potential sites in the port cities of Shanghai, Singapore, Pusan, Kaohsiung, and Hong Kong and has estimated the possible revenues for each (minus construction costs which are higher in some cities like Hong Kong). At each site the projected revenues are primarily based on these factors, (1) the economic conditions at the port including the projected traffic, infrastructure, labor rates and availability; and expansion and modernization; and (2) the future government situation which includes the political stability, fees, tariffs, duties, and trade regulations. Following is a payoff table that shows the projected revenues (in $ billions) for six years given the four possible combinations for positive and negative port and government conditions:
Port | Port Negative/Government Negative | Port Negative/Government Positive | Port Positive/Government Negative | Port Positive/Government Positive |
|---|---|---|---|---|
Shanghai | −$0.271 | $0.437 | $0.523 | $1.08 |
Singapore | −0.164 | 0.329 | 0.441 | 0.873 |
Pusan | 0.119 | 0.526 | 0.337 | 0.732 |
Kaoshiung | −0.235 | 0.522 | 0.226 | 1.116 |
Hong Kong | −0.317 | 0.256 | 0.285 | 1.653 |
Determine the port city Federated should select for its new distribution center using the following decision criteria:
Maximax
Maximin
Equal likelihood
Hurwicz (α = .55)
S1-27. In Problem S1-26 Federated Electronics, Ltd. has hired a Washington, D.C.-based global trade research firm to assess the probabilities of each combination of port and government conditions for the five ports. The research firm probability estimates for the five ports are as follows:
Port | Port Negative/Government Negative | Port Negative/Government Positive | Port Positive/Government Negative | Port Positive/Government Positive |
|---|---|---|---|---|
Shanghai | 0.09 | 0.27 | 0.32 | 0.32 |
Singapore | 0.05 | 0.22 | 0.22 | 0.51 |
Pusan | 0.08 | 0.36 | 0.27 | 0.29 |
Kaoshiung | 0.11 | 0.12 | 0.46 | 0.31 |
Hong Kong | 0.10 | 0.23 | 0.30 | 0.37 |
(a) Using expected value, determine the best port to construct the distribution center.
(b) Using any decision criteria, determine the port you think would be the best location for the distribution center, and justify your answer.
S1-28. Alex Mason has a wide-curving, uphill driveway leading to his garage. When there is a heavy snow, Alex hires a local carpenter, who shovels snow on the side in the winter, to shovel his driveway. The snow shoveler charges $30 to shovel the driveway. Following is a probability distribution of the number of heavy snows each winter.
Heavy Snows | Probability |
|---|---|
1 | 1.12 |
2 | 0.19 |
3 | 0.24 |
4 | 0.22 |
5 | 0.13 |
6 | 0.08 |
7 | 0.02/1.00 |
Alex is considering the purchase of a new self-propelled snowblower for $575 that would allow him, his wife, or his children to clear the driveway after a snow. Discuss what you think Alex's decision should be and why.
S1-29. The management of State Union Bank was concerned about the potential loss that might occur in the event of a physical catastrophe such as a power failure or a fire. The bank estimated that the loss from one of these incidents could be as much as $100 million, including losses due to interrupted service and customer relations. One project the bank is considering is the installation of an emergency power generator at its operations headquarters. The cost of the emergency generator is $900,000, and if it is installed no losses from this type of incident will be incurred. However, if the generator is not installed, there is a 10% chance that a power outage will occur during the next year. If there is an outage, there is a 0.04 probability that the resulting losses will be very large, or approximately $90 million in lost earnings. Alternatively, it is estimated that there is a 0.96 probability of only slight losses of around $2 million. Using decision tree analysis, determine whether the bank should install the new power generator.
S1-30. Alleghany Mountain Power and Light is an electric utility company with a large fleet of vehicles including automobiles, light trucks, and construction equipment. The company is evaluating four alternative strategies for maintaining its vehicles at the lowest cost, including (1) take no preventive maintenance at all and repair vehicle components when they fail; (2) take oil samples at regular intervals and perform whatever preventive maintenance is indicated by the oil analysis; (3) change the vehicle oil on a regular basis and perform repairs when needed; and (4) change the oil at regular intervals and take oil samples regularly, performing maintenance repairs as indicated by the sample analysis.
For autos and light trucks, strategy 1 (no preventive maintenance) costs nothing to implement and results in two possible outcomes: There is a 0.08 probability that a defective component will occur requiring emergency maintenance at a cost of $1,600, or there is 0.92 probability that no defects will occur and no maintenance will be necessary.
Strategy 2 (take oil samples) costs $40 to implement (i.e., take a sample), and there is a 0.08 probability that there will be a defective part and 0.92 probability that there will not be a defect. If there is actually a defective part, there is a 0.70 probability the sample will correctly identify it, resulting in preventive maintenance at a cost of $500. However, there is a 0.30 probability that the sample will not identify the defect and indicate everything is okay, resulting in emergency maintenance later at a cost of $1,600. On the other hand, if there are actually no defects, there is a 0.20 probability that the sample will erroneously indicate that there is a defect, resulting in unnecessary maintenance at a cost of $250. There is a 0.80 probability that the sample will correctly indicate there are no defects, resulting in no maintenance and no costs.
Strategy 3 (changing the oil regularly) costs $34.80 to implement and has two outcomes: a 0.04 probability of a defective component, which will require emergency maintenance at a cost of $1,600, and a 0.96 probability that no defects will occur, resulting in no maintenance and no cost.
Strategy 4 (changing the oil and sampling) costs $54.80 to implement and results in the same probabilities of defects and no defects as strategy 3. If there is a defective component, there is a 0.70 probability that the sample will detect it and $500 in preventive maintenance costs will be incurred. Alternatively, there is a 0.30 probability that the sample will not detect the defect, resulting in emergency maintenance at a cost of $1,600. If there is no defect, there is a 0.20 probability the sample will indicate there is a defect, resulting in an unnecessary maintenance cost of $250, and a 0.80 probability that the sample will correctly indicate no defects, resulting in no cost.
Develop a decision strategy for Alleghany Mountain Power and Light and indicate the expected value of this strategy.[4]
S1-31. In Problem S1-30, the decision analysis is for automobiles and light trucks. Alleghany Mountain Power and Light would like to reformulate the problem for its heavy construction equipment. Emergency maintenance is much more expensive for heavy equipment, costing $15,000. Required preventive maintenance costs $2000 and unnecessary maintenance costs $1200. The cost of an oil change is $200 and the cost of taking an oil sample and analyzing it is $50. All the probabilities remain the same. Determine the strategy the company should use for its heavy equipment.
S1-32. Tech is playing State in the last conference game of the season. Tech is trailing State 21 to 14 with 7 seconds left in the game, when they score a touchdown. Still trailing 21 to 20, Tech can either go for two points and win or go for one point to send the game into overtime. The conference championship will be determined by the outcome of this game. If Tech wins they will go to the Sugar Bowl, with a payoff of $9.2 million; if they lose they will go to the Gator Bowl, with a payoff of $1.5 million. If Tech goes for two points there is a .30% chance they will be successful and win (and a .70% chance they will fail and lose). If they go for one point there is a 0.98 probability of success and a tie and a 0.02 probability of failure. If they tie they will play overtime, in which Tech believes they have only a 20% chance of winning because of fatigue.
Use decision-tree analysis to determine if Tech should go for one point or two points.
What would Tech's probability of winning the game in overtime have to be to make Tech indifferent between going for one point or two points?
S1-33. Mary Decker is suing the manufacturer of her car because of a defect that she believes caused her to have an accident, and kept her out of work for a year. She is suing the company for $3.5 million. The company has offered her a settlement of $700,000, of which Mary would receive $600,000 after attorneys' fees. Her attorney has advised her that she has a 50% chance of winning her case. If she loses she will incur attorneys' fees and court costs of $75,000. If she wins she is not guaranteed her full requested settlement. Her attorney believes that there is a 50% chance she could receive the full settlement, in which case Mary would get $2 million after her attorney takes his cut, and a 50% chance that the jury will award her a lesser amount of $1,000,000, of which Mary would get $500,000.
Using decision-tree analysis, decide if Mary should sue the manufacturer.
S1-34. State University has three health-care plans for its faculty and staff to choose from, as follows.
Plan 1—monthly cost of $32 with a $500 deductible; the participants pay the first $500 of medical payments for the year, the insurer pays 90% of all remaining expenses.
Plan 2—monthly cost of $5 but a deductible of $1200, with the insurer paying 90% of medical expenses after the insured pays the first $1200 in a year.
Plan 3—monthly cost of $24 with no deductible, the participants pay 30% of all expenses with the remainder paid by the insurer.
Tracy McCoy, an administrative assistant in the management department, estimates that her annual medical expenses are defined by the following probability distribution.
Annual Medical Expenses | Probability |
|---|---|
$100 | 0.15 |
500 | 0.30 |
1,500 | 0.35 |
3,000 | 0.10 |
5,000 | 0.05 |
10,000 | 0.05 |
Determine which medical plan Tracy should select.
S1-35. The Orchard Wine Company purchases grapes from one of two nearby growers each season to produce a particular red wine. It purchases enough grapes to produce 3000 bottles of the wine. Each grower supplies a certain portion of poor-quality grapes that will result in a percentage of bottles being used as fillers for cheaper table wines according to the following probability distribution.
Percentage Defective | Probability of % Defective | |
|---|---|---|
Grower A | Grower B | |
2 | 0.12 | 0.26 |
4 | 0.21 | 0.34 |
6 | 0.26 | 0.22 |
8 | 0.31 | 0.10 |
10 | 0.10 | 0.08 |
The two growers charge a different price for their grapes and because of differences in taste, the company charges different prices for their wine depending on which grapes they use. The annual profit from the wine produced from each grower's grapes for each percentage defective is as follows.
Defective | Profit | |
|---|---|---|
Grower A | Grower B | |
2% | $44,200 | $42,600 |
4 | 40,200 | 40,300 |
6 | 36,200 | 38,000 |
8 | 32,200 | 35,700 |
10 | 28,200 | 33,400 |
Use decision-tree analysis to determine from which grower the company should purchase grapes.
S1-36. Huntz Food Products is attempting to decide if it should introduce a new line of salad dressings called Special Choices. The company can test market the salad dressings in selected geographic areas or bypass the test market and introduce the product nationally. The cost of the test market is $150,000. If the company conducts the test market, it must wait to see the results before deciding whether or not to introduce the salad dressings nationally. The probability of a positive test market result is estimated to be 0.6. Alternatively, the company cannot conduct the test market and make the decision to introduce the dressings or not. If the salad dressings are introduced nationally and are a success, the company estimates it will realize an annual profit of $1,600,000 while if the dressings fail it will incur a loss of $700,000. The company believes the probability of success for the salad dressings is 0.50 if it is introduced without the test market. If the company does conduct the test market and it is positive, the probability of successfully introducing the salad dressings increases to 0.8. If the test market is negative and the company introduces the salad dressings anyway, the probability of success drops to 0.30.
Using decision-tree analysis, determine if the company should conduct the test market.
Whither an MBA at Strutledge?
Strutledge (see Case Problem 1.3) is a small liberal arts college faced with rising costs and decreasing enrollments. It would like to increase revenues (including tuition, donations, and grants) by expanding its student base and building ties with businesses in the surrounding area. To do so, it is considering establishing a new graduate program—an MBA, a masters in computer science, a masters in information technology, a masters in nursing (affiliated with a major hospital in a nearby urban area), or a masters in health-care administration. In addition to generating additional enrollments within a new program, administrators also believe that a new graduate program could increase exposure and visibility for the school and enhance its reputation, as a whole, which could also result in increased enrollments and revenue sources. The cost to establish and maintain each new program differs according to faculty salaries, facilities, and the support necessary to attract new students, which, in turn, affects revenues. The degree of success that each new graduate program might achieve is affected by competition from other colleges and universities, and the ability of a program to attract new faculty and students. The following payoff table summarizes the possible gains (i.e., revenues less costs) the college might realize with each new program under different future success scenarios.
Graduate Program | Program Success | |||
|---|---|---|---|---|
Unsuccessful | Moderate Success | Successful | Very Successful | |
MBA | −$316,000 | −$57,000 | $231,000 | $424,000 |
Computer Science | −210,000 | −35,000 | 190,000 | 375,000 |
Information Technology | −472,000 | −75,000 | 305,000 | 517,000 |
Nursing | −135,000 | 81,000 | 205,000 | 307,000 |
Health Administration | −75,000 | 55,000 | 180,000 | 245,000 |
Determine the best decision for the college using the following criteria.
Maximax
Maximin
Equal likelihood
Hurwicz (α = .50)
If Strutledge administrators use the Hurwicz criterion to make their decision, explain what this might mean about their decision-making strategy?
Strutledge has estimated probabilities of occurrence for the different states of program success as shown in the following table. What is the best decision using expected value?
Graduate Program
Program Success
Unsuccessful
Moderate Success
Successful
Very Successful
MBA
.32
.35
.24
.09
Computer Science
.38
.41
.16
.05
Information Technology
.25
.33
.30
.12
Nursing
.17
.28
.41
.14
Health Administration
.08
.34
.47
.11
Based on these decision analysis results what would you recommend that Strutledge College's decision be?
What decision would you recommend to Strutledge? Explain your reasons.
Transformer Replacement at Mountain States Electric Service
Mountain States Electric Service is an electrical utility company serving several states in the Rocky Mountain region. It is considering replacing some of its equipment at a generating substation and is attempting to decide whether it should replace an older, existing PCB transformer. (PCB is a toxic chemical known formally as polychlorinated biphenyl.) Even though the PCB generator meets all current regulations, if an incident occurred, such as a fire, and PCB contamination caused harm either to neighboring businesses or farms or to the environment, the company would be liable for damages. Recent court cases have shown that simply meeting utility regulations does not relieve a utility of liability if an incident causes harm to others. Also, courts have been awarding large damages to individuals and businesses harmed by hazardous incidents.
If the utility replaces the PCB transformer, no PCB incidents will occur, and the only cost will be that of the transformer, $85,000. Alternatively, if the company decides to keep the existing PCB transformer, then management estimates there is a 50-50 chance of there being a high likelihood of an incident or a low likelihood of an incident. For the case in which there is a high likelihood that an incident will occur, there is a 0.004 probability that a fire will occur sometime during the remaining life of the transformer and a 0.996 probability that no fire will occur. If a fire occurs, there is a 0.20 probability that it will be bad and the utility will incur a very high cost of approximately $90 million for the cleanup, whereas there is a 0.80 probability that the fire will be minor and a cleanup can be accomplished at a low cost of approximately $8 million. If no fire occurs, then no cleanup costs will occur. For the case in which there is a low likelihood of an incident occurring, there is a 0.001 probability that a fire will occur during the life of the existing transformer and a 0.999 probability that a fire will not occur. If a fire does occur, then the same probabilities exist for the incidence of high and low cleanup costs, as well as the same cleanup costs, as indicated for the previous case. Similarly, if no fire occurs, there is no cleanup cost.
Perform a decision-tree analysis of this problem for Mountain States Electric Service and indicate the recommended solution. Is this the decision you believe the company should make? Explain your reasons.
Source: This case was adapted from W. Balson, J. Welsh, and D. Wilson, "Using Decision Analysis and Risk Analysis to Manage Utility Environmental Risk," Interfaces 22 (6; November–December 1992), pp. 126–139.
Evaluating Projects at Nexcom Systems
Nexcom Systems develops information technology systems for commercial sale. Each year it considers and evaluates a number of different projects to undertake. It develops a road map for each project in the form of a decision tree that identifies the different decision points in the development process from the initial decision to invest in a project's development through the actual commercialization of the final product.
The first decision point in the development process is whether or not to fund a proposed project for one year. If the decision is no, then there is no resulting cost; if the decision is yes, then the project proceeds at an incremental cost to the company. The company establishes specific short-term, early technical milestones for its projects after one year. If the early milestones are achieved, the project proceeds to the next phase of project development; if the milestones are not achieved, the project is abandoned. In its planning process, the company develops probability estimates of achieving and not achieving the early milestones. If the early milestones are achieved, then the project is funded for further development during an extended time frame specific to a project. At the end of this time frame, a project is evaluated according to a second set of (later) technical milestones. Again the company attaches probability estimates for achieving and not achieving these later milestones. If the late milestones are not achieved, the project is abandoned.
If the late milestones are achieved, this means that technical uncertainties and problems have been overcome and the company next assesses the project's ability to meet its strategic business objectives. At this stage the company wants to know if the eventual product coincides with the company's competencies, and if there appears to be an eventual, clear market for the product. It invests in a product "prelaunch" to ascertain the answers to these questions. The outcomes of the prelaunch are that either there is a strategic fit or there is not, and the company assigns probability estimates to each of these two possible outcomes. If there is not a strategic fit at this point, the project is abandoned and the company loses its investment in the prelaunch process. If it is determined that there is a strategic fit, than three possible decisions result. (1) The company can invest in the product's launch and a successful or unsuccessful outcome will result, each with an estimated probability of occurrence. (2) The company can delay the product's launch and at a later date decide whether to launch or abandon. (3) If it launches later, then the outcomes are success or failure, each with an estimated probability of occurrence. Also, if the product launch is delayed, there is always a likelihood that the technology will become obsolete or dated in the near future, which tends to reduce the expected return.
The table provides the various costs, event probabilities, and investment outcomes for five projects the company is considering.
Determine the expected value for each project and then rank the projects accordingly for the company to consider.
Source: This case was adapted from R. K. Perdue, W. J. McAllister, P. V. King, and B. G. Berkey, "Valuation of R and D projects Using Options Pricing and Decision Analysis Models," Interfaces 29, (6; November–December 1999), pp. 57–74.
Decision Outcomes/Event | Project | ||||
|---|---|---|---|---|---|
1 | 2 | 3 | 4 | 5 | |
Fund—1 year | $200,000 | 380,000 | 270,000 | 230,000 | 400,000 |
P(Early milestones–yes) | 0.72 | 0.64 | 0.84 | 0.56 | 0.77 |
P(Early milestones–no) | 0.28 | 0.36 | 0.16 | 0.44 | 0.23 |
Long-term funding | $690,000 | 730,000 | 430,000 | 270,000 | 350,000 |
P(Late milestones–yes) | 0.60 | 0.56 | 0.65 | 0.70 | 0.72 |
P(Late milestones–no) | 0.40 | 0.44 | 0.35 | 0.30 | 0.28 |
Prelaunch funding | $315,000 | 420,000 | 390,000 | 410,0O0 | 270,000 |
P(Strategic fit–yes) | 0.80 | 0.75 | 0.83 | 0.67 | 0.65 |
P(Strategic fit–no) | 0.20 | 0.25 | 0.17 | 0.33 | 0.35 |
P(lnvest–success) | 0.60 | 0.65 | 0.70 | 0.75 | 0.83 |
P(lnvest–failure) | 0.40 | 0.35 | 0.30 | 0.25 | 0.17 |
P(Delay–success) | 0.80 | 0.70 | 0.65 | 0.80 | 0.85 |
P(Delay–failure) | 0.20 | 0.30 | 0.35 | 0.20 | 0.15 |
Invest–success | $7,300,000 | 8,200,000 | 4,700,000 | 5,200,000 | 3,800,000 |
Invest–failure | −2.000,000 | −3,500,000 | −1,500,000 | −2,100,000 | −900,000 |
Delay–success | 4,500,000 | 6,000,000 | 3,300,000 | 2,500,000 | 2,700,000 |
Delay–failure | −1,300,000 | −4,000,000 | −800,000 | −1,100,000 | −900,000 |
Holloway, C. A. Decision Making under Uncertainty. Englewood Cliffs, NJ: Prentice Hall, 1979.
Howard, R. A. "An Assessment of Decision Analysis." Operations Research 28 (1; January–February 1980), pp. 4–27.
Keeney, R. L. "Decision Analysis: An Overview." Operations Research 30 (5; September–October 1982), pp. 803–838.
Luce, R. D., and H. Raiffa. Games and Decisions. New York: John Wiley, 1957.
Von Neumann, J., and O. Morgenstern. Theory of Games and Economic Behavior, 3rd ed. Princeton, NJ: Princeton University Press, 1953.
Williams, J. D. The Complete Strategist, rev. ed. New York: McGraw-Hill, 1966.
[4] This problem is based on J. Mellichamp, D. Miller, and O-J. Kwon, "The Southern Company Uses a Probability Model for Cost Justification of Oil Sample Analysis," Interfaces 23(3; May-June 1993), pp. 118–124.