
In this chapter, you will learn about . . .
Project Planning
Global and Diversity Issues in Project Management
Project Scheduling
Project Control
CPM/PERT
Probabalistic Activity Times
CPM/PERT Analysis with OM Tools
Microsoft Project
Project Crashing and Time-Cost Tradeoff
Web resources for this chapter include
OM Tools Software
Animated Demo Problems
Internet Exercises
Online Practice Quizzes
Microsoft Project
Lecture Slides in PowerPoint
Virtual Tours
Company and Resource Weblinks
www.wiley.com/college/russell

Project Management AT MARS
In November 2009, Mars Chocolate North America completed two significant large-scale projects in Hackettstown, New Jersey: a solar garden, one of the largest solar projects in the state; and a renovated, state-of-the-art headquarters facility. The solar garden consists of more than 28,000 ground-mounted solar panels on 18 acres next to the Mars headquarters in Hackettstown, where M&M chocolate candies are also manufactured. The solar garden (owned and operated by PSEG Solar Source) provides about 2MW of power to the plant—enough power for about 1,800 homes—and approximately 20% of the plant's, peek energy consumption. The solar garden reduced carbon dioxide emissions by more than 1,000 metric tons, the equivalent of removing 190 cars from the road each year. The renovation project to the Mars headquarters included an open, flexible workplace designed to retain and attract employees and improve productivity. Environmentally friendly enhancements included the installation of water-conserving fixtures that reduced water usage by more than 30%; an upgraded Building Energy Management System that reduced energy use by 15%; energy-efficient lighting and controls; an upgraded roof that utilizes a highly reflective material that offsets the direct heat gain to the building; and the use of more than 20% recycled content in building materials, from carpet to ceiling tiles.
In this chapter we will learn how companies plan, manage, control, and schedule projects like Mars' solar garden, including project management tools like CPM/PERT.
Source: PRNewswire (http://multivu.prnewswire.com), November 10, 2009
•Activity: individual job or work effort requiring labor, resources and time, and is subject to management control.
In other chapters we discuss the scheduling of repetitive operations and activities, such as work scheduling and job scheduling, as an important aspect of managing an operation. Operational schedules are established to keep the flow of products or services through the supply chain on time. However, not all operational activities are repetitive; some are unique, occurring only once within a specified time frame. Such unique, one-time activities are referred to as projects.
•Project: a unique, one-time operational activity or effort.
Project management is the management of the work to develop and implement an innovation or change in an existing operation. It encompasses planning the project and controlling the project activities, subject to resource and budget constraints, to keep the project on schedule. Examples of projects include constructing facilities and buildings, such as houses, factories, a shopping mall, an athletic stadium, or an arena; developing a military weapons system, new aircraft, or new ship; launching a satellite system; constructing an oil pipeline, developing and implementing a new computer system; planning a rock concert, football bowl game, or basketball tournament; and in-troducing new products into the market.
Projects have become increasingly pervasive in companies in recent years. The nature of the global business environment is such that new machinery and equipment, as well as new production processes and computer support systems, are constantly evolving. This provides the capability of developing new products and services, which generates consumer demand for even greater product diversity. As a result, a larger proportion of total organizational effort now goes toward project-oriented activities than in the past. Thus, the planning and management of projects has taken on a more crucial role in operations management.
In this chapter we focus on project management using CPM and PERT network scheduling techniques that are popular because they provide a graph or visual representation of the interrelationship and sequence of individual project activities. However, prior to our presentation of the CPM/PERT technique, we will discuss the primary elements of the project management process—planning, scheduling, and control.
The general management process is concerned with the planning, organization, and control of an ongoing process or activity such as the production of a product or delivery of a service. Project management is different in that it requires a commitment of resources and people to an important undertaking that is not repetitive and involves a relatively short period of time, after which the management effort is dissolved. A project has a unique purpose, it is temporary, and it draws resources from various areas in the organization; as a result, it is subject to more uncertainty than the normal management process. Thus, the features and characteristics of the project management process tend to be unique.
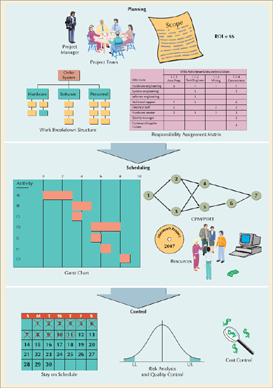
Figure 9.1 provides an overview of the project management process, which encompasses three other major processes—planning, scheduling, and control. It also includes a number of the more prominent elements of these processes. In the remainder of this section, we will discuss some features of the project planning process, and in the following few sections we will discuss the scheduling and control processes.
Project plans generally include the following basic elements.
Objectives—a detailed statement of what the project is to accomplish and how it will achieve the company's goals and meet the strategic plan; and an estimate of when it needs to be completed, the cost and the return.
Project scope—a discussion of how to approach the project, the technological and resource feasibility, the major tasks involved, and a preliminary schedule; includes a justification of the project and what constitutes project success.
Contract requirements—a general structure of managerial, reporting, and performance responsibilities, including a detailed list of staff, suppliers, subcontractors, managerial requirements and agreements, reporting requirements, and a projected organizational structure.
Schedules—a list of all major events, tasks, and subschedules, from which a master schedule is developed.
Resources—the overall project budget for all resource requirements and procedures for budgetry control.
Personnel—identification and recruitment of personnel required for the project team, including special skills and training.
Control—procedures for monitoring and evaluating progress and performance including schedules and cost.
Risk and problem analysis—anticipating and assessing uncertainties, problems and potential difficulties that might increase the risk of project delays and/or failure and threaten project success.
In order for a project to be selected to be undertaken it typically has to have some kind of positive gain or benefit for the organization that is considering it. In a business one of the most popular measures of benefit is return on investment (ROI). ROI is a performance measure that is often used to evaluate the expected outcome of a project or to compare a number of different projects. To calculate ROI, the benefit (return) of a project is divided by the cost of the project; the result is expressed as a percentage or a ratio:
If a project does not have a positive ROI, or if there are other projects with a higher ROI, then the project might not be undertaken. ROI is a very popular metric for project planning because of its versatility and simplicity.
However, projects sometimes have benefits that cannot be measured in a tangible way with something like an ROI, what's referred to as a "soft" return. For example, a project that has raising employee satisfaction as its goal can result in real benefits—increased productivity, improved quality, and lower costs—which are difficult to measure monetarily in the short run. A project by an Internet online retailer to install backup power generators to keep orders coming in and customers happy during a power outage is like insurance for something that may never happen, making an ROI difficult to determine. A "green" project may not have a tangible dollar ROI, but it can protect a company against regulatory infractions and improve its public image. In general, it may be more appropriate to measure a project's benefit not just in terms of financial return, but also in terms of the positive impact it may have on a company's employees and customers, that is, quality improvement.
Projects undertaken by government agencies or "not-for-profits" typically do not have an ROI-type benefit; they are undertaken to benefit the "public good," Examples of such projects are the restorations of the Royal Shakespeare and Company Theater in England and the American History Museum in Washington, DC, described, in the "Along the Supply Chain" box on page 388, and the U.S. Corps of Engineers New Orleans Restoration project following hurricane Katrina described in the "Along the Supply Chain" box on page 399. Cost containment is certainly an important consideration in such projects, but the actual benefit is not easy to measure in terms of dollars.
Project teams are made up of individuals from various areas and departments within a company.
The project team is typically cross-functional, consisting of a group of individuals selected from other areas in the organization or from outside the organization because of their special skills, expertise, and experience related to the project activities. Members of the engineering staff are often assigned to project work because of their technical skills, especially if the project is related to production processes or equipment. The project team may also include managers and staff personnel from specific areas related to the project. Workers can also be involved on the project team if their job is a function of the project activity. For example, a project team for the construction of a new loading dock facility might include truck drivers, forklift operators, dock workers, and staff personnel and managers from purchasing, shipping, receiving, and packaging, as well as engineers to assess vehicle flow, routes, and space considerations.
•Matrix organization: a team structure with members from functional areas, depending on the skills required.
The term matrix organization refers to a team approach to special projects. The team is developed from members of different functional areas or departments in the company. For example, team members might come from engineering, production, marketing, or human resources, depending on the specialized skills required by the project. The team members are, in effect, on loan from their home departments to work on a project. The term matrix is derived from the two-dimensional characteristics of this type of organizational structure. On one dimension, the vertical, is the company's normal organizational structure for performing jobs, whereas the horizontal dimension is the special functional structure (i.e., the functional team members) required by the project.
Assignment to a project team is usually temporary, which can have both positive and negative repercussions. The temporary loss of workers and staff from their permanent jobs can be disruptive for both the employee and the work area. The employee must sometimes "serve two masters," reporting to both the project manager and a regular supervisor. Since projects are usually exciting, they provide an opportunity to do work that is new and innovative, making the employee reluctant to report back to a more mundane, regular job after the project is completed.
The project manager is often under greater pressure.
The most important member of the project team is the project manager. Managing a project is subject to lots of uncertainty and the distinct possibility of failure. Since a project is unique and usually has not been attempted previously, the outcome is not as certain as the outcome of an on-going process would be. A degree of security is attained in the supervision of a continuing process that is not present in project management. The project team members are often from diverse areas of the organization and possess different skills, which must be coordinated into a single, focused effort to complete the project successfully. The project is subject to time and budgetary constraints that are not the same as normal work schedules and resource consumption in an ongoing process. There is usually more perceived and real pressure associated with project management than in a normal management position. However, there are potential opportunities, including demonstrating management abilities in a difficult situation, the challenge of working on a unique project, and the excitement of doing something new.
•Scope statement: a document that provides an understanding, justification, and expected result of a project.
The scope statement is a document that provides a common understanding of a project. It includes a justification for the project that describes which factors created a need within the company for the project. It also includes an indication of what the expected results of the project will be and what will constitute project success. The scope statement might also include a list of the types of planning reports and documents that are part of the project management process.
•Statement of work: a written description of the objectives of a project.
A similar planning document is the statement of work. In a large project, the statement of work is often prepared for individual team members, groups, departments, subcontractors, and suppliers. This statement describes the work in sufficient detail so that the team members responsible for it know what is required and if they have sufficient resources to accomplish the work successfully and on time. For suppliers and subcontractors it is often the basis for determining whether they can perform the work and for bidding on it. Some companies require that a statement of work be part of an official contract with a supplier or subcontractor.
The work breakdown structure (WBS) is a tool used for project planning. The WBS organizes the work to be done on a project. In a WBS, a project is broken down into its major components, referred to as modules. These components are then subdivided into detailed subcomponents, which are further broken down into activities and, finally, individual tasks. The end result is a project hierarchical organizational structure made up of different levels, with the overall project at the top of the structure and the individual tasks for each activity at the bottom level. The WBS format is a good way to identify activities and to determine the individual task, module, and project workloads and resources required. It also helps to identify relationships between modules and activities as well as unnecessary duplication of activities. Finally, it provides the basis for developing and managing the project schedule, resources, and modifications.
There is no specific model to follow for the development of a WBS. It can be in the form of a chart or a table. It can be organized around project groups, project phases, or project tasks and events. However, experience has shown that there are two good ways for a project team to develop a WBS. One way is to start at the top and work one's way down asking, "What components constitute this level?" until the WBS is developed in sufficient detail. The other way is simply to brainstorm the entire project, writing down each item on a sticky note and then organizing them together into the branches of a WBS. The upper levels of the WBS hierarchy tend to indicate the summary activities, major components, or functional areas involved in the project. They are typically described by nouns that indicate "what" is to be done. The lower levels of the WBS tend to describe the detailed work activities of the project required under the major components or areas. They are typically described by verbs that indicate "how" things are done.
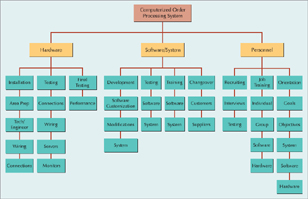
Figure 9.2 shows a WBS for a project for installing a new computerized order processing system for a textile manufacturer that links customers, the manufacturer, and suppliers (see Example 9.1 on page 389.). The WBS is organized according to the three major project categories for development of the system—hardware, software/system, and personnel. Within each of these categories the major tasks and activities under those tasks are detailed. For example, under hardware, a major task is "installation," and activities required in installation include area preparation, technical/engineering layouts and configurations, and wiring and electrical connections.
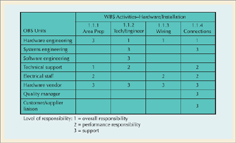
After the work breakdown structure is developed, which organizes the project work into smaller, manageable elements, the project manager assigns the work elements to organizational units—departments, groups, individuals, or subcontractors—using an organizational breakdown structure (OBS). The OBS is an organizational chart that shows which organizational units are responsible for work items. After the OBS is developed, the project manager can then develop a responsibility assignment matrix (RAM). The RAM shows who in the organization is responsible for doing the work in the project. Figure 9.3 on the next page shows a RAM for the "Hardware/Installation" category from the work breakdown structure for the computerized order processing project shown in Figure 9.2. Notice that there are three levels of work assignment in the matrix reflecting who is responsible for the work, who actually performs the work, and those who perform support activities. As with the WBS, both the OBS and RAM can take many different forms depending on the needs and preferences of the company, project team, and project manager.
In the existing global business environment, project teams form a mosaic of different genders, cultures, ethnicities, nationalities, religions, and races. Only by acknowledging and embracing this diversity will companies be able to attract the best people and achieve project success. Diversity offers a significant business advantage by providing a more well rounded perspective on a project from team members with different views, experiences, and values. The project leader must focus on creating common goals and objectives for the project by using good communication techniques and developing a cooperative environment that identifies common values and fosters mutual respect for differences. However, while a globally diverse project team can have advantages, project success typically requires respect for cultural differences and a management style that acknowledges these differences.
Global projects that involve companies and team members from different countries have expanded dramatically in recent years as a result of increased information and communication technology. Teamwork is a critical element in achieving project success, and in global projects diversity among international team members can add an extra dimension to project planning. For projects to be successful, cultural differences, idiosyncrasies, and issues must be considered as important parts of the planning process. The basics of project management tend to be universal, but cultural differences in priorities, nuances, and terminology can result in communication failures. Since English is used widely around the world, language is not necessarily an overriding problem. However, often it is not what people say that matters but what they mean.
An example of one cultural difference that can play havoc with developing project schedules is the difference in work days and holidays in different countries. Southern Europeans take a lot of holidays, which can mess up a project schedule if they are not planned for. In the United States you can ask people to move their vacations or work while on vacation (via phone or Internet), but in countries like France or Italy, don't ask. In India the work ethic is closer to the European than the U.S. model: when the day ends it's over, and weekends are inviolate. In some cultures, certain days are auspicious for starting a new venture or ending a task.
Some cultures tend to be less aggressive than others, and team members will avoid confrontation so that when problems on a project occur (such as cost overruns or missed due dates) they will not be as aggressively addressed as they might be in the United States or in Germany, for example. Some team members in underdeveloped countries may bow to the perceived superiority of those from developed countries and not aggressively press their points even though they may be correct. Some people may simply have trouble working with others with cultural differences. Team members may think they do not understand team members from a foreign country, when it's actually their culture they don't understand.
In Asian countries business typically employ a more methodical management style that values patience and building relationships. Project managers and team members in Japan consider establishing plans and providing direction to be more important managerial competencies than exist in the United States. What's considered to be micromanaging in the United States is the more common way of doing things in China. In Latin America a formal management style with specific managerial direction is a cultural trait. Business relationships are built slowly over time and they are based on trust and a sense of personal integrity. In Latin countries personal connections (that might include inquires into team members' personal lives) are often expected before business is transacted. In Malaysia a "boss" has almost absolute power over subordinates, whereas in Austria the perception is almost completely the opposite. The United States, Scandinavia, and many European countries fall somewhere in-between. In countries like the United Kingdom, Sweden, and Denmark, people tend to cope with uncertainty and unexpected events much better than people in Italy and Portugal.
As a result, the project manager must address the issue of cultural diversity up front in the planning process. Project managers have to approach diversity differently from country to country. The project manager should never assume that something that works at home will work abroad or that what will work in country A will work in country B. This makes cultural research and communication important elements in the planning process. The manager must determine what cultural faux pas must be avoided—the things you don't do. It's important to discover at the start what holidays and cultural celebrations exist and the work ethic of team members.
The project manager must often find team members who are particularly adept at bridging cultural differences. It may be helpful to identify a team associate who can keep the project manager and other team members informed of important cultural differences. Although long-distance communication via phone or e-mail is very easy, the face-to-face meeting is often better with someone with cultural differences, even with the added expense of travel.
The project schedule evolves from the planning documents we discussed in the previous section. It is typically the most critical element in the project management process, especially during the implementation phase (i.e., the actual project work), and it is the source of most conflict and problems. One reason is that frequently the single most important criterion for the success of a project is that it be finished on time. If a stadium is supposed to be finished in time for the first game of the season and it's not, there will be a lot of angry ticket holders; if a school building is not completed by the time the school year starts, there will be a lot of angry parents; if a shopping mall is not completed on time, there will be a lot of angry tenants; if a new product is not completed by the scheduled launch date, millions of dollars can be lost; and if a new military weapon is not completed on time, it could affect national security. Time is also a measure of progress that is very visible. It is an absolute with little flexibility; you can spend less money or use fewer people, but you cannot slow down or stop the passage of time.
Developing a schedule encompasses the following basic steps. First, define the activities that must be performed to complete the project; second, sequence the activities in the order in which they must be completed; next, estimate the time required to complete each activity; and finally, develop the schedule based on this sequencing and time estimates of the activities.
Because scheduling involves a quantifiable measure, time, several quantitative techniques, including the Gantt chart and CPM/PERT networks, are available that can be used to develop a project schedule. There are also various computer software packages that can be used to schedule projects, including the popular Microsoft Project. Later in this chapter we are going to discuss CPM/PERT and Microsoft Project in greater detail. For now, we are going to describe one of the oldest and most widely used scheduling techniques, the Gantt chart.
• Gantt chart: a graph or bar chart with a bar for each project activity that shows the passage of time.
A Gantt chart (also called a bar chart) was developed by Henry Gantt, a pioneer in the field of industrial engineering, at the artillery ammunition shops of the Frankford Arsenal in 1914. The Gantt chart has been a popular project scheduling tool since its inception and is still widely used today. It is the direct precursor of the CPM/PERT technique, which we will discuss later.
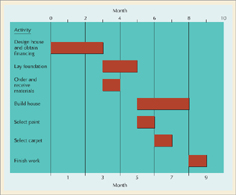
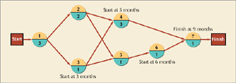
The Gantt chart is a graph with a bar representing time for each activity in the project being analyzed. Figure 9.4 below illustrates a Gantt chart of a simplified project description for building a house. The project contains only seven primary activities, such as designing the house, laying the foundation, ordering materials, and so forth. The first activity is "design house and obtain financing," and it requires three months to complete, shown by the bar from left to right across the chart. After the first activity is finished, the next two activities, "lay foundation" and "order and receive materials," can start simultaneously. This set of activities demonstrates how a precedence relationship works; the design of the house and the financing must precede the next two activities.
• Precedence relationship: the sequential relationship of project activities to each other.
The activity "lay foundation" requires two months to complete, so it will be finished, at the earliest, at the end of month 5. "Order and receive materials" requires one month to complete, and it could be finished after month 4. However, observe that it is possible to delay the start of this activity one month until month 4. This delay would still enable the activity to be completed by the end of month 5, when the next activity, "build house," is scheduled to start. This extra time for the activity "order materials" is called slack. Slack is the amount by which an activity can be delayed without delaying any of the activities that follow it or the project as a whole. The remainder of the Gantt chart is constructed in a similar manner, and the project is scheduled to be completed at the end of month 9.
•Slack: the amount of time an activity can be delayed without delaying the project.
The Gantt chart provides a visual display of the project schedule, indicating when activities are scheduled to start, when they will be finished, and where extra time is available and activities can be delayed. The project manager can use the chart to monitor the progress of the activities and see which ones are ahead of schedule and which ones are behind schedule. The Gantt chart also indicates the precedence relationships between activities; however, these relationships are not always easily discernible. This problem is one of the disadvantages of the Gantt chart method, and it sometimes limits the chart's use to smaller projects with relatively few activities. The CPM/PERT network technique does not suffer this disadvantage.
Project control is the process of making sure the project progresses toward a successful completion. It requires that the project be monitored and progress be measured so that any deviations from the project plan, and particularly the project schedule, are minimized. If the project is found to be deviating from the plan—that is, it is not on schedule, cost overruns are occurring, activity results are not as expected, and so on—then corrective action must be taken. In the rest of this section we will describe several key elements of project control, including time management, quality control, performance monitoring, and communication.
Time management is the process of making sure the project schedule does not slip and it is on time. This requires the monitoring of individual activity schedules and frequent updates. If the schedule is being delayed to an extent that jeopardizes the project success, then the project manager may have to shift resources to accelerate critical activities. Some activities may have slack time, and resources can be shifted from them to activities that are not on schedule. This is referred to as time–cost tradeoff. However, this can also push the project cost above budget. In some cases, the work may need to be corrected or made more efficient. In other cases, original activity time estimates upon implementation may prove to be unrealistic, with the result that the schedule must be changed and the repercussions of such changes on project success evaluated.
Cost management is often closely tied to time management because of the time–cost tradeoff occurrences that we mentioned previously. If the schedule is delayed, costs tend to increase in order to get the project back on schedule. Also, as the project progresses, some cost estimates may prove to be unrealistic or erroneous. As such, it will be necessary to revise cost estimates and develop budget updates. If cost overruns are excessive, then corrective actions must be taken.
Quality management and control are an integral part of the project management process. The process requires that project work be monitored for quality and that improvements be made as the project progresses just the same as in a normal production or manufacturing operation. Tasks and activities must be monitored to make sure that work is done correctly and that activities are completed correctly according to plan. If the work on an activity or task is flawed, subsequent activities may be affected, requiring rework, delaying the project, and threatening project success. Poor-quality work increases the risk of project failure, just as a defective part can result in a defective final product if not corrected. As such, the principles of quality management and many of the same techniques for statistical analysis and statistical process control discussed in earlier chapters for traditional production processes can also be applied to the project management process.
Performance management is the process of monitoring a project and developing timed (i.e., daily, weekly, monthly) status reports to make sure that goals are being met and the plan is being followed. It compares planned target dates for events, milestones, and work completion with dates actually achieved to determine whether the project is on schedule or behind schedule. Key measures of performance include deviation from the schedule, resource usage, and cost overruns. These reports are developed by the project manager and by individuals and organizational units with performance responsibility.
• Earned value analysis (EVA): a standard procedure for numerically measuring a project's progress, forecasting its completion date and cost and measuring schedule and budget variation.
Earned value analysis (EVA) is a specific system for performance management. Activities "earn value" as they are completed. EVA is a recognized standard procedure for numerically measuring a project's progress, forecasting its completion date and final cost, and providing measures of schedule and budget variation as activities are completed. For example, an EVA metric such as "schedule variance" compares the work performed during a time period with the work that was scheduled to be performed. A negative variance means the project is behind schedule. "Cost variance" is the budgeted cost of work performed minus the actual cost of the work. A negative variance means the project is over budget. EVA works best when it is used in conjunction with a work breakdown structure (WBS) that compartmentalizes project work into small packages that are easier to measure. The drawbacks of EVA are that it's sometimes difficult to measure work progress and the time required for data measurement can be considerable.
Communication needs for project and program management control in today's global business environment tend to be substantial and complex. The distribution of design documents, budget and cost documents, plans, status reports, schedules, and schedule changes in a timely manner is often critical to project success. As a result, more and more companies are using the Internet to communicate project information, and are using company intranet project Web sites to provide a single location for team members to access project information. Internet communication and software combined with faxing, videoconferencing systems, phones, handheld computers, and jet travel are enabling transnational companies to engage in global project management.
ALONG THE SUPPLY CHAIN
Reconstructing the Pentagon after 9/11
On September 11, 2001 at 9:37 A.M. American Airlines Flight 77, which had been hijacked by terrorists, was flown into the west face of the Pentagon in Arlington, Virginia. More than 400,000 square feet of office space were destroyed, and an additional 1.6 million square feet were damaged. Almost immediately the "Phoenix Project" to restore the Pentagon was initiated. A deadline of one year was established for the project completion, which required the demolition and removal of the destroyed portion of the building followed by the building restoration including the limestone facade. The Pentagon consists of five rings of offices (housing 25,000 employees) that emanate from the center of the building; ring "A" is the innermost ring, while ring "E" is the outermost. Ten corridors radiate out from the building's hub bisecting the rings and forming the Pentagon's five distinctive wedges. At the time of the attack, the Pentagon was undergoing a 20-year, $1.2 billion renovation program and the renovation of Wedge 1 that was demolished in the attack was nearing completion. As a result, the Phoenix Project leaders were able to use the Wedge 1 renovation project structure and plans as a basis for its own reconstruction plan and schedule, saving much time in the process. Project leaders were in place and able to assign resources on the very day of the attack. The project included over 30,000 activities and a 3,000-member project team and required 3 million man-hours of work during the project duration. Over 56,000 tons of contaminated debris were removed from the site, 2.5 million pounds of limestone were used to reconstruct the facade (using the original drawings from 1941), 21,000 cubic yards of concrete were poured, and 3,800 tons of reinforcing steel were placed. The Phoenix Project was completed almost a month ahead of schedule and nearly $194 million under the original budget estimate of $700 million.
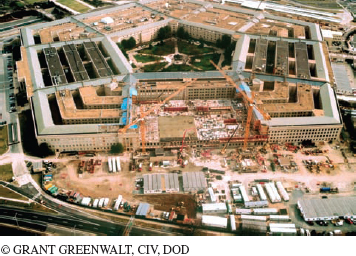
The project planning process for the reconstruction of the Pentagon began virtually on the day of the September 11 attack. The project was completed a month ahead of schedule and $194 million under budget.
Building construction is one of the main applications of project management; discuss some of the unique factors associated with the Pentagon project had that made it different from other, more typical, construction projects.
Source: N. Bauer, "Rising from the Ashes," PM Network, Vol. 18, no. 5 (May 2004): 24–32.
In many companies, project control takes place within the larger context of a multiple project environment. Enterprise project management refers to the management and control of a companywide portfolio of projects. In the enterprise approach to managing projects, a company's goals are achieved through the coordination of simultaneous projects. The company grows, changes, and adds value by systematically implementing projects of all types across the enterprise. The aggregate result of an organization's portfolio of projects becomes the company's bottom line. As such, program management is a managerial approach that sits above project management. Whereas project management concentrates on delivering a clearly defined, tangible outcome with its own scope and goals within a specified time frame, in a program management environment the company's goals and changes are achieved through a carefully planned and coordinated set of projects. Programs tend to cut across and affect all business areas and thus require a higher degree of cross-business functional coordination than individual projects.
In 1956, a research team at E. I. du Pont de Nemours & Company, Inc., led by a du Pont engineer, Morgan R. Walker, and a Remington-Rand computer specialist, James E. Kelley, Jr., initiated a project to develop a computerized system to improve the planning, scheduling, and reporting of the company's engineering programs (including plant maintenance and construction projects). The resulting network approach is known as the critical path method (CPM). At the same time, the U.S. Navy established a research team composed of members of the Navy Special Projects Office, Lockheed, and the consulting firm of Booz, Allen, and Hamilton, led by D. G. Malcolm.

The Lafayette, the nuclear-powered ballistic missile submarine shown here, is a direct descendent of the USS George Washington, the first nuclear submarine of this type. In the late 1950s the Polaris Fleet Ballistic Missile Project included more than 250 prime contractors and 9000 subcontractors. The Navy Department credited PERT with bringing the Polaris missile submarine to combat readiness approximately two years ahead of the originally scheduled completion date.
They developed a similar network approach for the design of a management control system for the development of the Polaris Missile Project (a ballistic missile-firing nuclear submarine). This network scheduling technique was named the program evaluation and review technique, or PERT. The Polaris project eventually included 23 PERT networks encompassing 3000 activities.
Both CPM and PERT are derivatives of the Gantt chart and, as a result, are very similar. There were originally two primary differences between CPM and PERT. With CPM a single estimate for activity time was used that did not allow for any variation in activity times—activity times were treated as if they were known for certain, or "deterministic."With PERT, multiple time estimates were used for each activity that allowed for variation in activity times—activity times were treated as "probabilistic." The other difference was related to the mechanics of drawing the project network. In PERT, activities were represented as arcs, or arrowed lines, between two nodes, or circles, whereas in CPM activities were represented as the nodes or circles. However, over time CPM and PERT have been effectively merged into a single technique conventionally referred to as CPM/PERT.
CPM/PERT uses a network to depict the precedence relationships among activities.
The advantage of CPM/PERT over the Gantt chart is in the use of a network to depict the precedence relationships between activities. The Gantt chart does not clearly show precedence relationships, which is a disadvantage that limited its use to small projects. The CPM/PERT network is a more efficient and direct means of displaying precedence relationships. In other words, in a network it is visually easier to see the precedence relationships, which makes CPM/PERT popular with managers and other users, especially for large projects with many activities.
•Activity-on-node (AON): nodes represent activities, and arrows show precedence relationships.
•Activity-on-arrow (AOA): arrows represent activities and nodes are events for points in time.
•Events: completion or beginning of an activity.
A CPM/PERT network consists of branches and nodes, as shown in Figure 9.5. When CPM and PERT were first developed, they employed different conventions for constructing a network. With CPM the nodes, or circles in Figure 9.5, represented the project activities. The arrows in between the nodes indicated the precedence relationships between activities. For the network in Figure 9.5, activity 1, represented by node 1, precedes activity 2, and 2 precedes 3. This approach to network construction is called activity-on-node (AON). With PERT the opposite convention was taken. The branches represented the activities, and the nodes in between them reflected events, or points in time such as the end of one activity and the beginning of another. In this approach, referred to as activity-on-arrow (AOA), the activities are normally identified by the node numbers at the start and end of an activity; for example, activity 1–2 precedes activity 2–3 in Figure 9.5. In this book, we will focus on the AON convention, but we will also provide an overview of AOA networks.

To demonstrate how these components are used to construct the two types of network, we will use our example project of building a house used in the Gantt chart in Figure 9.4. The comparable AOA CPM/PERT network for this project is shown in Figure 9.6. The precedence relationships are reflected in this network by the arrangement of the arrowed (or directed) branches in Figure 9.6. The first activity (1–2) in the project is to design the house and obtain financing. This activity must be completed before any subsequent activities can begin. Thus, activities 2–3, laying the foundation, and 2–4, ordering and receiving materials, can start only when node 2 is realized, indicating the event that activity 1–2 is finished. (Notice in Figure 9.6 that a time estimate of three months has been assigned for the completion of this activity). Activity 2–3 and activity 2–4 can occur concurrently; neither depends on the other, and both depend only on the completion of activity 1–2.
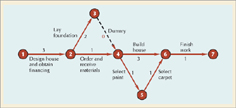
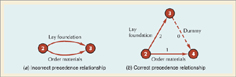
When the activities of laying the foundation (2–3) and ordering and receiving materials (2–4) are completed, then activities 4–5 and 4–6 can begin simultaneously. However, before discussing these activities further, notice activity 3–4, referred to in the network as a dummy.
•Dummy: two or more activities cannot share the same start and end nodes.
A dummy activity is inserted into the network to show a precedence relationship, but it does not represent any actual passage of time. Activities 2–3 and 2–4 have the precedence relationship shown in Figure 9.7a. However, in an AOA network, two or more activities are not allowed to share the same starting and ending nodes. Instead, activity 3–4 is inserted to give two activities separate end nodes and, thus, two separate identities as shown in Figure 9.7b. Notice, however, that a time of zero months has been assigned to activity 3–4. The dummy activity shows that activity 2–3 must be completed prior to any activities beginning at node 4, but it does not represent the passage of time.
Returning to the network in Figure 9.6, we see that two activities start at node 4. Activity 4–6 is the actual building of the house, and activity 4–5 is the search for and selection of the paint for the exterior and interior of the house. Activity 4–6 and activity 4–5 can begin simultaneously and take place concurrently. Following the selection of the paint (activity 4–5) and the realization of node 5, the carpet can be selected (since the carpet color depends on the paint color). This activity can also occur concurrently with the building of the house (activity 4–6). When the building is completed and the paint and carpet are selected, the house can be finished (activity 6–7).
Figure 9.8 shows the comparable AON network to the AOA network in Figure 9.6 for our house building project. Notice that the activities and activity times are on the nodes and not on the activities as they were previously with the AOA network. The branches or arrows simply show the precedence relationships between the activities. Also, notice that there is no dummy activity; dummy activities are not required in an AON network since two activities will never be confused because they have the same start and end nodes. This is one advantage of the AON convention, although each has minor advantages and disadvantages. In general, both of the two methods accomplish the same thing, and the one that is used is usually a matter of individual preference. However, for our purposes the AON network has one distinct advantage—it is the convention used in the popular Microsoft Project software package, and because we want to demonstrate how to use this software, we will use the AON convention in this chapter.
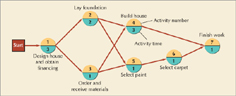
A network path is a sequence of connected activities that runs from the start to the end of the network. The network in Figure 9.8 has several paths through it. In fact, close observations of this network show four paths, identified as A, B, C, and D:
A: 1 – 2 – 4 – 7
B: 1 – 2 – 5 – 6 – 7
C: 1 – 3 – 4 – 7
D: 1 – 3 – 5 – 6 – 7
The project cannot be completed (i.e., the house cannot be built) sooner than the time required by the longest path in the network, in terms of time. The path with the longest duration of time is referred to as the critical path.
•Critical path: the longest path through a network; it is the minimum project completion time.
By summing the activity times (shown in Figure 9.8) along each of the four paths, we can compute the length of each path, as follows:
Path A: 1 – 2 – 4 – 7
3 + 2 + 3 + 1 = 9 months
Path B: 1 – 2 – 5 – 6 – 7
3 + 2 + 1 + 1 + 1 = 8 months
3 + 1 + 3 + 1 = 8 months
Path D: 1 – 3 – 5 – 6 – 7
3 + 1 + 1 + 1 + 1 = 7 months
Because path A is the longest, it is the critical path; thus, the minimum completion time for the project is nine months. Now let us analyze the critical path more closely. From Figure 9.9 we can see that activity 3 cannot start until three months have passed. It is also easy to see that activity 4 will not start until five months have passed. The start of activity 4 is dependent on two activities leading into node 4. Activity 2 is completed after five months, but activity 3 is completed at the end of four months. Thus, we have two possible start times for activity 4, five months and four months. However, since the activity at node 4 cannot start until all preceding activities have been finished, the soonest node 4 can be realized is five months.
Now consider the activity following node 4. Using the same logic as before, activity 7 cannot start until after eight months (five months at node 4 plus the three months required by activity 4) or after seven months. Because all activities preceding node 7 must be completed before activity 7 can start, the soonest this can occur is eight months. Adding one month for activity 7 to the start time at node 7 gives a project duration of nine months. This is the time of the longest path in the network—the critical path.
This brief analysis demonstrates the concept of a critical path and the determination of the minimum completion time of a project. However, this was a cumbersome method for determining a critical path. Next, we discuss a mathematical approach to scheduling the project activities and determining the critical path.
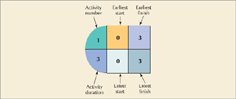
•Earliest start time (ES): the earliest time an activity can start.
In our analysis of the critical path, we determined the earliest time that each activity could be finished. For example, we found that the earliest time activity 4 could start was five months. This time is referred to as the earliest start time, and it is expressed symbolically as ES. In order to show the earliest start time on the network as well as some other activity times we will develop in the scheduling process, we will alter our node structure a little. Figure 9.10 shows the structure for node 1, the first activity in our example network for designing the house and obtaining financing.
• Forward pass: starts at the beginning of a CPM/PERT network to determine the earliest activity times.
To determine the earliest start time for every activity, we make a forward pass through the network. That is, we start at the first node and move forward through the network. The earliest start time for an activity is the maximum time in which all preceding activities have been completed—the time when the activity start node is realized.
•Earliest finish time (EF): is the earliest start time plus the activity time.
The earliest finish time (EF), for an activity is simply the earliest start time plus the activity time estimate. For example, if the earliest start time for activity 1 is at time 0, then the earliest finish time is three months. In general, the earliest start and finish times for an activity are computed according to the following mathematical relationship.
ES = maximum (EF) of immediate predecessors
EF = ES + t
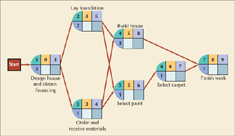
The earliest start and earliest finish times for all the activities in our project network are shown in Figure 9.11.
The earliest start time for the first activity in the network (for which there are no predecessor activities) is always 0, or, ES = 0. This enables us to compute the earliest finish time for activity 1 as
EF = ES + t
= 0 + 3
= 3 months
The earliest start for activity 2 is
ES = max (EF immediate predecessors)
= 3 months
and the corresponding earliest finish time is
EF = ES + t
= 3 + 2
= 5 months
For activity 3 the earliest start time (ES) is three months, and the earliest finish time (EF) is four months.
Now consider activity 4, which has two predecessor activities. The earliest start time is
ES = max (EF immediate predecessors)
= max 15, 42
= 5 months
and the earliest finish time is
EF = ES + t
= 5 + 3
= 8 months
All the remaining earliest start and finish times are computed similarly. Notice in Figure 9.11 that the earliest finish time for activity 7, the last activity in the network, is nine months, which is the total project duration, or critical path time.
•Latest start time (LS): the latest time an activity can start without delaying critical path time.
Companions to the earliest start and finish are the latest start and latest finish times, LS and LF. The latest start time is the latest time an activity can start without delaying the completion of the project beyond the project critical path time. For our example, the project completion time (and earliest finish time) at node 7 is nine months. Thus, the objective of determining latest times is to see how long each activity can be delayed without the project exceeding nine months.
• Latest finish time (LF): the latest time an activity can be completed and still maintain the project critical path time.
In general, the latest start and finish times for an activity are computed according to the following formulas:
LS = LF – t
LF = min (LS immediate following activities)
•Backward pass: determines latest activity times by starting at the end of a CPM/PERT network and working forward.
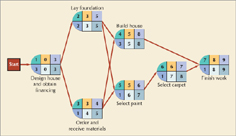
Whereas a forward pass through the network is made to determine the earliest times, the latest times are computed using a backward pass. We start at the end of the network at node 7 and work backward, computing the latest times for each activity. Since we want to determine how long each activity in the network can be delayed without extending the project time, the latest finish time at node 7 cannot exceed the earliest finish time. Therefore, the latest finish time at node 7 is nine months. This and all other latest times are shown in Figure 9.12.
Starting at the end of the network, the critical path time, which is also equal to the earliest finish time of activity 7, is nine months. This automatically becomes the latest finish time for activity 7, or
LF = 9 months
Using this value, the latest start time for activity 7 is
LS = LF – t
= 9 – 1
= 8 months
The latest finish time for activity 6 is the minimum of the latest start times for the activities following node 6. Since activity 7 follows node 6, the latest finish time is
LF6 = min (LS following activities)
= 8 months
The latest start time for activity 6 is
LS = LF – t
= 8 – 1
= 7 months
For activity 4, the latest finish time (LF) is eight months, and the latest start time (LS) is five months; for activity 5, the latest finish time (LF) is seven months, and the latest start time (LS) is six months.
Now consider activity 3, which has two activities, 4 and 5, following it. The latest finish time is computed as
LF = min (LS following activities)
= min (5, 6)
= 5 months
The latest start time is
LS = LF – t
= 5 – 1
= 4 nonths
All the remaining latest start and latest finish times are computed similarly. Figure 9.12 includes the earliest and latest start times, and earliest and latest finish times for all activities.
The project network in Figure 9.12, with all activity start and finish times, highlights the critical path (1–2–4–7) we determined earlier by inspection. Notice that for the activities on the critical path, the earliest start times and latest start times are equal. This means that these activities on the critical path must start exactly on time and cannot be delayed at all. If the start of any activity on the critical path is delayed, then the overall project time will be increased. We now have an alternative way to determine the critical path besides simply inspecting the network. The activities on the critical path can be determined by seeing for which activities ES = LS or EF = LF. In Figure 9.12 the activities 1, 2, 4, and 7 all have earliest start times and latest start times that are equal (and EF = LF); thus, they are on the critical path.

A primary use of CPM/PERT is to plan and manage construction projects of all types, such as the 80,000-seat 2012 Olympic Stadium in Stratford, near London, at a cost of £ 469 million.
For activities not on the critical path for which the earliest and latest start times (or earliest and latest finish times) are not equal, slack time exists. We introduced slack with our discussion of the Gantt chart in Figure 9.4. Slack is the amount of time an activity can be delayed without affecting the overall project duration. In effect, it is extra time available for completing an activity.
Slack, S, is computed using either of the following formulas:
S = LS – ES
or
S = LF – EF
For example, the slack for activity 3 is
S = LS – ES
= 4 – 3
= 1 month
If the start of activity 3 were delayed for one month, the activity could still be completed by month 5 without delaying the project completion time. The slack for each activity in our example project network is shown in Table 9.1. Table 9.1 shows there is no slack for the activities on the critical path (marked with an asterisk); activities not on the critical path have slack.
Notice in Figure 9.12 that activity 3 can be delayed one month and activity 5 that follows it can be delayed one more month, but then activity 6 cannot be delayed at all even though it has one month of slack. If activity 3 starts late at month 4 instead of month 3, then it will be completed at month 5, which will not allow activity 5 to start until month 5. If the start of activity 5 is delayed one month, then it will be completed at month 7, and activity 6 cannot be delayed at all without exceeding the critical path time. The slack on these three activities is called shared slack. This means that the sequence of activities 3–5–6 can be delayed two months jointly without delaying the project, but not three months.
Slack is beneficial to the project manager because it enables resources to be temporarily diverted from activities with slack and used for other activities that might be delayed for various reasons or for which the time estimate has proved to be inaccurate.
The times for the network activities are simply estimates, for which there is usually not a lot of historical basis (since projects tend to be unique undertakings). As such, activity time estimates are subject to quite a bit of uncertainty. However, the uncertainty inherent in activity time estimates can be reflected to a certain extent by using probabilistic time estimates instead of the single, deterministic estimates we have used so far.
ALONG THE SUPPLY CHAIN
A Couple of Iconic Building Renovation Projects
The National Museum of American History in Washington, DC, reopened in November, 2008 after a two-year, $85 million renovation project. The project focused on three areas—architectural enhancements to the Museum's interior, constructing a state-of-the-art gallery for the Star-Spangled Banner, and updating the 42-year-old building's infrastructure (mechanical, electrical, plumbing, lighting, fire, and security systems). The interior renovations included a five-story central atrium with a skylight that opens up the building to bright daylight, a grand staircase connecting the Museum's first and second floors, 10-foot-high artifact walls on both the first and second floors showcasing the breadth of the Museum's 3 million objects, and a welcome center on the second floor to improve visitor orientation. One of the renovation challenges was protecting the museum items. Smaller items, like Dorothy's ruby slippers from the Wizard of Oz, were moved to specially constructed storage areas and sealed in enormous boxes lined with monitors and vibration sensors, while larger artifacts, such as an 18-ton statue of George Washington, had to be protected in place. However, the project's centerpiece was a new $19 million chamber with special lighting for the museum's most prized artifact, the Star Spangled Banner.
Across the Atlantic in England a six-year project is ongoing to restore and modernize the Royal Shakespeare and Company main theater in Stratford-upon-Avon, at a cost of 112.8 million British pounds. Shakespeare created his plays with an intimate environment in mind, with the audience standing right in front of the stage. However, a reconstruction of the theater in the 1930s included a traditional fanshaped seating design with the audience far from the stage, which dramatically altered Shakespeare's intended playgoer's experience. The renovation project is creating a new stage that extends into the audience on three sides and which can also be reconfigured and set up in the round, immersing the 1,000 audience members in the type of performance Shakespeare intended. Although the project plan seemed straightforward at first, like many projects involving historical building sites, the reality proved different. The new stage required a 23-foot-deep basement to be dug, but the theater is located on the banks of the River Avon. When the project team began digging the basement they discovered that the 1930s approach to keeping the river water out was to fill in an enormous hole with concrete, so instead of simply digging out the new basement, a mass of concrete had to be broken up. When the concrete was removed the basement was under the water table, so water had to be constantly pumped away from the work site and a special rig had to pump sealants into the ground around the basement's outer wall. Despite the unique problems posed by historic building renovation projects—like building a special room for the United States's flag and creating a stage for plays as the Bard intended—as he might say himself, "All's well that ends well."
Sources: Jesss Wangness, "Cleaning Out the Attic," PM Network, vol. 23 (8: August 2009), pp. 50–53; and Libby Ellis, "All the World's a Stage," PM Network, vol. 23(7: July 2009), pp. 52–59.

Renovation projects use project management techniques, such as the six-year project to restore and renovate the Royal Shakespeare and Company theater in Stratford-upon-Avon, at a cost of £ 11.28 million.
In the project network for building a house in the previous section, all activity time estimates were single values. By using only a single activity time estimate, we are, in effect, assuming that activity times are known with certainty (i.e., they are deterministic). For example, in Figure 9.8, the time estimate for activity 2 (laying the foundation) is two months. Since only this one value is given, we must assume that the activity time does not vary (or varies very little) from two months. It is rare that activity time estimates can be made with certainty. Project activities are likely to be unique with little historical evidence that can be used as a basis to predict activity times. Recall that one of the primary differences between CPM and PERT is that PERT uses probabilistic activity times.
Probabilistic time estimates reflect uncertainty of activity times.
•Beta distribution: a probability distribution traditionally used in CPM/PERT.
In the PERT-type approach to estimating activity times, three time estimates for each activity are determined, which enables us to estimate the mean and variance of a beta distribution of the activity times.
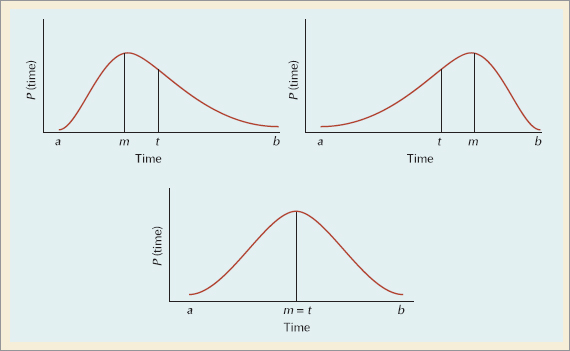
We assume that the activity times can be described by a beta distribution for several reasons. The beta distribution mean and variance can be approximated with three time estimates. Also, the beta distribution is continuous, but it has no predetermined shape (such as the bell shape of the normal curve). It will take on the shape indicated—that is, be skewed—by the time estimates given. This is beneficial, since typically we have no prior knowledge of the shapes of the distributions of activity times in a unique project network. Although other types of distributions have been shown to be no more or less accurate than the beta, it has become traditional to use the beta distribution to estimate probabilistic activity times.
The three time estimates for each activity are the most likely time (m), the optimistic time (a), and the pessimistic time (b). The most likely time is a subjective estimate of the activity time that would most frequently occur if the activity were repeated many times. The optimistic time is the shortest possible time to complete the activity if everything went right. The pessimistic time is the longest possible time to complete the activity assuming everything went wrong. The person most familiar with an activity or the project manager makes these "subjective" estimates to the best of his or her knowledge and ability.
• Optimistic (a), most likely (m), and pessimistic (b): time estimates for an activity.
These three time estimates are used to estimate the mean and variance of a beta distribution, as follows:
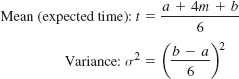
where
a = optimistic time estimate
m = most likely time estimate
b = pessimistic time estimate
These formulas provide a reasonable estimate of the mean and variance of the beta distribution, a distribution that is continuous and can take on various shapes, or exhibit skewness.
Figure 9.13 illustrates the general form of beta distributions for different relative values of a, m, and b.
A Project Network with Probabilistic Time Estimates
The Southern Textile Company has decided to install a new computerized order processing system that will link the company with customers and suppliers. In the past, orders were processed manually, which contributed to delays in delivery orders and resulted in lost sales. The new system will improve the quality of the service the company provides. The company wants to develop a project network for the installation of the new system. The network for the installation of the new order processing system is shown in the following figure.
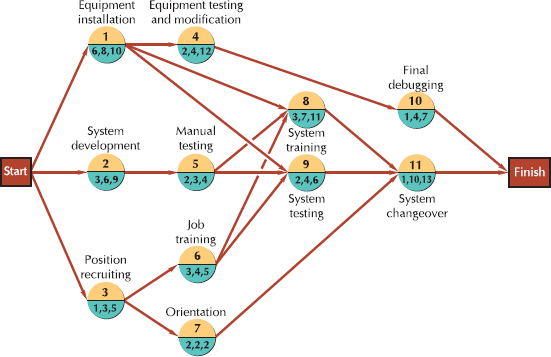
The network begins with three concurrent activities: The new computer equipment is installed (activity 1); the computerized order processing system is developed (activity 2); and people are recruited to operate the system (activity 3). Once people are hired, they are trained for the job (activity 6), and other personnel in the company, such as marketing, accounting, and production personnel, are introduced to the new system (activity 7). Once the system is developed (activity 2) it is tested manually to make sure that it is logical (activity 5). Following activity 1, the new equipment is tested, any necessary modifications are made (activity 4), and the newly trained personnel begin training on the computerized system (activity 8). Also, node 9 begins the testing of the system on the computer to check for errors (activity 9). The final activities include a trial run and changeover to the system (activity 11), and final debugging of the computer system (activity 10).
The three time estimates, the mean, and the variance for all the activities in the network as shown in the figure are provided in the following table:
Activity Time Estimates
Activity | Time Estimates (weeks) | Variance | Mean Time | ||
|---|---|---|---|---|---|
a | m | b | t | σ2 | |
1 | 6 | 8 | 10 | 8 | 0.44 |
2 | 3 | 6 | 9 | 6 | 1.00 |
3 | 1 | 3 | 5 | 3 | 0.44 |
4 | 2 | 4 | 12 | 5 | 2.78 |
5 | 2 | 3 | 4 | 3 | 0.11 |
6 | 3 | 4 | 5 | 4 | 0.11 |
7 | 2 | 2 | 2 | 2 | 0.00 |
8 | 3 | 7 | 11 | 7 | 1.78 |
9 | 2 | 4 | 6 | 4 | 0.44 |
10 | 1 | 4 | 7 | 4 | 1.00 |
11 | 1 | 10 | 13 | 9 | 4.00 |
Solution
As an example of the computation of the individual activity mean times and variance, consider activity 1. The three time estimates (a = 6, m = 8, b = 10) are substituted in the formulas as follows:
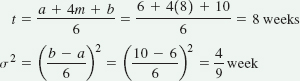
The other values for the mean and variance are computed similarly.
Once the mean times have been computed for each activity, we can determine the critical path the same way we did in the deterministic time network, except that we use the expected activity times, t. Recall that in the home building project network, we identified the critical path as the one containing those activities with zero slack. This requires the determination of earliest and latest start and finish times for each activity, as shown in the following table and figure:
Activity Earliest and Latest Times and Slack
Activity | t | σ2 | ES | EF | LS | LF | S |
|---|---|---|---|---|---|---|---|
1 | 8 | 0.44 | 0 | 8 | 1 | 9 | 1 |
2 | 6 | 1.00 | 0 | 6 | 0 | 6 | 0 |
3 | 3 | 0.44 | 0 | 3 | 2 | 5 | 2 |
4 | 5 | 2.78 | 8 | 13 | 16 | 21 | 8 |
5 | 3 | 0.11 | 6 | 9 | 6 | 9 | 0 |
6 | 4 | 0.11 | 3 | 7 | 5 | 9 | 2 |
7 | 2 | 0.00 | 3 | 5 | 14 | 16 | 11 |
8 | 7 | 1.78 | 9 | 16 | 9 | 16 | 0 |
9 | 4 | 0.44 | 9 | 13 | 12 | 16 | 3 |
10 | 4 | 1.00 | 13 | 17 | 21 | 25 | 8 |
11 | 9 | 4.00 | 16 | 25 | 16 | 25 |
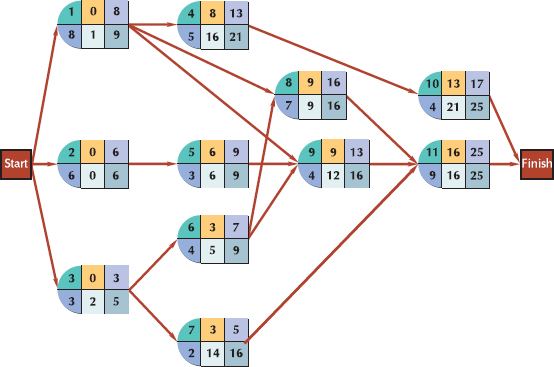
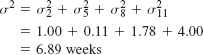
From the table, we can see that the critical path encompasses activities 2–5–8–11, since these activities have no available slack. We can also see that the expected project completion time (tp) is the same as the earliest or latest finish for activity 11, or tp = 25 weeks. To determine the project variance, we sum the variances for the activities on the critical path. Using the variances shown in the table for the critical path activities, we can compute the total project variance as follows:
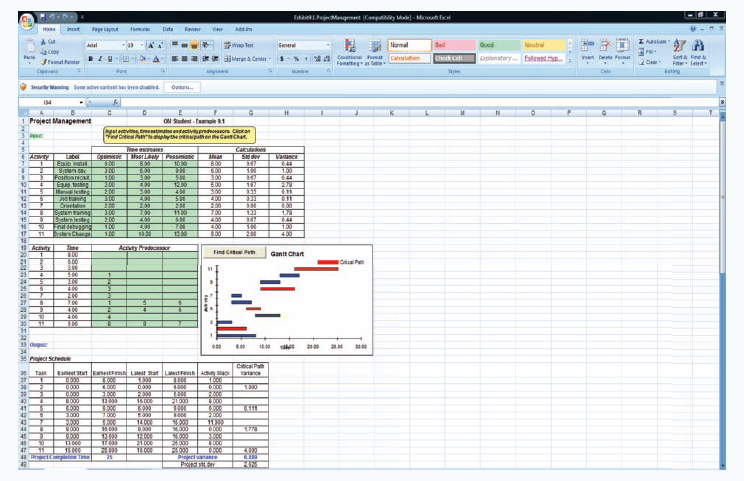
The "Project Management" module in OM Tools has the capability to develop both single-time estimate and three-time estimate networks. Exhibit 9.1 shows the OM Tools spreadsheet for the "Order Processing System" project in Example 9.1.
The CPM/PERT method assumes that the activity times are statistically independent, which allows us to sum the individual expected activity times and variances to get an expected project time and variance. It is further assumed that the network mean and variance are normally distributed. This assumption is based on the central limit theorem of probability, which for CPM/PERT analysis and our purposes states that if the number of activities is large enough and the activities are statistically independent, then the sum of the means of the activities along the critical path will approach the mean of a normal distribution. For the small examples in this chapter, it is questionable whether there are sufficient activities to guarantee that the mean project completion time and variance are normally distributed. Although it has become conventional in CPM/PERT analysis to employ probability analysis using the normal distribution regardless of the network size, the pru-dent user should bear this limitation in mind.
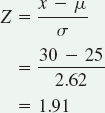
Probabilistic analysis of a CPM/PERT network is the determination of the probability that the project will be completed within a certain time period given the mean and variance of a normally distributed project completion time. This is illustrated in Figure 9.14. The value Z is computed using the following formula:
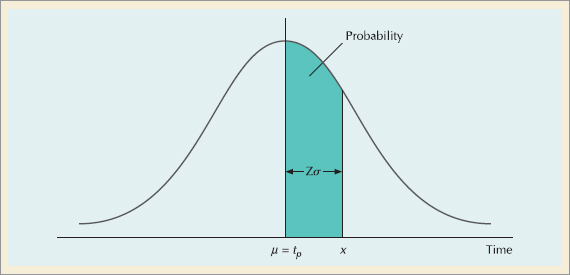
where
μ = tp = project mean time
x = the proposed project time
Z = number of standard devisions x is from the mean
This value of Z is then used to find the corresponding probability in Table A.1 (Appendix A).
Probabilistic Analysis of the Project Network
The Southern Textile Company in Example 9.1 has told its customers that the new order processing system will be operational in 30 weeks. What is the probability that the system will be ready by that time?
Solution
The probability that the project will be completed within 30 weeks is shown as the shaded area in the accompanying figure. To compute the Z value for a time of 30 weeks, we must first compute the standard deviation (σ) from the variance (σ2).
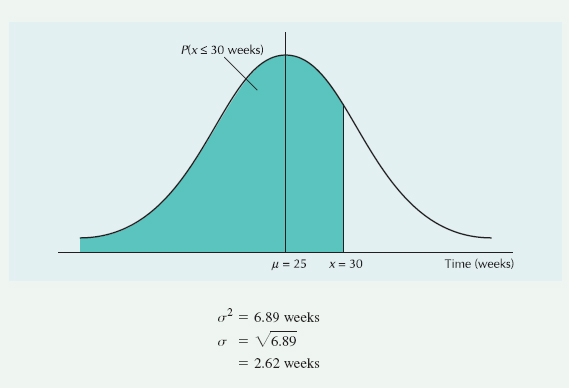
Next we substitute this value for the standard deviation along with the value for the mean, 25 weeks, and our proposed project completion time, 30 weeks, into the following formula:
A Z value of 1.91 corresponds to a probability of 0.4719 in Table A.1 in Appendix A. This means that there is a 0.9719 probability of completing the project in 30 weeks or less (adding the probability of the area to the left of μ = 25, or 0.5000 to 0.4719).
Probabilistic Analysis of the Project Network
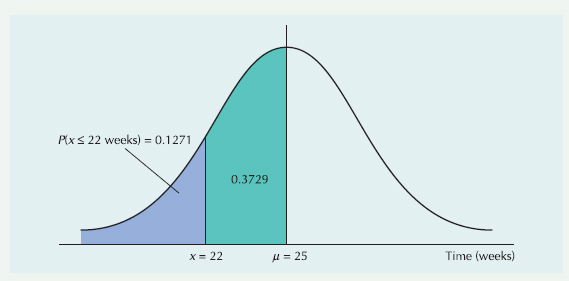
A customer of the Southern Textile Company has become frustrated with delayed orders and told the company that if the new ordering system is not working within 22 weeks, it will not do any more business with the textile company. What is the probability the order processing system will be operational within 22 weeks?
Solution
The probability that the project will be completed within 22 weeks is shown as the shaded area in the accompanying figure.
The probability of the project's being completed within 22 weeks is computed as follows:
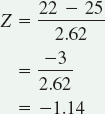
A Z value of –1.14 corresponds to a probability of 0.3729 in the normal table in Appendix A. Thus, there is only a 0.1271 (i.e., 0.5000 – 0.3729) probability that the system will be operational in 22 weeks.
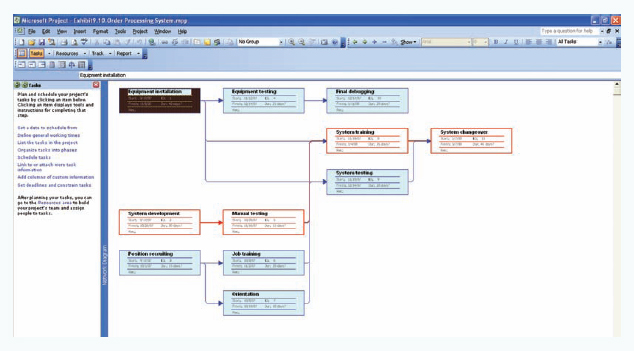
Microsoft Project is a very popular and widely used software package for project management and CPM/PERT analysis. It is also relatively easy to use. We will demonstrate how to use Microsoft Project using our project network for building a house in Figure 9.8. Note that the Microsoft Project file for this example beginning with Exhibit 9.2 can be downloaded from the text Web site.
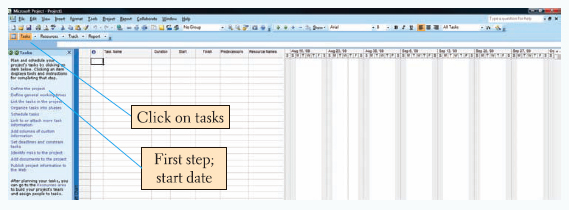
When you open Microsoft Project, a screen comes up for a new project. Click on the "Tasks" button and the screen like the one shown in Exhibit 9.2 will appear. Notice the set of steps on the left side of the screen starting with "define the project." If you click on "this step," it enables you to set a start date and save it. We set the start date for our house building project as June 10, 2010.
The second step in the "Tasks" menu, "Define general working times," allows the user to specify general work rules and a work calendar including such things as working hours per day, holidays, and weekend days off. In the third step in the "Tasks" menu, we can "List the tasks in the project." The tasks for our house building project are shown in Exhibit 9.3. Notice that we also indicated the duration of each task in the "Duration" column. For example, to enter the duration of the first activity, you would type in "3 months" in the duration column. Notice that the first task is shown to start on June 10.
The next thing we will do is "Schedule tasks" by specifying the predecessor and successor activities in our network. This is done by using the buttons under the "Link dependent tasks" window in Exhibit 9.3. For example, to show that activity 1 precedes activity 2, we put the cursor on activity 1 and then hold down the "Ctrl" key while clicking on activity 2. This makes a "finish to start" link between two activities, which means that activity 2 cannot start until activity 1 is finished. This creates the precedence relationship between these two activities, which is shown under the "Predecessor" column in Exhibit 9.3.
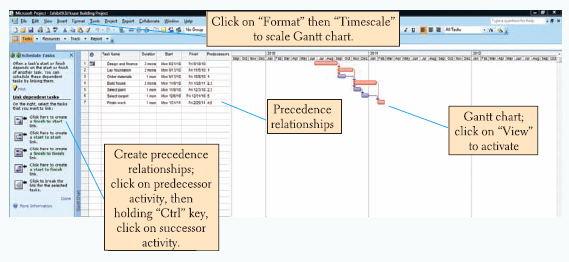
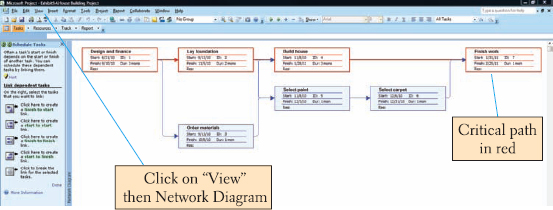
Exhibit 9.3 also shows the completed Gantt chart for our network. The Gantt chart is accessed by clicking on the "View" button on the toolbar at the top of the screen and then clicking on the "Gantt Chart." You may also need to alter the time frame to get all of the Gantt chart on your screen as shown in Exhibit 9.3. This can be accomplished by clicking on the "Format" button on the toolbar and then clicking on the "Timescale" option. This results in a window from which you can adjust the timescale from "days" as shown in Exhibit 9.2 to "months" as shown in Exhibit 9.3. Notice in Exhibit 9.3 that the critical path is highlighted in red. You can show the critical path by again clicking on "Format" on the toolbar and then activating the "Gantt Chart Wizard," which allows you to highlight the critical path, among other options.
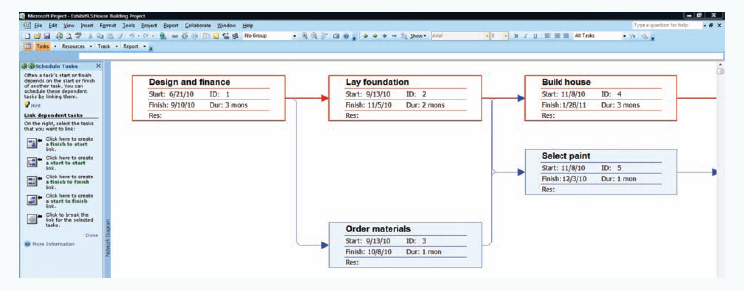
To see the project network, click on the "View" button again on the toolbar and then click on "Network Diagram." Exhibit 9.4 shows the project network with the critical path highlighted in red. Exhibit 9.5 shows the project network "nodes" using the "Zoom" option from the "View" menu to increase the network size. Notice that each node includes the start and finish dates and the activity number.
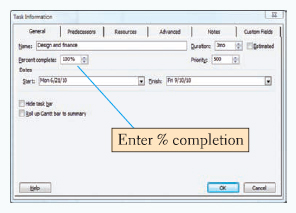
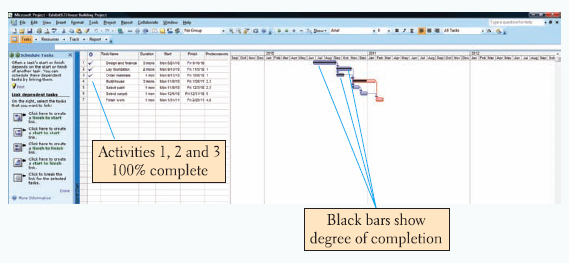
Microsoft Project has many additional tools and features for project updating and resource management. As an example, we will demonstrate one feature that updates the project schedule. First we double click on the first task, "Design and finance," resulting in the window labeled "Task Information" shown in Exhibit 9.6. On the "General" tab screen we have entered 100% in the "Percent complete" window, meaning this activity has been completed. We will also indicate that activities 2 and 3 have been completed while activity 4 is 60% complete and activity 5 is 20% complete. The resulting screen is shown in Exhibit 9.7. Notice that the dark lines through the Gantt chart bars indicates the degree of completion.
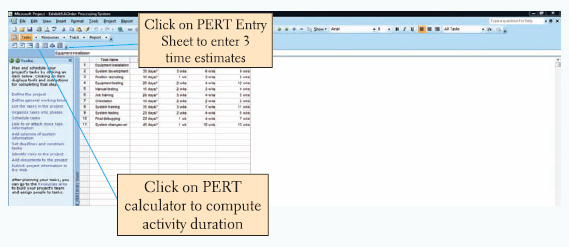
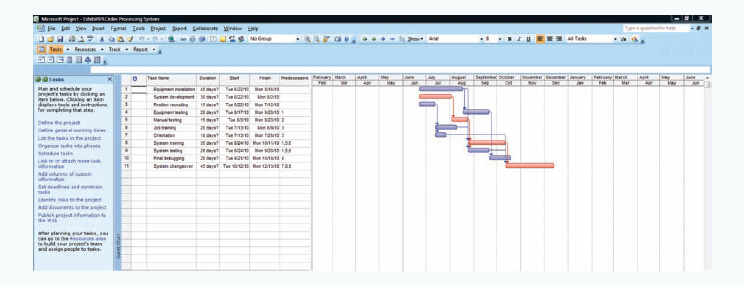
A PERT network with three time estimates can also be developed using Microsoft Project. We will demonstrate this capability using our "Order Processing System" project from Example 9.1. After all of the project tasks are listed, then the three activity time estimates are entered by clicking on the "PERT Entry Sheet" button on the toolbar. If this button is not on your toolbar, you must add it in by clicking on "View" and then from the Toolbars options select "PERT Analysis." Exhibit 9.8 shows the PERT time estimate entries for the activities in our order processing system project example. Exhibit 9.9 shows the estimated activity durations based on the three time estimates for each activity, the precedence relationships, and the project Gantt chart. Exhibit 9.10 shows the project network.
ALONG THE SUPPLY CHAIN
The Corps of Engineers Hurricane Katrina New Orleans Restoration Project
Although category 3 Hurricane Katrina veered east of New Orleans and the city avoided a direct hit on August 29, 2005, the resulting rising floodwaters from the Mississippi River crushed the city's levees and floodwalls, causing the flood protection system to fail at more than 50 places and submerging 80% of the city. Almost 2,000 people lost their lives and damage estimates totaled well over $100 billion, making it arguably the largest natural disaster in the history of the United States Less than a month later Hurricane Rita, the third-largest storm in U.S. history, hit the same Gulf coast area.
It was the responsibility of the United States Army Corps of Engineers to help the city recover and restore the flood protection system in a very short period of time. The project task list included pumping or draining 250 billion gallons of water from New Orleans; removing about 28 million cubic yards of debris from the city and Gulf Coast; and repairing and restoring 220 miles of levees and floodwalls to at least pre-Katrina levels. The project team was also charged with rebuilding floodgates, upgrading the hurricane protection system in New Orleans, and restoring navigation along the Mississippi River. Draining floodwater was a priority since it was essential for public health; the original estimate was that it would take six months but it was accomplished in 45 days. At the same time Army helicopter crews working around the clock dropped an average of 600 sandbags weighing 7,000 pounds every day for 10 days and closed the system's breaches only two weeks after the hurricane hit. Meanwhile debris was removed, water distributed (including 170 million pounds of ice), power restored, over 81,000 temporary roofs were installed, 80,000 trees were removed, and, 7,100 structures were demolished. The levees were rebuilt with erosion-resistant clay and a more stable floodwall formation by mid-January 2006, well before the target date of June 1, the start of the next hurricane season. The project team accomplished what might normally have taken a decade in eight months. The project cost $3.7 billion in Louisiana alone, and more than 10,000 workers were involved with the project including 8,000 Corps of Engineers employees and team members from as far away as the Netherlands, Germany, Korea, and Japan. Despite public criticism of the Federal Emergency Management Agency (FEMA), the city's preparedness, and the government's handling of various recovery and citizen relocation efforts, the Corps of Engineer's restoration project immediately following the hurricane was a success by any measure.
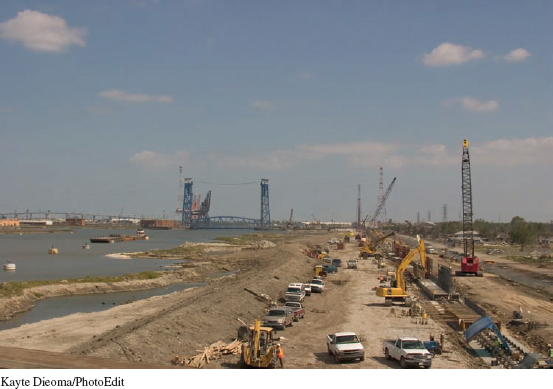
The construction project to restore the levees along the Mississippi River in New Orleans after Hurricane Katrina was accomplished well before the target date with the aid of project management techniques.
Source: Deborah Silver, "A City in Ruins," PM Network, vol. 23 (5: May 2009), pp. 46–52.
The project manager is frequently confronted with having to reduce the scheduled completion time of a project to meet a deadline. In other words, the manager must finish the project sooner than indicated by the CPM/PERT network analysis. Project duration can often be reduced by assigning more labor to project activities, in the form of overtime, and by assigning more re-sources (material, equipment, and so on). However, additional labor and resources increase the project cost. Thus, the decision to reduce the project duration must be based on an analysis of the tradeoff between time and cost. Project crashing is a method for shortening the project duration by reducing the time of one (or more) of the critical project activities to less than its normal activity time is referred to as crashing. Crashing is achieved by devoting more resources, usually measured in terms of dollars, to the activities to be crashed.
•Crashing: reducing project time by expending additional resources.
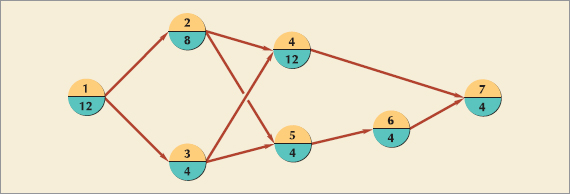
To demonstrate how project crashing works, we will employ the CPM/PERT network for constructing a house in Figure 9.8. This network is repeated in Figure 9.15, except that the activity times previously shown as months have been converted to weeks. Although this sample network encompasses only single-activity time estimates, the project crashing procedure can be applied in the same manner to PERT networks with probabilistic activity time estimates.
We will assume that the times (in weeks) shown on the network activities are the normal activity times. For example, 12 weeks are normally required to complete activity 1. Furthermore, we will assume that the cost required to complete this activity in the time indicated is $3000. This cost is referred to as the normal activity cost. Next, we will assume that the building contractor has estimated that activity 1 can be completed in seven weeks, but it will cost $5000 instead of $3000 to complete the activity. This new estimated activity time is known as the crash time, and the cost to achieve the crash time is referred to as the crash cost.
•Crash time: an amount of time an activity is reduced.
Activity 1 can be crashed a total of five weeks (normal time – crash time = 12 – 7 = 5 weeks) at a total crash cost of $2000 (crash cost – normal cost = $5000 – 3000 = $2000). Dividing the total crash cost by the total allowable crash time yields the crash cost per week:
•Crash cost: is the cost of reducing activity time.
If we assume that the relationship between crash cost and crash time is linear, then activity 1 can be crashed by any amount of time (not exceeding the maximum allowable crash time) at a rate of $400 per week. For example, if the contractor decided to crash activity 1–2 by only two weeks (reducing activity time to 10 weeks), the crash cost would be $800 ($400 per week × 2 weeks). The linear relationships between crash cost and crash time and between normal cost and normal time are illustrated in Figure 9.16.
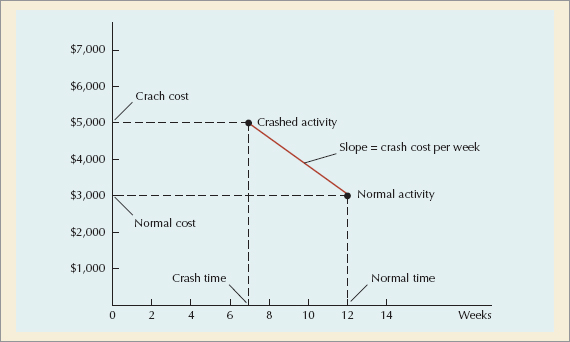
The objective of project crashing is to reduce project duration while minimizing the cost of crashing. Since the project completion time can be shortened only by crashing activities on the critical path, it may turn out that not all activities have to be crashed. However, as activities are crashed, the critical path may change, requiring crashing of previously noncritical activities to reduce the project completion time even further.
The goal of crashing is to reduce project duration at minimum cost.
Project Crashing
Recall that the critical path for the house building network in Figure 9.15 encompassed activities 1–2–7 and the project duration was nine months, or 36 weeks. Suppose the home builder needed the house in 30 weeks and wanted to know how much extra cost would be incurred to complete the house by this time.
The normal times and costs, the crash times and costs, the total allowable crash times, and the crash cost per week for each activity in the network in Figure 9.15 are summarized in the following table:
Normal Activity and Crash Data
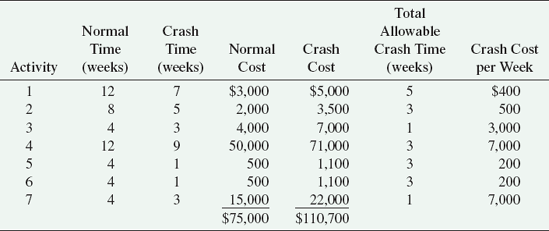
Solution
We start by looking at the critical path and seeing which activity has the minimum crash cost per week. Observing the preceding table and the figure below, we see activity 1 has the minimum crash cost of $400. Activity 1 will be reduced as much as possible. The table shows that the maximum allowable reduction for activity 1 is five weeks, but we can reduce activity 1 only to the point at which another path becomes critical. When two paths simultaneously become critical, activities on both must be reduced by the same amount. If we reduce the activity time beyond the point at which another path becomes critical, we may be incurring an unnecessary cost. This last stipulation means that we must keep up with all the network paths as we reduce individual activities, a condition that makes manual crashing very cumbersome. For that reason the computer is generally required for project crashing; however, we will solve this example manually in order to demonstrate the logic of project crashing.
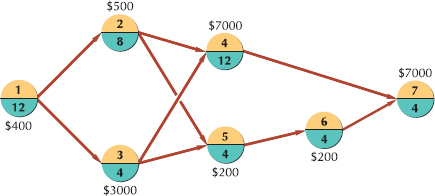
It turns out that activity 1 can be crashed by the total amount of five weeks without another path becoming critical, since activity 1 is included in all four paths in the network. Crashing this activity results in a revised project duration of 31 weeks at a crashing cost of $2000. The revised network is shown in the following figure.

Since we have not reached our crashing goal of 30 weeks, we must continue, and the process is repeated. The critical path in the preceding figure remains the same, and the minimum activity crash cost on the critical path is $500 for activity 2. Activity 2 can be crashed a total of three weeks, but since the contractor desires to crash the network only to 30 weeks, we need to crash activity 2 by only one week. Crashing activity 2 by one week does not result in any other path becoming critical, so we can safely make this reduction. Crashing activity 2 to seven weeks (i.e., a one-week reduction) costs $500 and reduces the project duration to 30 weeks.
The total cost of crashing the project to 30 weeks is $2500. The contractor could inform the customer that an additional cost of only $2500 would be incurred to finish the house in 30 weeks.
Suppose we wanted to continue to crash this network, reducing the project duration down to the minimum time possible—that is, crashing the network the maximum amount possible. We can determine how much the network can be crashed by crashing each activity the maximum amount possible and then determining the critical path of this completely crashed network. For example, activity 1 is seven weeks, activity 2 is five weeks, 3 is three weeks, and so on. The critical path of this totally crashed network is 1–2–4–6–7, with a project duration of 24 weeks. This is the least amount of time in which the project can be completed. If we crashed all the activities by their maximum amount, the total crashing cost would be $35,700, computed by subtracting the total normal cost of $75,000 from the total crash cost of $110,700 in the preceding table. However, if we followed the crashing procedure outlined in this example, the network could be crashed to 24 weeks at a cost of $31,500, a savings of $4000.
In our discussion of project crashing, we demonstrated how the project critical path time could be reduced by increasing expenditures for labor and other direct resources. The objective of crashing was to reduce the scheduled completion time to reap the results of the project sooner. However, there may be other reasons for reducing project time. As projects continue over time, they consume indirect costs, including the cost of facilities, equipment, and machinery, interest on investment, utilities, labor, personnel costs, and the loss of skills and labor from members of the project team who are not working at their regular jobs. There also may be direct financial penalties for not completing a project on time. For example, many construction contracts and government contracts have penalty clauses for exceeding the project completion date.
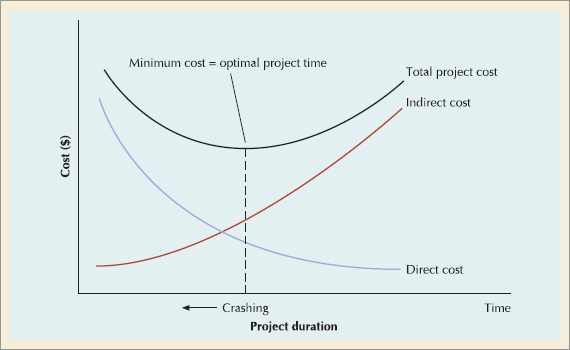
In general, project crashing costs and indirect costs have an inverse relationship; crashing costs are highest when the project is shortened, whereas indirect costs increase as the project duration increases. This time–cost relationship is illustrated in Figure 9.17. The best, or optimal, project time is at the minimum point on the total cost curve.
Since the development of CPM/PERT in the 1950s, it has been applied in a variety of government agencies concerned with project control, including military agencies, NASA, the Federal Aviation Agency (FAA), and the General Services Administration (GSA). These agencies are frequently involved in largescale projects involving millions of dollars and many subcontractors. Examples of such governmental projects include the development of weapons systems, aircraft, and such NASA space-exploration projects as the space shuttle. It has become common for these agencies to require subcontractors to develop and use a CPM/PERT analysis to maintain management control of the myriad project components and subprojects.
CPM/PERT has also been widely applied in the private sector. Two of the areas of application of CPM/PERT in the private sector have been research and development (R&D) and construction. CPM/PERT has been applied to R&D projects, such as developing new drugs, planning and introducing new products, and developing new and more powerful computer systems. CPM/PERT analysis has been particularly applicable to construction projects. Almost every type of construction project—from building a house to constructing a major sports stadium, to building a ship, to constructing the Alaska oil pipeline—has been the subject of network analysis.
One reason for this popularity is that a network analysis provides a visual display of the project that is easy for managers and staff to understand and interpret. It is a powerful tool for identifying and organizing the activities in a project and controlling the project schedule. However, beyond that it provides an effective focal point for organizing the efforts of management and the project team.
Currently, hundreds of project management software packages are commercially available for personal computers, ranging in cost from several hundred dollars to thousands of dollars.
CPM/PERT also has certain limitations. The project manager tends to rely so heavily on the project network that errors in the precedence relationship or missing activities can be overlooked, until a point in time where these omissions become a problem. Attention to critical path activities can become excessive to the extent that other project activities may be neglected, or they may be delayed to the point that other paths become critical. Obtaining accurate single-time estimates and even three probabilistic time estimates is difficult and subject to a great deal of uncertainty. Since persons directly associated with the project activity within the organization are typically the primary source for time estimates, they may be overly pessimistic if they have a vested interest in the scheduling process or overly optimistic if they do not. Personal interests aside, it is frequently difficult to define, within the context of an activity, what an optimistic or pessimistic time means. Nevertheless, such reservations have not diminished the popularity of CPM/PERT because most people feel its usefulness far outweighs any speculative or theoretical drawbacks.
Earliest Start and Finish Times
ES = max (EF of immediately preceding activities)
EF = ES + t
Latest Start and Finish Times
LS = LF – t
LF = min (LS of immediately following activities)
Activity Slack
S = LS – ES = LF – EF
Mean Activity Time and Variance
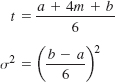
activity performance of an individual job or work effort that requires labor, resources, and time and is subject to manage-ment control.
activity-on-arrow (AOA) a convention for constructing a CPM/ PERT network in which the branches between nodes represent project activities.
activity-on-node (AON) a convention for constructing a CPM/PERT network in which the nodes represent project activities.
backward pass starting at the end of a CPM/PERT network, a procedure for determining latest activity times.
beta distribution a probability distribution traditionally used in CPM/PERT for estimating the mean and variance of project activity times.
crash cost the cost of reducing the normal activity time.
crash time the amount of time an activity is reduced.
crashing a method for shortening the project duration by reducing the time of one or more critical activities at a cost.
critical path the longest path through a CPM/PERT network, indicating the minimum time in which a project can be completed.
dummy an activity in a network that shows a precedence relationship but represents no passage of time.
earliest finish time (EF) the earliest time an activity can be completed.
earliest start time (ES) the earliest time an activity can begin subject to preceding activities.
earned value analysis (EVA) a standard procedure for measuring a project's progress, forecasting its completion time and cost, and measuring schedule and budget variation.
event the completion or beginning of an activity in a project.
forward pass starting at the beginning of a CPM/PERT network, a procedure for determining earliest activity times.
Gantt chart a graphical display using bars (or time lines) to show the duration of project activities and precedence relationships.
latest finish time (LF) the latest time an activity can be completed and still maintain the project critical path time.
latest start time (LS) the latest time an activity can begin and not delay subsequent activities.
matrix organization an organizational structure of project teams that includes members from various functional areas in the company.
most likely time (m) the subjective estimate of the time that would occur most frequently if the activity were repeated many times.
optimistic time (a) the shortest possible time to complete the activity if everything went right.
organizational breakdown structure (OBS) a chart that shows which organizational units are responsible for work items.
pessimistic time (b) the longest possible time to complete the activity given that everything went wrong.
precedence relationship the sequential relationship of project activities to each other.
project a unique, one-time operation or effort.
responsibility assignment matrix (RAM) shows who in the organization is responsible for doing the work in the project.
scope statement a document that provides an understanding, justification and expected result for the project.
slack the amount by which an activity can be delayed without delaying any of the activities that follow it or the project as a whole.
statement of work a written description of the objectives of a project.
work breakdown structure (WBS) a method for subdividing a project into different hierarchical levels of components.
CPM/PERT NETWORK ANALYSIS
Given the following network and activity time estimates, determine earliest and latest activity times, slack, the expected project completion time and variance, and the probability that the project will be completed in 28 days or less.
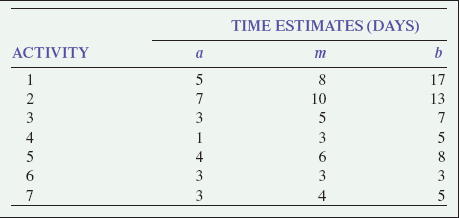
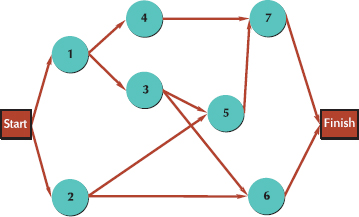
SOLUTION
Step 1. Compute the expected activity times and variances:
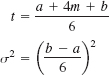
For example, the expected time and variance for activity 1 are
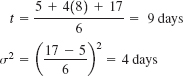
These values and the remaining expected times and variances for each activity are shown in the following table:
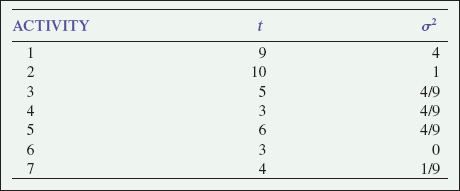
Step 2. Determine the earliest and latest activity times and activity slack:
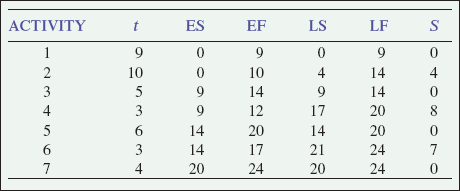
As an example, the earliest start and finish times for activity 1 are
ES = max (EF immediate predecessors)
= 0
EF = ES + t
= 0 + 9
= 9
The latest start and finish times for activity 7 are
LF = min (LS following activities)
= 24
LS = LF – t
= 24 – 4
= 20
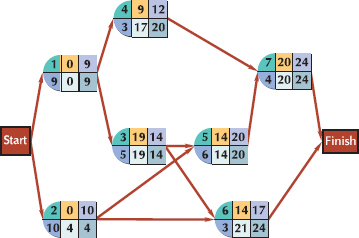
Step 3. Identify the critical path and compute expected project completion time and variance. Observing the preceding table and those activities with no slack (i.e., s = 0), we can identify the critical path as 1–3–5–7. The expected project completion time (tp) is 24 days. The variance is computed by summing the variances for the activities in the critical path:
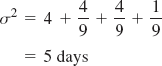
Step 4. Determine the probability that the project will be completed in 28 days or less. The following normal probability distribution describes the probability analysis.
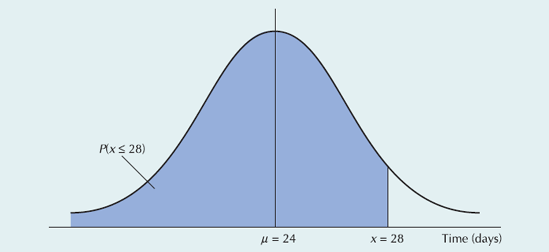
Compute Z using the following formula:
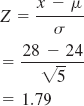
The corresponding probability from the normal table in Appendix A is 0.4633; thus,
9-1. Why is CPM/PERT a popular and widely applied project scheduling technique?
9-2. What is the purpose of a CPM/PERT network?
9-3. Why are dummy activities used in a CPM/PERT network?
9-4. What is the critical path, and what is its importance in project planning?
9-5. What is slack, and how is it computed?
9-6. How are the mean activity times and activity variances computed in probabilistic CPM/PERT analysis?
9-7. How is total project variance determined in CPM/PERT analysis?
9-8. What is the purpose of project crashing analysis?
9-9. Describe the process of manually crashing a project network.
9-10. Which method for determining activity time estimates, deterministic or probabilistic, do you perceive to be preferable? Explain.
9-11. Explain how a Gantt chart differs from a CPM/PERT network, and indicate the advantage of the latter.
9-12. Discuss the relationship of direct and indirect costs in project management.
9-13. Describe the limitations and disadvantages of CPM/PERT.
9-14. Describe the difference between activity-on-node and activity-on-arrow project networks.
9-15. Identify and briefly describe the major elements of project management.
9-16. Select an everyday "project" you are familiar with such as a class project, preparing a meal, making a pizza, repairing your car. Develop a list of the activities, a CPM/PERT network (with time estimates), and a work breakdown schedule for the project.
9-17. Prepare a WBS for a spaghetti with meatballs dinner that includes a Caesar salad, a loaf of Italian bread, and wine. (Include the different components of the dinner at the upper level and the various detailed work activities required by each component at the lower level.)
9-18. Write a paper summarizing an actual project reported on in the magazine PM Network.
9-19. Describe and discuss the cultural differences between the United States and a country of your choice that might affect the management of a project in this foreign country.
9-1. Construct a Gantt chart for the project described by the following set of activities, and indicate the project completion time:
Activity | Activity Predecessor | Time (weeks) |
|---|---|---|
1 | − | 5 |
2 | − | 4 |
3 | 1 | 3 |
4 | 2 | 6 |
9-2. Construct a Gantt chart for the project described by the following set of activities, and indicate the project completion time and the available slack for each activity:
Activity | Activity Predecessor | Time (weeks) |
|---|---|---|
1 | − | 3 |
2 | − | 7 |
3 | 1 | 2 |
4 | 2 | 5 |
5 | 2 | 6 |
6 | 4 | 1 |
7 | 5 | 4 |
9-3. Use the project activities that follow to determine the following:
Construct a Gantt chart; indicate the project completion time and slack for each activity.
Construct the CPM/PERT network, compute the length of each path in the network, and indicate the critical path.
Activity | Activity Predecessor | Time (weeks) |
|---|---|---|
1 | − | 4 |
2 | − | 7 |
3 | 1 | 8 |
4 | 1 | 3 |
5 | 2 | 9 |
6 | 3 | 5 |
7 | 3 | 2 |
8 | 4, 5, 6 | 6 |
9 | 2 | 5 |
9-4. Construct a network from the information in the following table and identify all the paths in the network, compute the length of each, and indicate the critical path.
Activity | Activity Predecessor | Time (weeks) |
|---|---|---|
1 | − | 7 |
2 | − | 10 |
3 | 1 | 6 |
4 | 2 | 5 |
5 | 2 | 4 |
6 | 3, 4 | 3 |
7 | 5, 6 | 2 |
9-5. For the network in Problem 9-4, determine the earliest start and finish times, latest start and finish times, and slack for each activity. Indicate how the critical path would be determined from this information.
9-6. Given the following network with activity times in months, determine the earliest start and finish times, latest start and finish times, and slack for each activity. Indicate the critical path and the project duration.
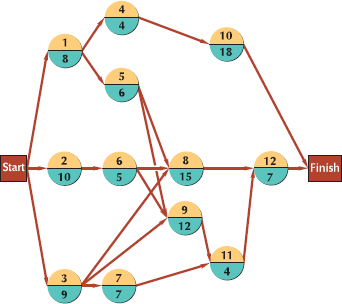
9-7. Given the following network with activity times in weeks, determine the earliest start and finish times, latest start and finish times, and slack for each activity. Indicate the critical path and the project duration.
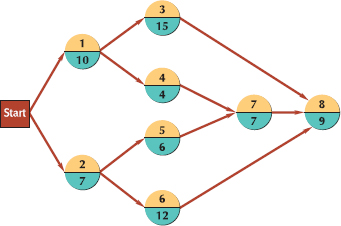
9-8. A marketing firm is planning to conduct a survey of a segment of the potential product audience for one of its customers. The planning process for preparing to conduct the survey consists of six activities with procedure relationships and activity time estimates as follows:
Activity | Description | Activity Predecessor | Time Estimates (days) |
|---|---|---|---|
a | Determine survey objectives | − | 3 |
b | Select and hire personnel | a | 3 |
c | Design questionnaire | a | 5 |
d | Train personnel | b, c | 4 |
e | Select target audience | c | 3 |
f | Make personnel assignments | d, e | 2 |
Determine all paths through the network from node a to node f and the duration of each, and indicate the critical path.
Determine the earliest and latest activity start and finish times.
Determine the slack for each activity.
9-9. In one of the little-known battles of the Civil War, General Tecumseh Beauregard lost the Third Battle of Bull Run because his preparations were not complete when the enemy attacked. If the critical path method had been available, the general could have planned better. Suppose that the project network in the opposite column above with activity times in days had been available. Determine the earliest start and finish times, latest start and finish times, and activity slack for the network. Indicate the critical path and the time between the general's receipt of battle orders and the onset of battle.
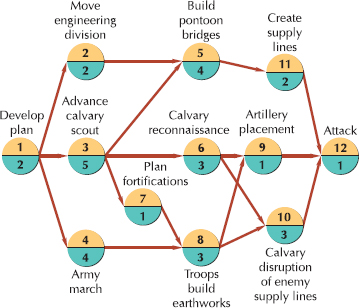
9-10. A group of developers is building a new shopping center. A consultant for the developers has constructed the CPM/PERT network below and assigned activity times in weeks. Determine the earliest start and finish times, latest start and finish times, activity slack, critical path, and duration for the project.
9-11. The management of a factory is going to erect a maintenance building with a connecting electrical generator and water tank. The activities, activity descriptions, and estimated durations are given in the following table:
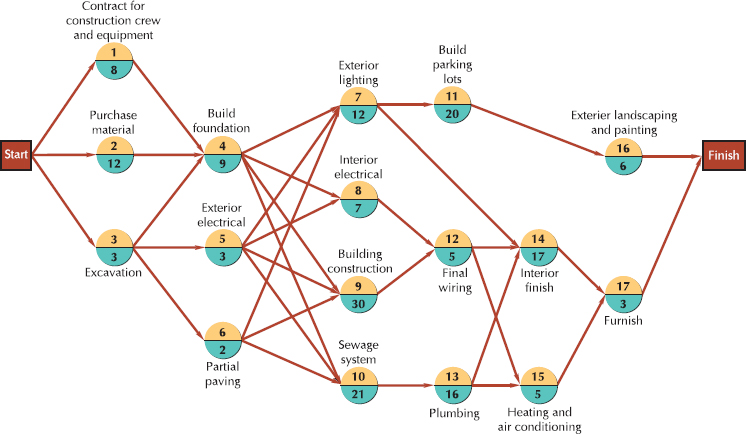
Activity | Description | Activity Predecessor | Activity Duration (weeks) |
|---|---|---|---|
a | Excavate | — | 2 |
b | Erect building | a | 6 |
c | Intstall generator | a | 4 |
d | Install tank | a | 2 |
e | Install maintenance equipment | b | 4 |
f | Connect generator and tank to building | b, c, d | 5 |
g | Paint on a finish | b | 3 |
h | Check out facility | e, f | 2 |
Construct the network for this project, identify the critical path, and determine the project duration time.
9-12. Given the following network and probabilistic activity time estimates, determine the expected time and variance for each activity and indicate the critical path:
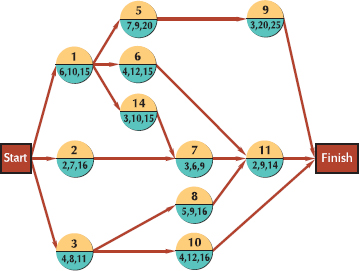
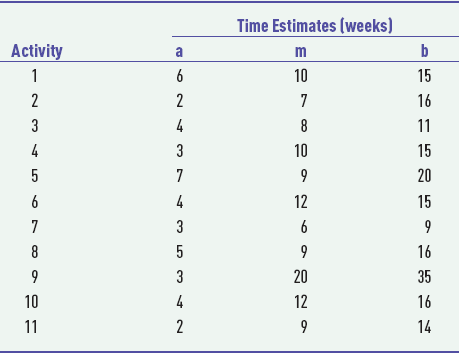
9-13. The Farmer's American Bank of Leesburg is planning to install a new computerized accounts system. Bank management has determined the activities required to complete the project, the precedence relationships of the activities, and activity time estimates as follows:
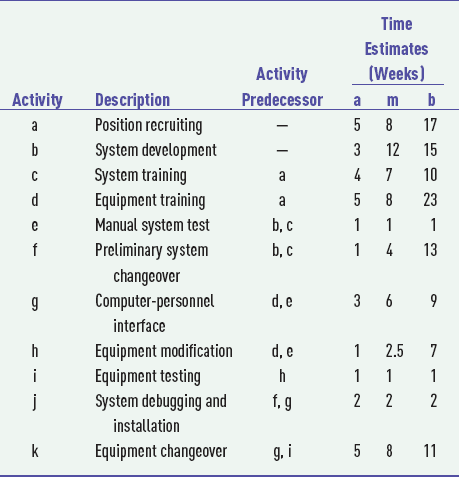
Determine the earliest and latest activity times, the expected completion time and standard deviation, and the probability that the project will be completed in 40 weeks or less.
9-14. The following probabilistic activity time estimates are for the network in Problem 9-6:
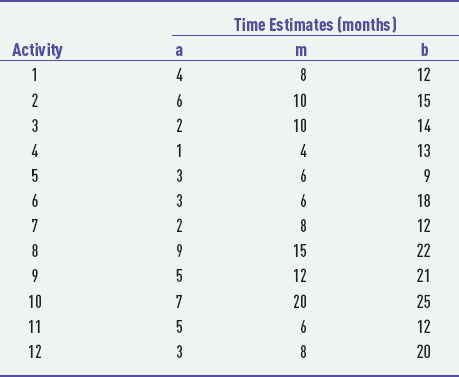
Determine the following:
Expected activity times
Earliest start and finish times
Latest start and finish times
Activity slack
Critical path
Expected project duration and standard deviation
9-15. The following probabilistic activity time estimates are for the CPM/PERT network in Problem 9-9:
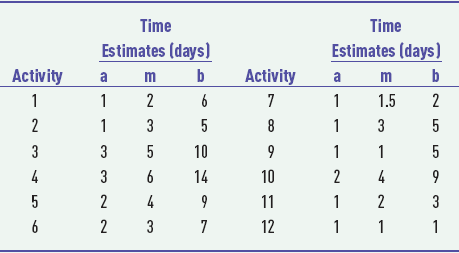
Determine the following:
Expected activity times
Earliest start and finish times
Latest start and finish times
Activity slack
Critical path
Expected project duration and standard deviation
9-16. For the CPM/PERT network in Problem 9-14, determine the probability that the network duration will exceed 50 months.
9-17. The Stone River Textile Mill was inspected by OSHA and found to be in violation of a number of safety regulations. The OSHA inspectors ordered the mill to alter some existing machinery to make it safer (e.g., add safety guards); purchase some new machinery to replace older, dangerous machinery; and relocate some machinery to make safer passages and unobstructed entrances and exits. OSHA gave the mill only 35 weeks to make the changes; if the changes were not made by then, the mill would be fined $300,000. The mill determined the activities in a PERT network that would have to be completed and then estimated the indicated activity times, as shown in the table below. Construct the PERT network for this project and determine the following:
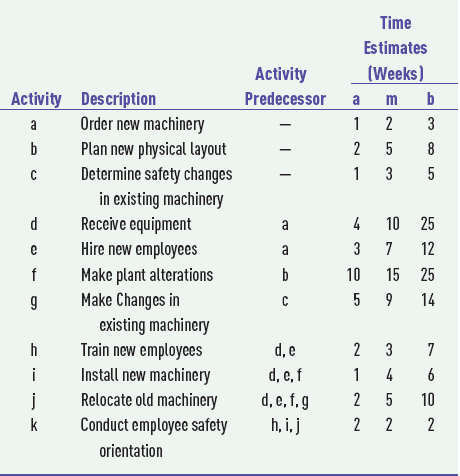
Expected activity times
Earliest and latest activity times and activity slack
Critical path
Expected project duration and variance
The probability that the mill will be fined $300,000
9-18. In the Third Battle of Bull Run, for which a CPM/PERT network was developed in Problem 9-15, General Beauregard would have won if his preparations had been completed in 15 days. What would the probability of General Beauregard's winning the battle have been?
9-19. On May 21, 1927, Charles Lindbergh landed at Le Bourget Field in Paris, completing his famous transatlantic solo flight. The preparation period prior to his flight was quite hectic and time was critical, since several other famous pilots of the day were also planning transatlantic flights. Once Ryan Aircraft was contracted to build the Spirit of St. Louis, it took only a little over 2 1/2 months to construct the plane and fly it to New York for the takeoff. If CPM/PERT had been available to Charles Lindbergh, it no doubt would have been useful in helping him plan this project. Use your imagination and assume that a CPM/PERT network, as shown in the figure at the top of the following page, with the following estimated activity times, was developed for the flight.
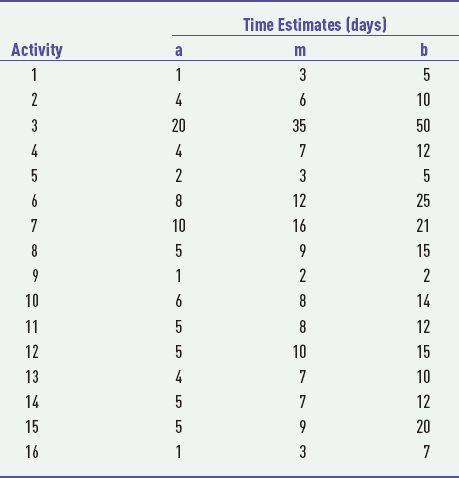
Determine the expected project duration and variance and the probability of completing the project in 67 days.
9-20. RusTech Tooling, Inc., is a large job shop operation that builds machine tools and dies to manufacture parts for specialized items. The company bids primarily on contracts for government-related activities to produce parts for things such as military aircraft, weapons systems, and the space program. The company is bidding on a contract to produce a component part for the fuselage assembly in a new space shuttle. A major criterion for selecting the winning bid besides low cost is the time required to produce the part. However, if the company is awarded the contract it will be held strictly to the completion date specified in the bid, and any delays will result in severe financial penalties. In order to determine the project completion time to put in its bid, the company has identified the project activities, precedence relationships, and activity times shown in the following table:
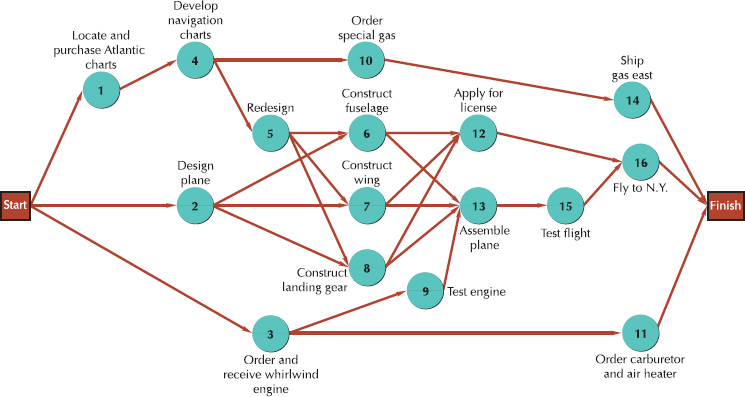
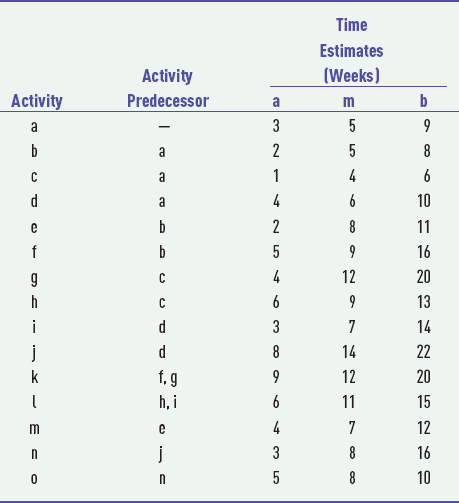
If RusTech, Inc., wants to be 90% certain that it can deliver the part without incurring a penalty, what time frame should it specify in the bid?
9-21. PM Computers is an international manufacturer of computer equipment and software. It is going to introduce a number of new products in the coming year, and it wants to develop marketing programs to accompany the product introductions. The marketing program includes the preparation of printed materials distributed directly by the company and used by the company's marketing personnel, vendors, and representatives; print advertising in regular magazines, trade journals, and newspapers; and television commercials. The program also includes extensive training programs for marketing personnel, vendors, and representatives about the new products. A project management team with members from the marketing department and manufacturing areas has developed the following list of activities for the development of the marketing program:
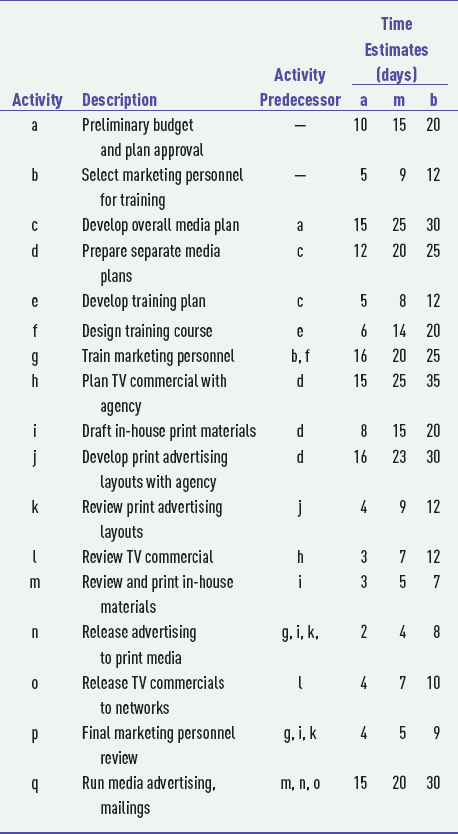
Construct the network for this project and determine the activity schedule. Identify the critical path and determine the expected project duration time and variance. What is the probability the program can be completed within four months?
9-22. The following table provides the information necessary to construct a project network and project crash data:
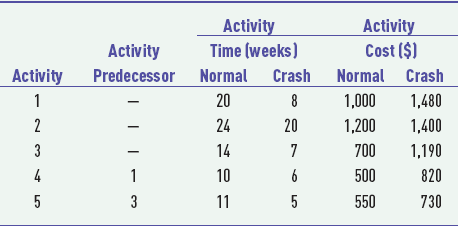
Construct the project network.
Determine the maximum possible crash time for the network, and crash the network the maximum amount possible.
Compute the normal project cost and the cost of the crashed project.
9-23. The following table provides the information necessary to construct a project network and project crash data:
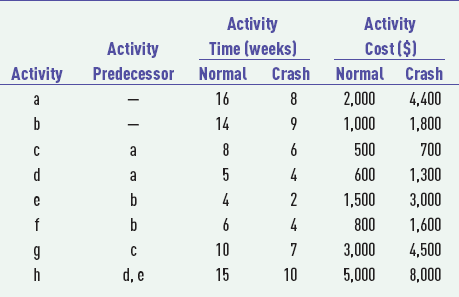
Construct the project network, and crash the network the maximum amount possible.
9-24. For the Solved Problem at the end of this chapter, assume that the most likely times (m) are the normal activity times and the optimistic times (a) are the activity crash times. Further assume that the activities have the following normal and crash costs:
Activity | Costs (Normal Cost, Crash Cost) |
|---|---|
1 | ($100, 400) |
2 | ($250, 400) |
3 | ($400, 800) |
4 | ($200, 400) |
5 | ($150, 300) |
6 | ($100, 100) |
7 | ($300, 500) |
Crash the network the maximum amount possible and indicate the total crash cost.
9-25. The following table provides the crash data for the project network in Problem 9-13. The normal activity times are considered to be deterministic and not probabilistic.
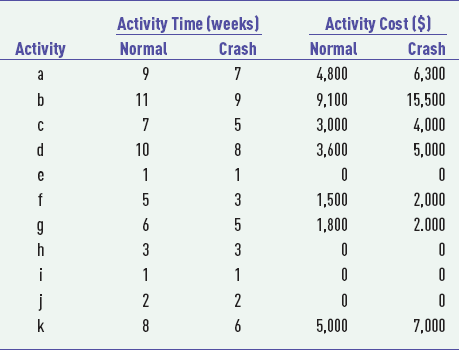
Crash the network the maximum amount, indicate how much it would cost the bank, and identify the new critical path(s).
9-26. The Center for Information Technology at State University has outgrown its office in Bates (B) Hall and is moving to Allen (A) Hall, which has more space. The move will take place during the three-week break between the end of summer semester and the beginning of fall semester. Movers will be hired from the university's physical plant to move the furniture, boxes of books, and files that the faculty will pack. The center has hired a local retail computer firm to move its office computers so they will not be damaged. Following is a list of activities, their precedence relationships, and probabilistic time estimates for this project:
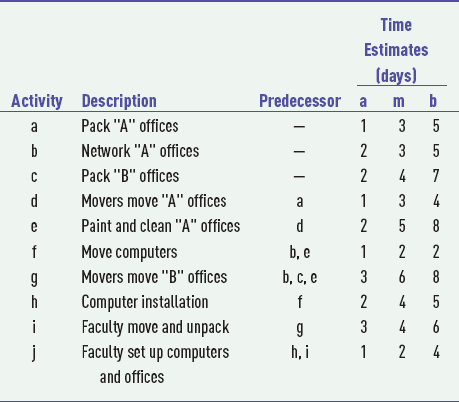
Determine the earliest and latest start and finish times, the critical path, and the expected project duration. What is the probability the center will complete its move before the start of the fall semester?
9-27. The Valley United Soccer Club is planning a soccer tournament for the weekend of April 29–30. The club's officers know that by March 30 they must send out acceptances to teams that have applied to enter and by April 15 they must send out the tournament game schedule to teams that have been selected to play. Their tentative plan is to begin the initial activities for tournament preparation including sending out the application forms to prospective teams, on January 20. Following is a list of tournament activities, their precedence relationships, and estimates of their duration in days. Develop a project network for the club's tournament preparation process and determine the likelihood that they will meet their schedule milestones and complete the process according to the scheduled tournament start date of April 29.
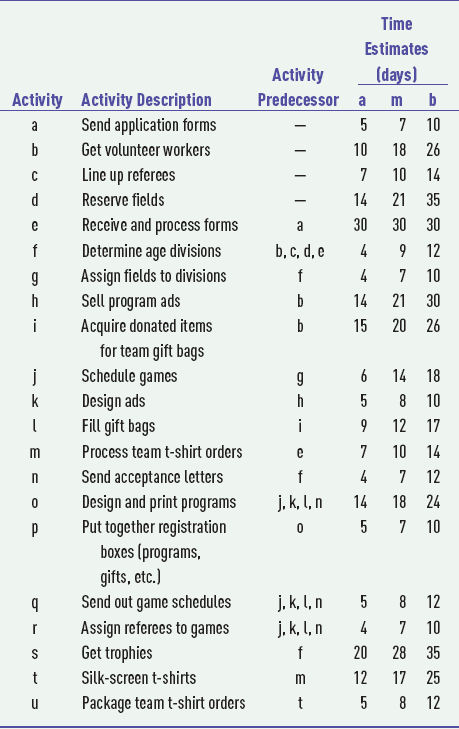
9-28. The Horizon Aircraft Company is preparing a contract proposal to submit to the Global Airlines Company for a new commercial aircraft, the JK60. Part of the proposal is a development and productions schedule for completion of the first aircraft. The project consists of three primary categories: (1) engine design and development; (2) development and production of the airframe (e.g., the aircraft body); and (3) the design and development of the aircraft avionics (e.g., the electronic systems, equipment, and other devices used to operate and control the aircraft). Following is a table listing the project activities with time estimates (in months).
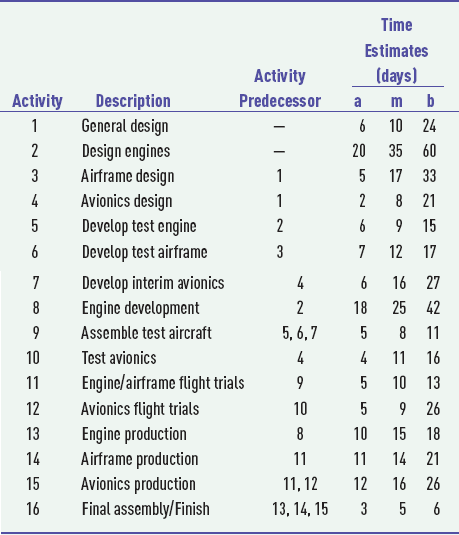
Develop the project network, and determine the critical path, the expected project duration, and variance. What is the probability the project will be completed within 8 years?
9-29. The Virginia Department of Transportation is undertaking a construction project to widen a large section of interstate, highway near Washington, DC, which includes the construction of a number of new bridges, interchanges, and overpasses. The first step in the project is the appointment of a project manger and the development of a project team, some of which will be departmental employees and others will be private consultants and operatives. The team for a project this size also requires a large support staff with varying technical skills. Once the team is selected and the staff is in place the first task is to select a primary contractor to manage and oversee the actual construction. The following activities are standard for the planning and scheduling of this process:
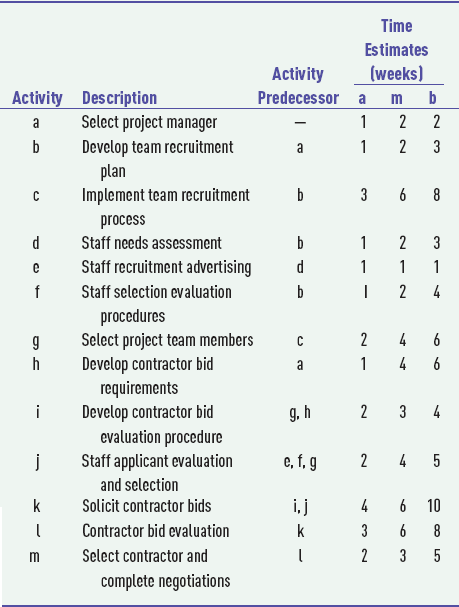
Construct the CPM/PERT network for this project and determine the project schedule. Identify the critical path and determine the expected project duration time and variance. Determine the probability that the team and contractor will be in place and the project started within six months; one year.
9-30. The Carriage Auto Parts Company near Nashville, Tennessee, is a direct supplier for the nearby Sigma auto manufacturing plant. In order to gain a competitive advantage and meet quality requirements by its customer, Carriage has undertaken a project to achieve ISO/TS 16949 registration. TS 16949 provides the requirements for the application of ISO 9001:2009 standards for automotive production and relevant service parts organizations. The goal of ISO/TS 16949 is the development of a quality management system that provides for continual improvement emphasizing defect prevention and the reduction of process variation and waste. (See Chapter 2 for a discussion of ISO certification). The project management team has developed the following list of required activities necessary to achieve ISO certification:
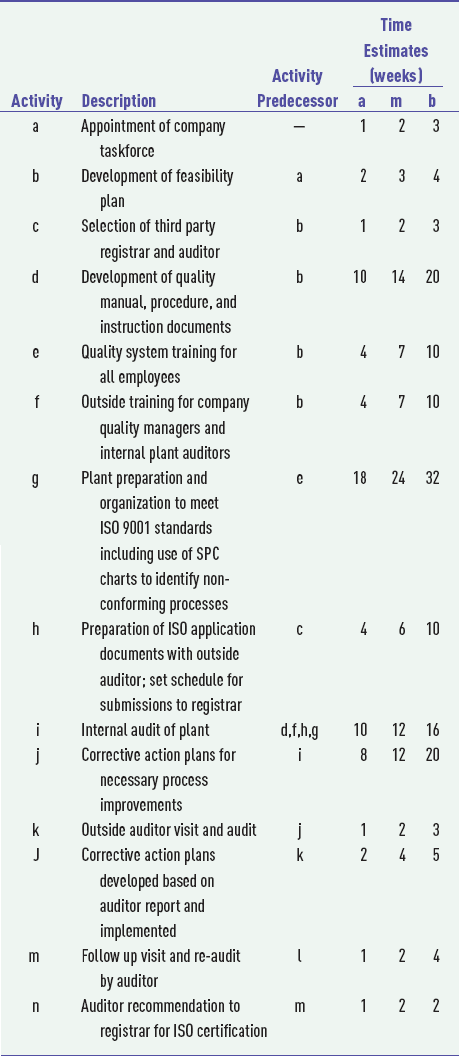
Construct the network for this project and determine the project schedule. Identify the critical path and determine the expected project duration time and variance. Determine the probability that the certification project can be completed with one year; 18 months.
9-31. During a violent thunderstorm with very high wind gusts in the third week of March, the broadcast tower for the public radio station, WVPR, atop Poor Mountain in Roanoke, Virginia, collapsed. This greatly reduced the strength of the station's signal in the area. The station management immediately began plans to construct a new tower. Following is a list of the required activities for building the new tower with most likely (m), optimistic (a), and pessimistic (b) time estimates (in days). However, the sequence of the activities has not been designated.
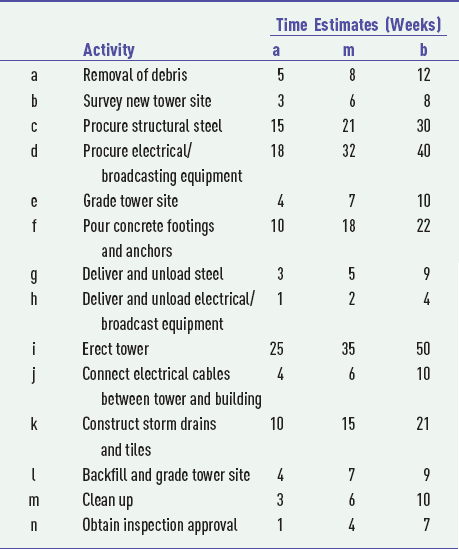
Using your best judgment, develop a CPM/PERT network for this project and determine the expected project completion time. Also determine the probability that the station signal will be back at full strength within three months.
9-32. The following table contains the activities for planning a wedding and the activity time estimates. However, the precedence relationships between activities are not included.
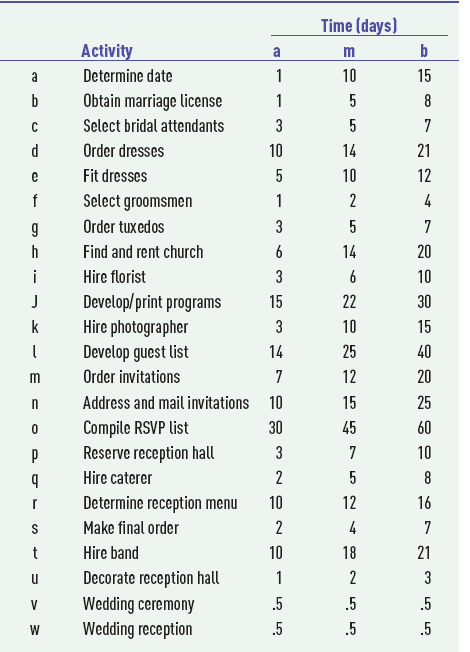
Using your best judgment, determine the project network, critical path, and expected project duration. If it is the first of January and a couple is planning a June 1 wedding, what is the probability that it can be done on time?
The Bloodless Coup Concert
John Aaron had just called the meeting of the Programs and Arts Committee of the Student Government Association to order.
"Okay, okay, everybody, quiet down. I have an important announcement to make," he shouted above the noise. The room got quiet and John started again. "Well, you guys, we can have the Coup."
His audience looked puzzled and Randy Jones asked, "What coup have we scored this time, John?"
"The Coup, the Coup! You know, the rock group, the Bloodless Coup!"
Everyone in the room cheered and started talking excitedly. John stood up, waved his arms, and shouted, "Hey, calm down, everybody, and listen up." The room quieted again and everyone focused on John. "The good news is that they can come." He paused a moment. "The bad news is that they will be here in 18 days."
The students groaned and seemed to share Jim Hasting's feelings, "No way, man. It can't be done. Why can't we put it off for a couple of weeks?"
John answered, "They're just starting their new tour and are looking for some warm-up concerts. They will be traveling near here for their first concert date in D.C. and saw they had a letter from us, so they said they could come now—but that's it, now or never." He looked around the room at the solemn faces. "Look you guys, we can handle this. Let's think of what we have to do. Come on, perk up. Let's make a list of everything we have to do to get ready and figure out how long it will take. So somebody tell me what we have to do first!"
Anna Mendoza shouted from the back of the room, "We have to find a place; you know, get an auditorium somewhere. I've done that before, and it should take anywhere from 2 days up to 7 days, most likely about 4 days."
"Okay, that's great," John said as he wrote down the activity "secure auditorium" on the blackboard with the times out to the side. "What's next?"
"We need to print tickets and quick," Tracey Shea blurted. "It could only take a day if the printer isn't busy, but it could take up to 4 days if it is. It should probably take about 2 days."
"But we can't print tickets until we know where the concert will be because of the security arrangement," Andy Taylor noted.
"Right," said John. "Get the auditorium first then print the tickets. What else?"
"We need to make hotel and transportation arrangements for the Coup and their entourage while they are here," Jim Hastings said. "But we better not do that until we get the auditorium. If we can't find a place for the concert, everything falls through."
"How long do you think it will take to make the arrangements?" John asked.
"Oh, between 3 and 10 days, probably about 5, most likely," Jim answered.
"We also have to negotiate with the local union for concert employees, stagehands, and whomever else we need to hire," said Reggie Wilkes. "That could take a day or up to 8 days, but 3 days would be my best guess."
"We should probably also hold off on talking to the union until we get the auditorium," John added. "That will probably be a factor in the negotiations."
"After we work things out with the union we can hire some stagehands," Reggie continued. "That could take as few as 2 days but as long as 7. I imagine it'll take about 4 days. We should also be able to get some student ushers at the same time once we get union approval. That could take only a day, but it has taken 5 days in the past; 3 days is probably the most likely."
"We need to arrange a press conference," said Art Cohen, leaning against a wall. "This is a heavy group, bigtime."
"But doesn't a press conference usually take place at the hotel?" John asked.
"Yeah, that's right," said Art. "We can't make arrangements for the press conference until we work things out with the hotel. When we do that it should take about 3 days to set up a press conference, 2 days if we're lucky and 4 at the most."
The room got quiet as everyone thought.
"What else?" John said.
"Hey, I know," said Annie Roark. "Once we hire the stagehands they have to set up the stage. I think that could be done in a couple of days, but it could take up to 6 days, with 3 most likely." She paused for a moment before adding, "And we can assign the ushers to their jobs once we hire them. That shouldn't take long, maybe only a day, 3 days worst. Probably 2 days would be a good time to put down."
"We also have to do some advertising and promotion if we want anyone to show for this thing," said Art nonchalantly. "I guess we need to wait until we print the tickets first so we'll have something to sell. That depends on the media, the paper, and radio stations. I've worked with this before. It could get done really quick, like 2 days, if we can make the right contacts, but it could take a lot longer, like 12 days if we hit any snags. We probably ought to count on 6 days as our best estimate."
"Hey, if we're going to promote this, shouldn't we also have a preliminary act, some other group?" said Annie.
"Wow, I forgot all about that," said John. "Hiring another act will take me between 4 and 8 days; I can probably do it in 5. I can start on that right away at the same time you guys are arranging for an auditorium." He thought for a moment. "But we really can't begin to work on the promotion until I get the lead-in group. So what's left?"
"Sell the tickets," shouted several people at once.
"Right," said John, "we have to wait until they are printed; but I don't think we have to wait for the advertising and promotion to start do we?"
"No," said Jim, "but we should hire the preliminary act first so people will know what they're buying a ticket for."
"Agreed," said John. "The tickets could go quick; I suppose in the first day."
"Or," interrupted Mike Eggleston, "it could take longer. I remember two years ago it took 12 days to sell out for the Cosmic Modem."
"Okay, so it's between 1 and 12 days to sell the tickets," said John, "but I think about 5 days is more likely. Everybody agree?"
The group nodded in unison and they all turned at once to the list of activities and times John had written on the blackboard.
Use PERT analysis to determine the probability the concert preparations will be completed in time.
Moore Housing Contractors
Moore Housing Contractors is negotiating a deal with Countryside Realtors to build six houses in a new development. Countryside wants Moore Contractors to start in late winter or early spring when the weather begins to moderate and build through the summer into the fall. The summer months are a busy time for the realty company, and it believes it can sell the houses almost as soon as they are ready—sometimes before. The houses all have similar floor plans and are of approximately equal size; only the exteriors are noticeably different. The completion time is so critical for Countryside Realtors that it is insisting a project management network accompany the contractor's bid for the job with an estimate of the completion time for a house. The realtor also needs to be able to plan its offerings and marketing for the summer. The realtor wants each house to be completed within 45 days after it is started. If a house is not completed within this time frame, the realtor wants to be able to charge the contractor a penalty. Mary and Sandy Moore, the president and vice president of Moore Housing Contractors, are concerned about the prospect of a penalty. They want to be confident they can meet the deadline for a house before entering into any agreement with a penalty involved. (If there is a reasonable likelihood they cannot finish a house within 45 days, they want to increase their bid to cover potential penalty charges.)
The Moores are experienced home builders, so it was not difficult for them to list the activities involved in building a house or to estimate activity times. However, they made their estimates conservatively and tended to increase their pessimistic estimates to compensate for the possibility of bad weather and variations in their workforce. Following is a list of the activities for building a house and the activity time estimates:
Activity | Description | Predecessor | Time (days) | ||
|---|---|---|---|---|---|
a | m | b | |||
a | Excavation, pour footers | — | 3 | 4 | 6 |
b | Lay foundation | a | 2 | 3 | 5 |
c | Frame and roof | b | 2 | 4 | 5 |
d | Lay drain tiles | b | 1 | 2 | 4 |
e | Sewer (floor) drains | b | 1 | 2 | 3 |
f | Install insulation | c | 2 | 4 | 5 |
g | Pour basement floor | e | 2 | 3 | 5 |
h | Rough plumbing, pipes | e | 2 | 4 | 7 |
i | Install windows | f | 1 | 3 | 4 |
j | Rough electrical wiring | f | 1 | 2 | 4 |
k | Install furnace, air conditioner | c, g | 3 | 5 | 8 |
l | Exterior brickwork | i | 5 | 6 | 10 |
m | Install, plasterboard, mud, plaster | j, h, k | 6 | 8 | 12 |
n | Roof shingles, flashing | l | 2 | 3 | 6 |
Activity | Description | Predecessor | Time (days) | ||
|---|---|---|---|---|---|
a | m | b | |||
o | Attach gutter, downspouts | n | 1 | 2 | 5 |
p | Grading | d, o | 2 | 3 | 7 |
q | Lay subflooring | m | 3 | 4 | 6 |
r | Lay driveway, walks, landscape | p | 4 | 6 | 10 |
s | Finish carpentry | q | 3 | 5 | 12 |
t | Kitchen cabinetry, sink, and appliances | q | 2 | 4 | 8 |
u | Bathroom cabinetry, fixtures | q | 2 | 3 | 6 |
v | Painting (interior and exterior) | t, u | 4 | 6 | 10 |
w | Finish wand floors, lay carpet | v, s | 2 | 5 | 8 |
x | Final electrical, light fixtures | v | 1 | 3 | 4 |
Develop a CPM/PERT network for Moore House Contractors and determine the probability that the contractors can complete a house within 45 days. Does it appear that the Moores might need to increase their bid to compensate for potential penalties?
Indicate which project activities Moore Contractors should be particularly diligent to keep on schedule by making sure workers and materials are always available. Also indicate which activities the company might shift workers from as the need arises.
Burman, P. J. Precedence Networks for Project Planning and Control. New York: McGraw-Hill, 1972.
Cleland, D. I., and W. R. King. Project Management Handbook. New York: Van Nostrand Reinhold, 1983.
Levy, F., G. Thompson, and J. Wiest. "The ABC's of the Critical Path Method." Harvard Business Review 41(5; October 1963).
Moder, J., C. R. Phillips, and E. W. Davis. Project Management with CPM and PERT and Precedence Diagramming, 3rd ed. New York: Van Nostrand Reinhold, 1983.
O'Brian, J. CPM in Construction Management. New York: McGraw-Hill, 1965.
Wiest, J. D., and F. K. Levy. A Management Guide to PERT/CPM, 2nd ed. Upper Saddle River, NJ: Prentice Hall, 1977.