
In this chapter, you will learn about. . .
Material Requirements Planning (MRP)
Capacity Requirements Planning (CRP)
Enterprise Resource Planning (ERP)
Customer Relationship Management (CRM)
Supply Chain Management (SCM)
Product Lifecycle Management (PLM)
Connectivity, Integration, and Services

Web resources for this chapter include
OM Tools Software
Internet Exercises
Online Practice Quizzes
Lecture Slides in PowerPoint
Virtual Tours
Excel Worksheets
Company and Resource Weblinks
www.wiley.com/college/russell
Resource Planning AT HERSHEY'S
In a now classic case of IT implementation gone wrong, Hershey's spent three years and $115 million working to replace its many legacy systems with one integrated enterprise resource planning (ERP) system from market leader SAP. Delays caused the system to go live during the busy fall season, in one fell swoop across the enterprise. Problems ensued in order processing and shipping such that Hershey's warehouses piled up with undelivered Kisses, Jolly Ranchers, and peanut butter cups, while store shelves were packed with competitor products. Hershey's missed the entire Halloween season— causing sales to drop by 12% in the third quarter, earnings by 18%, and stock prices by 35%. Hershey's was not alone in its ERP implementation problems—Nestle, Whirlpool, Dow Chemical, Boeing, Dell, Nike, and others followed suit.
Three years later, Hershey's ERP system was successfully implemented and upgraded, resulting in significant improvements to its core processes, reduced costs, faster processing times, and a near-zero-defect production environment. Today, ERP has become the defacto standard for enterprise computing, and yet companies still struggle with complex systems, unrealistic expectations, and the automation of inefficient business processes. Recently, a glitch in Cadbury's new ERP system left the company with $22 million in excess chocolate inventory at the end of a year.
In this chapter we'll learn about the perils and promises of IT systems for running the enterprise, serving the customer, orchestrating the supply chain, and managing the product lifecycle.
Source: Andrew Osterland, "Blaming ERP," CFO Magazine, January 1, 2000; Todd Weiss, "Hershey Upgrades R/3 ERP System Without Hitches," Computerworld, September 9, 2002; Andy McCue, "IT Glitch Results in Cadbury Chocolate Glut," CNET News, June 8, 2006.
Enterprise resource planning (ERP) systems provide the information infrastructure for today's corporations. They bring functions, processes, and resources together to meet customer needs and provide value to shareholders. ERP evolved from more modest versions of manufacturing resource planning aimed at providing material resources and machine/labor resources to support production plans. We begin this chapter by describing the resource planning systems of material requirements planning (MRP) and capacity requirements planning (CRP), and we end with a discussion of the scope and impact of more elaborate ERP systems, with extensions to customers and suppliers.
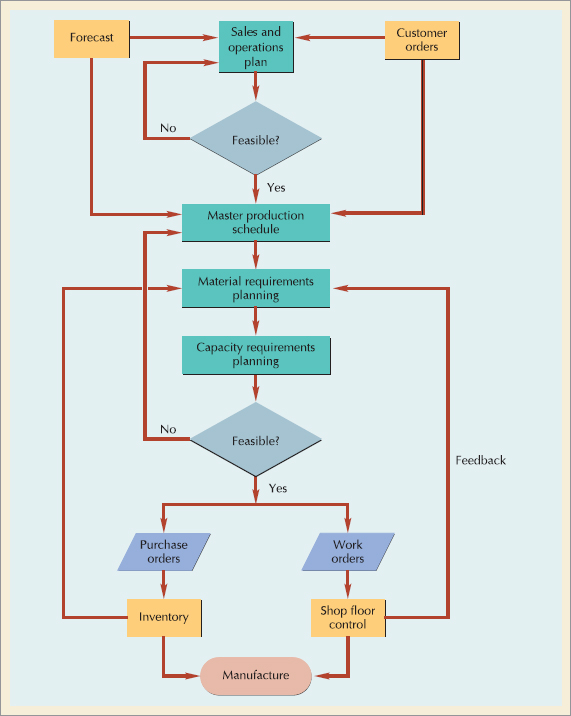
As a framework for discussion, Figure 15.1 shows the resource planning process from the sales and operations plan to manufacture. Recall that the sales and operations plan is for families of items and the master production schedule is for individual products. The material requirements plan translates the master production schedule into requirements for components, subassemblies, and raw materials. The capacity requirements plan converts the material plan into labor and machine requirements. Once the plans have been approved, purchase orders are released to suppliers and work orders are released to the shop. Purchased parts and manufactured parts are assembled in manufacture.
Material requirements planning (MRP) is a computerized inventory control and production planning system. The main objective of any inventory system is to ensure that material is available when needed—which can easily lead to a tremendous investment of funds in unnecessary inventory. One objective of MRP is to maintain the lowest possible level of inventory. MRP does this by determining when component items are needed and scheduling them to be ready at that time, no earlier and no later.
• Material requirements planning (MRP): a computerized inventory control and production planning system.
MRP was the first inventory system to recognize that inventories of raw materials, components, and finished goods may need to be handled differently. In the process of planning inventory levels for these various types of goods, the system also planned purchasing activities (for raw materials and purchased components), manufacturing activities (for component parts and assemblies), and delivery schedules (for finished products). Thus, the system was more than an inventory control system; it became a production scheduling system as well.
One of the few certainties in a manufacturing environment is that things rarely go as planned—orders arrive late, machines break down, workers are absent, designs are changed, and so on. With its computerized database, MRP is able to keep track of the relationship of job orders so that if a delay in one aspect of production is unavoidable, other related activities can be rescheduled, too. MRP systems have the ability to keep schedules valid and up to date.
MRP is useful for dependent and discrete demand items, complex products, job shop production, and assemble-to-order environments. Managing component demand inventory is different from managing finished goods inventory.
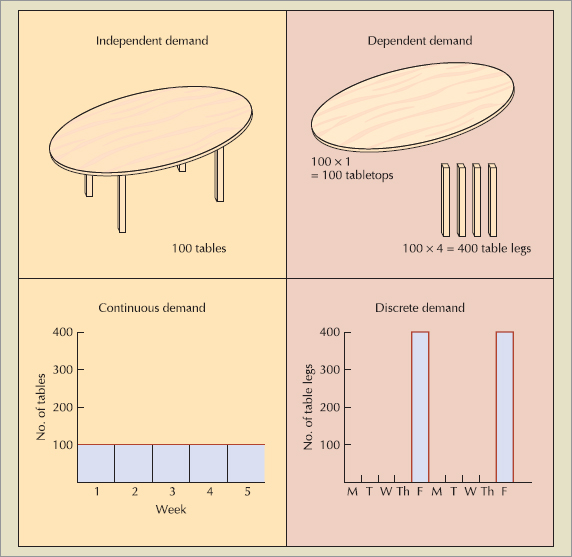
For one thing, the demand for component parts does not have to be forecasted; it can be derived from the demand for the finished product. For example, suppose demand for a table, consisting of four legs and a tabletop, is 100 units per week. Then, demand for tabletops would also be 100 per week, and demand for table legs would be 400 per week. Demand for table legs is totally dependent on the demand for tables. The demand for tables may be forecasted, but the demand for table legs is calculated. The tables are an example of independent demand. The tabletop and table legs exhibit dependent demand.
Another difference between finished products and component parts is the continuity of their demand. For the inventory control systems in Chapter 13, we assumed that demand occurred at a constant rate. The inventory systems were designed to keep some inventory on hand at all times, enough, we hoped, to meet each day's demand. With component items, demand does not necessarily occur on a continuous basis. Let us assume in our table example that table legs are the last items to be assembled onto the tables before shipping. Also assume that it takes one week to make a batch of tables and that table legs are assembled onto the tabletops every Friday. If we were to graph the demand for table legs, as shown in Figure 15.2, it would be zero for Monday, Tuesday, Wednesday, and Thursday, but on Friday the demand for table legs would jump to 400. The same pattern would repeat the following week. With this scenario, we do not need to keep an inventory of table legs available on Monday through Thursday of any week. We need table legs only on Fridays. Looking at our graph, demand for table legs occurs in lumps; it is discrete, not continuous. Using an inventory system such as economic order quantity (EOQ) for component items would result in inventory being held that we know will not be needed until a later date. The excess inventory takes up space, soaks up funds, and requires additional resources for counting, sorting, storing, and moving.
Complex Products
Industries that manufacture complex products, requiring the coordination of component production, find MRP especially useful. A complex product may have hundreds of component parts, dozens of assemblies, and several levels of assembly. MRP tries to ensure that multiple components of an assembly are ready at the same time so that they can be assembled together. Products with simple structures do not need MRP to plan production or monitor inventory levels.
Erratic Orders
The advantages of MRP are more evident when the manufacturing environment is complex and uncertain. Manufacturing environments in which customer orders are erratic, each job takes a different path through the system, lead time is uncertain, and due dates vary need an information system such as MRP to keep track of the different jobs and coordinate their schedules. The type of environment we are describing is characteristic of batch, or job shop, processes.[21] Although MRP is currently available for continuous and repetitive manufacturing, it was designed primarily for systems that produce goods in batches.
Finally, MRP systems are very useful in industries in which the customer is allowed to choose among different options. These products have many common components that are inventoried in some form before the customer order is received. For example, customers of a well-known electronics firm routinely expect delivery in six weeks on goods that take 28 weeks to manufacture. The manufacturer copes with this seemingly unrealistic demand by producing major assemblies and subassemblies in advance of the customer order and then completing the product on receipt of the order. This type of operation is called assemble-to-order or build-to-order.
Figure 15.3 shows the inputs to and outputs from the MRP process. There are three major inputs:
Master production schedule,
Product structure file, and
Item master file.
• Assemble-to-order: a manufacturing environment in which previously completed subassemblies are configured to order.
The master production schedule (MPS), also called the master schedule, specifies which end items or a schedule of finished products finished products a firm is to produce, how many are needed, and when they are needed. Recall that drives the MRP process. that the sales and operations plan is a similar schedule for product lines or families, given by months or quarters of a year. The master production schedule works within the constraints of the aggregate production plan but produces a more specific schedule by individual products. The time frame is more specific, too. An MPS is usually expressed in days or weeks and may extend over several months to cover the complete manufacture of the items contained in the MPS. The total length of time required to manufacture a product is called its cumulative lead time.
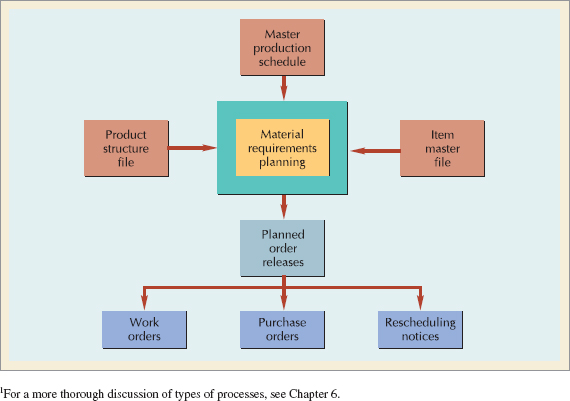
Table 15.1. MasterProduction Schedule (MPS)
MPS Item | Period | ||||
|---|---|---|---|---|---|
1 | 2 | 3 | 4 | 5 | |
Pencil case | 125 | 125 | 125 | 125 | 125 |
Clipboard | 85 | 95 | 120 | 100 | 100 |
Lapboard | 75 | 120 | 47 | 20 | 17 |
Lapdesk | 0 | 60 | 0 | 60 | 0 |
• Master production schedule: a schedule of finished products that drives the MRP process.
• Cumulative lead time: the total length of time needed to manufacture a product.
The master production schedule drives the MRP process. The schedule of finished products provided by the master schedule is needed before the MRP system can do its job of generating production schedules for component items. Table 15.1 shows a sample master production schedule consisting of four end items produced by a manufacturer of specialty writing accessories.
Several comments should be made concerning the quantities contained in the MPS:
The quantities represent production, not demand. As we saw in Chapter 14, production does not necessarily have to match demand. Strategy decisions made in the aggregate planning stage filter down to the master production schedule. Common strategies are chase demand, level production, and batching. In Table 15.1, pencil cases are following a level production strategy, clipboards and lapboards a chase demand strategy, and lapdesks a batching strategy.
The quantities may consist of a combination of customer orders and demand forecasts. Some figures in the MPS are confirmed, but others are predictions. As might be expected, the quantities in the more recent time periods are more firm, whereas the forecasted quantities further in the future may need to be revised several times before the schedule is completed. Some companies set a time fence, within which no more changes to the master schedule are allowed. This helps to stabilize the production environment.
The MPS for clipboards and lapboards shown in Table 15.1 illustrates two approaches to future scheduling. For clipboards, production beyond period 3 is based on demand forecasts of an even 100 units per period. Projecting these requirements now based on past demand data helps in planning for the availability of resources. For lapboards, production beyond period 3 appears sparse, probably because it is based on actual customer orders received. We can expect those numbers to increase as the future time periods draw nearer.
The quantities represent what needs to be produced, not what can be produced. Because the MPS is derived from the aggregate production plan, its requirements are probably "doable," but until the MRP system considers the specific resource needs and the timing of those needs, the feasibility of the MPS cannot be guaranteed. Thus, the MRP system is often used to simulate production to verify that the MPS is feasible or to confirm that a particular order can be completed by a certain date before the quote is given to the customer.
The quantities represent end items that may or may not be finished products. The level of master scheduling can differ by type of production system. In make-to-stock companies, the MPS consists of finished products. In assemble-to-order companies, the MPS usually represents major subassemblies or modules. In make-to-order companies, the master schedule can consist of critical components, hard to get materials, and service parts. Separate final assembly schedules are then used for the finished product or customer order. As Figure 15.4 shows, companies usually master schedule at the smallest part of the product structure. To simplify discussions, we assume in this chapter that an end item is, in fact, the finished product.
Once the MPS is set, the MRP system accesses the product structure file to determine which component items need to be scheduled. The product structure file contains a bill of material (BOM) for every item produced. The bill of material for a product lists the items that go into the product, includes a brief description of each item, and specifies when and in what quantity each item is needed in the assembly process.
• Time fence: a management-specified date within which no changes in the master schedule are allowed.
• Product structure file: a file that contains a computerized bill of material for every item produced.
• Bill of material (BOM): a list of all the materials, parts, and assemblies that make up a product, including quantities, parent–component relationships, and order of assembly.
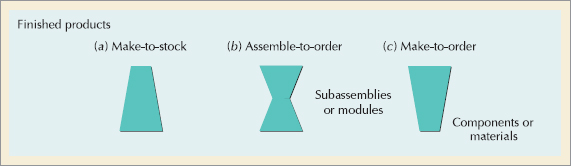
Figure 15.4. Levels of Master Production Scheduling (master schedule at the smallest part of the product structure)
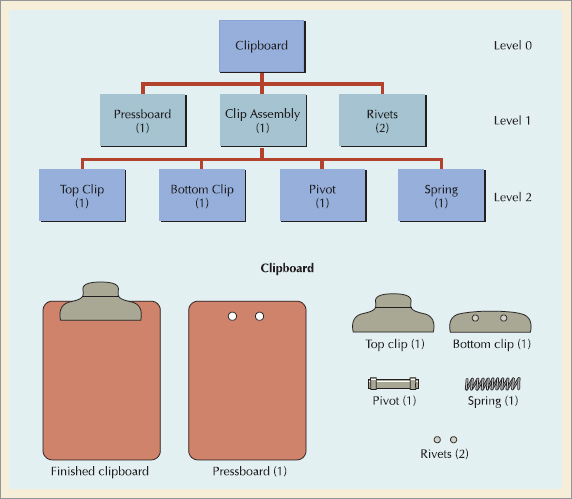
When each item is needed can best be described in the form of a product structure diagram, shown in Figure 15.5 for a clipboard. An assembled item is sometimes referred to as a parent, and a component as a child. The number in parentheses with each item is the quantity of a given component needed to make one parent. Thus, one clip assembly, two rivets, and one pressboard are needed to make each clipboard. The clip assembly, rivets, and board appear at the same level of the product structure because they are to be assembled together.
A diagram can be converted to a computerized bill of material by labeling the levels in the product structure. The final product or end item at the top of the structure—in this case, the clipboard—is labeled level 0. The level number increases as we move down the product structure. The clipboard has three levels of assembly. The bill of material for the clipboard, listed in Table 15.2, shows some levels indented underneath others. This specifies which components belong to which parents and can easily be matched to the product structure diagram.
Several specialized bills of material have been designed to simplify information requirements, clarify relationships, and reduce computer processing time. They include phantom bills, K-bills, and modular bills.
Phantom bills are used for transient subassemblies that never see a stockroom because they are immediately consumed in the next stage of manufacture. These items have a lead time of zero and a special code so that no orders for them will be released. Phantom bills are becoming more common as companies adopt lean manufacturing concepts that speed products through the manufacturing and assembly process.
K-bills or kit numbers, group small, loose parts such as fasteners, nuts, and bolts together under one pseudo-item number. In this way, requirements for the items are processed only once (for the group), rather than for each individual item. K-bills reduce the paperwork, processing time, and file space required in generating orders for small, inexpensive items that are usually ordered infrequently in large quantities.
Modular Bills
Modular bills of material are appropriate when the product is manufactured in major subassemblies or modules that are later assembled into the final product with customer-designated options. With this approach, the end item in the master production schedule is not a finished product, but a major option or module. This reduces the number of bills of material that need to be input, maintained, and processed by the MRP system.
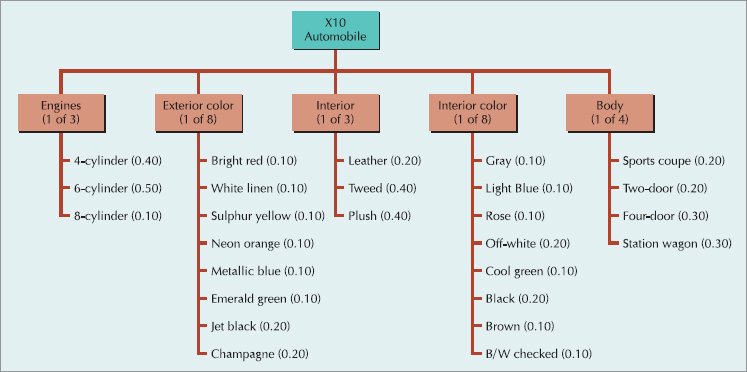
Consider the options available on the X10 automobile, partially diagrammed in Figure 15.6. The customer has a choice between three engine types, eight exterior colors, three interiors, eight interior colors, and four car bodies. Thus, there are 3 × 8 × 3 × 8 × 4 = 2304 possible model configurations—and the same number of bills of material—unless modular bills are used. By establishing a bill of material for each option rather than each combination of options, the entire range of options can be accounted for by 3 + 8 + 3 + 8 + 4 = 26 modular bills of material.
Modular bills of material also simplify forecasting and planning. The quantity per assembly for an option is given as a decimal figure, interpreted as a percentage of the requirements for the parent item. For example, from Figure 15.6, in preparation for an anticipated demand of 1000 X10 automobiles, 1000 engines are needed. Of those 1000 engines, the master production schedule would generate requirements for 400 four-cylinder engines, 500 six-cylinder engines, and 100 eight-cylinder engines.
The creation of a product structure file can take a considerable amount of time. Accurate bills of material are essential to an effective MRP system. The bill of material must specify how a product is actually manufactured rather than how it was designed to be manufactured. Redundant or obsolete part numbers must be purged from the system. This may not seem like a big task, but in some companies every time a part is purchased from a different supplier, it is assigned a different part number. One firm in the process of implementing MRP was able to eliminate 6000 extra part numbers from its database and dispose of thousands of dollars of obsolete inventory that had not previously been identified as such.
Phantom bills, K-bills, and modular bills simplify planning.
• Modular bills of material: bills used to plan the production of products with many optional features.
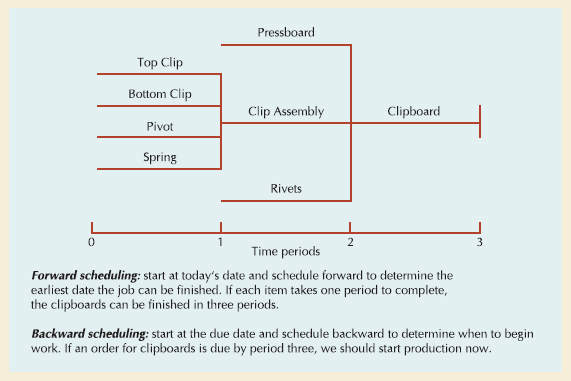
A time-phased bill of material, also known as a time-phased assembly chart, is basically a horizontal product structure diagram that graphically shows the lead time required to purchase or manufacture an item. Assuming the lead time for each item in the bill of material for a clipboard is one week, Figure 15.7 shows how long it will take to assemble a clipboard from scratch. An MRP system can forward schedule or backward schedule production. Forward scheduling starts at today's date and schedules forward to determine the earliest date a job can be finished. In Figure 15.7, the clipboard can be finished by period 3. Backward scheduling starts at the due date and schedules backwards to determine when to begin work. In our example, if an order for clipboards is due by period 3, production should begin now.
• Time-phased bill of material: an assembly chart shown against a time scale.
• Forward scheduling: schedules forward from today's date.
• Backward scheduling: schedules backwards from the due date.


MRP systems can be used for services, too. In renovating hotel rooms, Marriot develops a bill of material and a bill of labor for each room type and then "explodes" the bill throughout the facility to summarize its furniture and decorating needs. Menus in restaurants can be thought of as master schedules. Demand for menu items is forecasted and then multiplied by a bill of ingredients to ensure sufficient "material" is on hand for the chef to prepare what the customer orders. The bill of ingredients can also be used to accurately price menu items.
The item master file, or inventory file, contains an extensive amount of information on every item that is produced, ordered, or inventoried in the system. It includes such data as on-hand quantities, on-order quantities, lot sizes, safety stock, lead time, and past usage figures. Table 15.3 displays the item master file of the pressboard component from the clipboard example. It provides a detailed description of the item, specifies the inventory policy, updates the physical inventory count, summarizes the item's year-to-date or month-to-date usage, and provides internal codes to linkthis file with other related information in the MRP database.
• Item master file: a database of information on every item produced, ordered, or inventoried.
The item master file is updated whenever items are withdrawn from or added to inventory or whenever an order is released, revised, or completed. Accuracy of inventory transactions is essential to MRP's ability to keep inventory levels at a minimum. It is estimated that 95% inventory accuracy is a prerequisite for an effective MRP system. Although technologies such as bar codes, voice-activated systems, and automated "picking" equipment can improve inventory accuracy considerably, a general overhaul of inventory procedures is often needed. This involves (1) maintaining orderly stockrooms; (2) establishing and enforcing procedures for inventory withdrawal; (3) ensuring prompt and accurate entry of inventory transactions; (4) taking physical inventory count on a regular basis; and (5) reconciling inventory discrepancies in a timely manner.

Systems Auditor for a Big Four Accounting Firm
In today's regulatory environment, audits go far beyond the scope of traditional financial and regulatory compliance. With the Sarbanes-Oxley Act, PATRIOT Act, and revised Financial Modernization Act, it has become a requirement for all public corporations to document their business processes and verify them by external auditors. As a financial auditor and now a systems auditor, I interview various personnel at different stages of the production or service process, compare their activities with those documented, and point out inconsistencies, as well as inefficiencies. It takes about two months to thoroughly understand a process and about two weeks to audit it.
Corporations nowadays have complicated ERP and MRP systems whose methods of operation are not always evident to the people using the systems. These systems, though technologically advanced, rely on basic concepts in operations management. As an auditor, a complete understanding of the various processes and methodologies is very important, and my study of operations management has provided the groundwork for such knowledge.
Table 15.3. Item Master File
Inventory Policy | |||
|---|---|---|---|
Item | Pressboard | Lead time | 1 |
Item no. | 7341 | Anuual demand | 5000 |
Item type | Purch | Holding cost | 1 |
Product/sales class | Comp | Ordering/setup cost | 50 |
Value class | B | Safety stock | 0 |
Buyer/planner | RSR | Reorder point | 39 |
Vendor/drawing | 07142 | EOQ | 316 |
Phantom code | N | Minimum order qty. | 100 |
Unit price/cost | 1.25 | Maximum order qty. | 500 |
Pegging | Y | Multiple order qty. | 1 |
LLC | 1 | Policy code | 3 |
Physical Inventory | Usage/Sales | ||
|---|---|---|---|
On hand | 150 | YTD usage/sales | 1100 |
Location | W142 | MTD usage/sales | 75 |
On order | 100 | YTD receipts | 1200 |
Allocated | 75 | MTD receipts | 0 |
Cycle | 3 | Last receipt | 8/25 |
Last count | 9/5 | Last issue | 10/5 |
Difference | −2 | ||
Codes | |||
|---|---|---|---|
Cost acct. | 00754 | ||
Routing | 00326 | ||
Engr. | 07142 | ||
If you have ever taken part in an end-of-year inventory count, you can verify the wide discrepancies that are commonly found between what the records say is in inventory and what is physically there. Unfortunately, by the time the errors are discovered, it is too late to correct them or find out why they occurred. The slate is merely cleaned for next year's record, with the hope or promise that next time will be better.
Cycle counting involves taking physical count of at least some inventory items daily and reconciling differences as they occur. The system specifies which items are to be counted each day on a computer printout and may tie the frequency of the count to the frequency of orders for the item within the MRP system. Thus, items that are used more often are counted more often. The cycle counting system may also be related to the ABC classification system discussed in Chapter 13. A items would be counted more often than B items, perhaps weekly. B items would be counted monthly, and C items may still be counted only once a year. Approved cycle counting systems are accepted by the accounting standards board as valid replacements for end-of-year physical inventories.
• Cycle counting: taking physical count of inventory at various cycles during the year.
The MRP system is responsible for scheduling the production of all items beneath the end item level. It recommends the release of work orders and purchase orders, and issues rescheduling notices when necessary.
• Netting: the process of subtracting on-hand quantities and scheduled receipts from gross requirements to produce net requirements.
The MRP process consists of four basic steps: (1) exploding the bill of material, (2) netting out inventory, (3) lot sizing, and (4) time-phasing requirements. The process is performed again and again, moving down the product structure until all items have been scheduled. An MRP matrix, as shown in Table 15.4, is completed for each item starting with level zero items. Identifying information at the top of the matrix includes the item name or number, the lowest level at which the item appears in the product structure (called low level code or LLC), the time required to make or purchase an item (called lead time or LT), and the quantities in which an item is usually made or purchased (called lot size).
Table 15.4. The MRP Matrix
Item Lot size | LLC LT | Period | ||||
|---|---|---|---|---|---|---|
1 | 2 | 3 | 4 | 5 | ||
Gross Requirement | ||||||
Scheduled Receipts | On order and scheduled to be received | |||||
Beg. Inv | Anticipated quantity on hand at the end of the period | |||||
Gross requirements net of inventory and scheduled receipts | ||||||
When orders need to be received | ||||||
Planned Order Releases | When orders need to be placed to be received on time | |||||
Entries in the matrix include gross requirements, scheduled receipts, projected on hand, net requirements, planned order receipts, and planned order releases. Gross requirements begin the MRP process. They are given in the master production schedule (MPS) for end items and derived from the parent for component items. Scheduled receipts are items on order that are scheduled to arrive in future time periods. Projected on hand is inventory currently on hand or projected to be on hand at the end of each time period as a result of the MRP schedule. Net requirements are what actually needs to be produced after on-hand and on-order quantities have been taken into account. Planned order receipts represent the quantities that will be ordered and when they must be received. These quantities differ from net requirements by lot sizing rules when production or purchasing is made in predetermined batches or lots. Common lot sizing rules include ordering in minimum or multiple quantities, using an EOQ or periodic order quantity, or ordering the exact quantities needed (called lot-for-lot or L4L). We discuss these techniques later in the chapter.
The last row of the matrix, planned order releases, determines when orders should be placed (i.e., released) so that they are received when needed. This involves offsetting or time phasing the planned order receipts by the item's lead time. Planned order releases at one level of a product structure generate gross requirements at the next lower level. When the MRP process is complete, the planned order releases are compiled in a planned order report.
• Lot sizing: determining the quantities in which items are usually made or purchased.
• Time phasing: subtracting an item's lead time from its due date to determine when to order an item.
School Mate Products
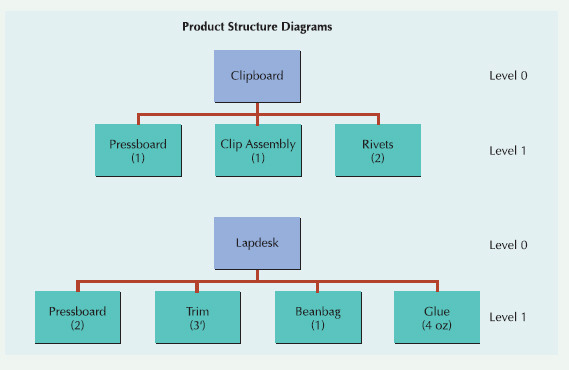
School Mate offers a number of standard products to encourage writing outside of the classroom, including clipboards, lapdesks, lapboards, and pencil boxes. Rising costs and inventory levels have prompted the company to install a computerized planning and control system called MRP. The MPS and bill of material modules are up and running. Sample output follows. Before going live with the MRP module, School Mate has asked for a manual demonstration. Since manual calculations can be quite tedious, you have decided to prepare MRP matrices for only three items—the clipboard and lapdesk, and a common component, pressboard. The master production schedule, abbreviated product structure diagrams, and inventory information are given below.
Master Production Schedule
1 | 2 | 3 | 4 | 5 | |
|---|---|---|---|---|---|
Clipboard | 85 | 95 | 120 | 100 | 100 |
Lapdesk | 0 | 60 | 0 | 60 | 0 |
Clipboard | Lapdesk | Pressboard | |
|---|---|---|---|
On hand | 25 | 20 | 150 |
On order (sch receipt) | 175 (period 1) | 0 | 0 |
LLC | 0 | 0 | 1 |
Lot size | L4L | Mult 50 | Min 100 |
Lead time | 1 | 1 | 1 |
Solution
We begin with the level 0 items, the clipboard and lapdesk. Since these are finished products, the gross requirements row is simply copied from the master production schedule for those items. We'll begin with the clipboard.
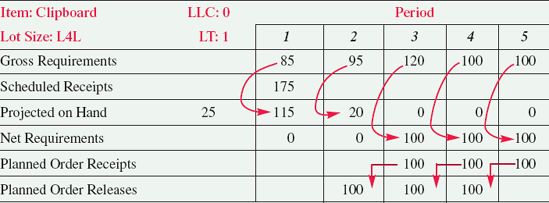
In period 1 we have 25 units on hand and 175 scheduled to be received. That gives us (25 + 175) = 200 units available. We use 85 of them to satisfy demand, leaving (200 – 85) = 115 units in inventory at the end of period 1. In period 2, we can meet demand from stock, leaving (115 – 95) = 20 units in inventory at the end of the period. In period 3, the 20 units on hand is not enough to cover our demand of 120 units. We need to make 100 more. Thus, our net requirements are 100 units. Since our lot sizing rule is lot-for-lot, we order exactly what we need, 100 units. Recall that our lead time is one week. If we wish to receive our order for 100 units in period 3, we must place the order one week in advance, in period 2. To meet demand in periods 4 and 5, we order 100 units in weeks 3 and 4, one week in advance of when we need them.
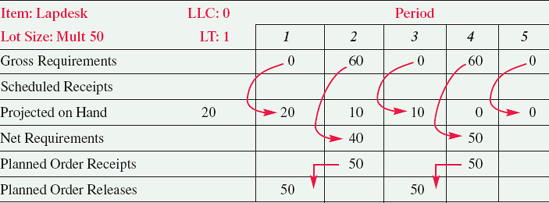
The MRP matrix for lapdesks appears below. To meet our demand for 60 units in period 2, we'll use the 20 units in stock and make 40 more. Before we release our work order for production, we check our lot sizing rule. It says we should make 50 lapdesks at a time. If the 50 desks are to be ready by week 2, we need to start production in week 1. When the desks are completed, we'll use 40 of them to meet demand and place 10 back in inventory. Those 10 remain in inventory until period 4 when we use them to partially satisfy the demand for 60 desks. We'll need to make 50 more, and since 50 is our lot size quantity, that's what we make. If the desks are to be completed by week 4, we need to start production in week 3.
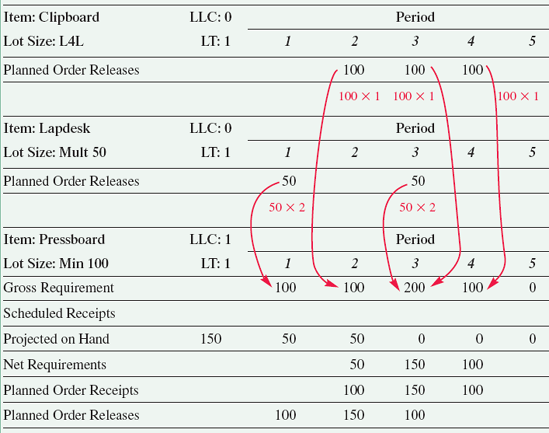
Pressboard is a purchased component cut to size and used in both the clipboard and the lapdesk. As shown below, its gross requirements are calculated by multiplying the planned order releases of each parent times the quantity per assembly contained in the bill of material. This process is called explosion. Since one pressboard is needed for every clipboard and two for every lapdesk, period 1 gross requirements are (50 × 2) = 100; period 2, (100 × 1 = 100); period 3, (100 × 1) + (50 × 2) = 200; and period 4, (100 × 1) = 100.
• Explosion: the process of determining requirements for lower-level items.
With 150 units on hand, we can satisfy the demand in period 1 with 50 units left over. For period 2, we use the 50 in inventory and need 50 more. Because our lot sizing rule says we must order at least 100 units and it takes 1 week to process an order, we place an order for 100 pressboards in week 1. When the 100 boards come in, we use 50 of them and put 50 back in stock. To meet our demand in period 3, we use the 50 boards in stock and order 150 more. The order is placed in week 2 to arrive in week 3. To meet period 4's demand, we order 100 boards in week 3, one week in advance of delivery.
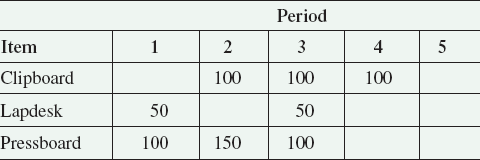
We have now completed the MRP calculations. To summarize the results, we construct a planned order report from the planned order release row of each matrix, as follows:
Planned Order Report
Example 15.1 illustrated the use of minimum order quantities, multiple order quantities, and lot-for-lot sizing rules. Although the L4L approach is most consistent with the objectives of MRP, in some circumstances it is useful to order an amount different from what is needed. For example, minimum order quantities are typically used to take advantage of purchasing or shipping discounts, or to conform to vendor requirements, maximum order quantities are used for large or expensive items when space or funds are limited, and multiple order quantities accommodate packaging restrictions (such as a set number in a box, gallon containers, bundles, or pallet loads). Several additional lot sizing techniques are available with most MRP systems. These include economic order quantity (EOQ) and periodic order quantity (POQ).
Economic Order Quantity
We discussed the economic order quantity for independent demand items in Chapter 13. The EOQ can be adapted for use with MRP if it is treated as a minimum order quantity. In addition, annual demand, D, is replaced with average demand per period, d, and carrying cost, Cc, is converted to a per-period amount. The EOQ is used only sparingly, usually at the finished product or raw material level, and does not perform well when demand is highly variable.
Periodic Order Quantity
The periodic order quantity (POQ) was created as a variation of the EOQ more suited to variable demand. POQ is calculated by dividing the EOQ by average demand. It represents the number of demand periods covered by each order. Thus, if the POQ were three, an order would be placed for three weeks worth of demand.
Example 15.2 compares the L4L, EOQ, and POQ, lot sizing techniques.
• Periodic order quantity (POQ): a lot sizing technique that orders at set time intervals.
Advanced Lot Sizing Rules
The Lifetime Sports Company has been using MRP to manufacture sports equipment for a number of years. Recently, Bob Sage, the operations manager, decided to investigate the use of lot sizing for MRP-generated orders. As a test case, Bob selected a typical product in their line of fishing rods and gathered weekly data over a month's time. Ordering costs are $60 per order, and carrying costs are $1 per unit per week. The beginning inventory is 30 units, and lead time is one week. Help Bob determine whether the L4L, EOQ or POQ lot sizing technique is more appropriate.
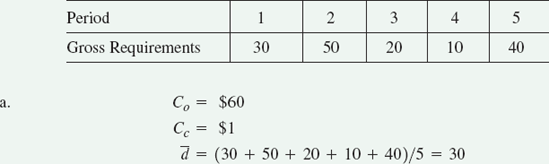
With L4L, orders are placed for the exact amount needed. Total cost is calculated as (number of orders × ordering cost) + (total projected on hand × carrying cost).
The outputs of the MRP process are planned orders from the planned order release row of the MRP matrix. As shown in Figure 15.4, these can represent work orders to be released to the shop floor for in-house production or purchase orders to be sent to outside suppliers. MRP output can also recommend changes in previous plans or existing schedules. These action notices, or rescheduling notices, are issued for items that are no longer needed as soon as planned or for quantities that may have changed. One of the advantages of the MRP system is its ability to show the effect of change in one part of the production process on the rest of the system. It simulates the ordering, receiving, and use of raw materials, components, and assemblies into future time periods and issues warnings to the MRP planner of impending stockouts or missed due dates.
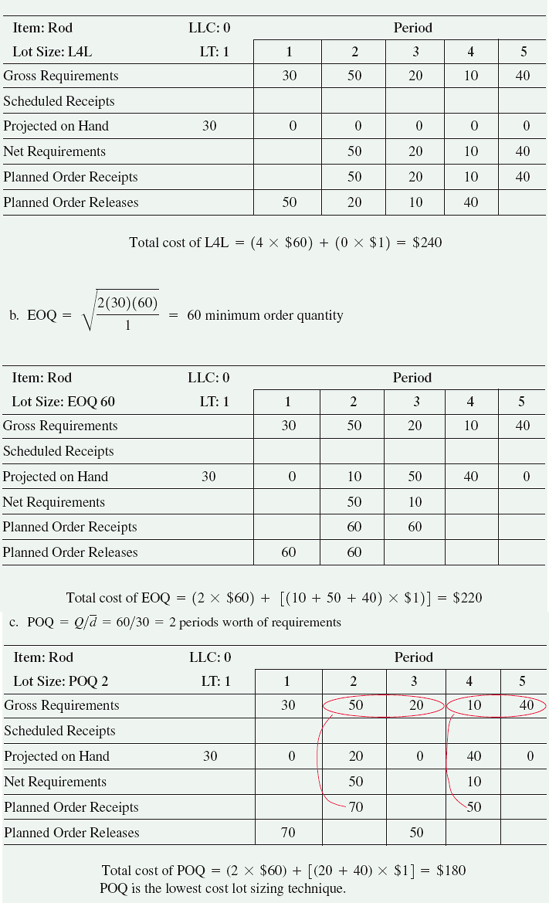
Table 15.5 shows a monthly planned order report for an individual item, in this case, item #2740. The report maps out the material orders planned and released orders scheduled to be completed in anticipation of demand. Notice that safety stock is treated as a quantity not to be used and that a problem exists on 10-01, when projected on hand first goes negative. To correct this, the system suggests that the scheduled receipt of 200 units due on 10-08 be moved forward to 10-01. The MRP system will not generate a new order if a deficit can be solved by expediting existing orders. It is up to the MRP planner to assess the feasibility of expediting the scheduled receipt and to take appropriate action.
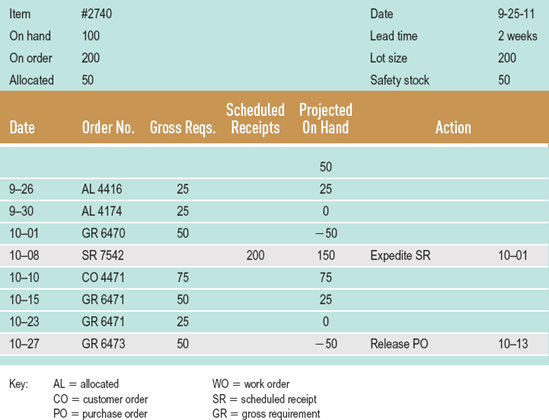
Table 15.6 shows an MRP action report for a family of items for which a particular MRP planner is responsible. It summarizes the action messages that have been compiled for individual items. On 10-08, we see the action message for item #2740 that appeared on the previous report. Notice the variety of action messages listed. Some suggest that planned orders be moved forward or backward. Others suggest that scheduled receipts be expedited or de-expedited.
It is the planner's job to respond to the actions contained in the action report. If a planner decides to expedite an order—that is, have it completed in less than its normal lead time—he or she might call up a supplier or a shop supervisor and ask for priority treatment. Giving one job higher priority may involve reducing the priority of other jobs. This is possible if the MRP action report indicates that some jobs are not needed as early as anticipated. The process of moving some jobs forward in the schedule (expediting) and moving other jobs backward (de-expediting) allows the material planner, with the aid of the MRP system, to fine-tune the material plan. Temporary lead time adjustments through overtime or outside purchases of material can also fix a timing problem in the MRP plan, but at a cost. An MRP action report that is exceedingly long or does not strike a balance between speeding up some orders and slowing down others can signify trouble. Action messages that recommend only the expediting of orders indicate an overloaded master schedule and an ineffective MRP system.
• Expedite: to speed up an order so it is completed in less than its normal lead time.
The MRP system, as the name implies, ensures that material requirements are met. However, material is not the only resource necessary to produce goods—a certain amount of labor and machine hours are also required. Thus, the next step in the planning process is to verify that the MRP plan is "feasible" by checking for the availability of labor and/or machine hours. This process is called capacity requirements planning and is similar to MRP.
Capacity requirements planning (CRP) is a computerized system that projects the load from a given material plan onto the capacity of a system and identifies underloads and overloads. It is then up to the MRP planner to level the load—smooth out the resource requirements so that capacity constraints are not violated. This can be accomplished by shifting requirements, reducing requirements, or temporarily expanding capacity.
• Capacity requirements planning (CRP): creates a load profile that identifies underloads and overloads.
There are three major inputs to CRP, as shown in Figure 15.8:
The planned order releases from the MRP process;
A routing file, which specifies which machines or workers are required to complete an order from the MRP plan, in what order the operations are to be conducted, and the length of time each operation should take; and
an open orders file, which contains information on the status of jobs that have already been released but have not yet been completed.
• Capacity the maximum capability to produce.
• Utilization the percent available time spent working.
• Efficiency how well a machine or worker performs compared to a standard output level.
• Load: the standard hours of work assigned to a facility.
• load percent: the ratio of load to capacity.
With this information, CRP can produce a load profile for each process or work center in the shop. The load profile compares released orders and planned orders with work center capacity.
Capacity is the maximum capability to produce. It can be measured as units of output, dollars of output, hours of work, or number of customers processed over a specified period of time. Capacity is affected by the mix of products and services, the choice of technology, the size of a facility, and the resources allocated.
Rated capacity is the theoretical output that could be attained if a process were operating at full speed without interruption, exceptions, or downtime. Effective capacity takes into account the efficiency with which a particular product or customer can be processed, and the utilization of the scheduled hours or work. Effective capacity expressed in hours per day is calculated as:
Effective daily capacity = (no. of machines or workers) × (hours per shift)
× (no. of shifts) × (utilization) × (efficiency)
Utilization refers to the percentage of available working time that a worker actually works or a machine actually runs. Scheduled maintenance, lunch breaks, and setup time are examples of activities that reduce actual working time. Efficiency refers to how well a machine or worker performs compared to a standard output level. Standards can be based on past records of performance or can be developed from the work-measurement techniques discussed in Chapter 8. An efficiency of 100% is considered normal or standard performance, 125% is above normal, and 90% is below normal. Efficiency is also dependent on product mix. Some orders obviously will take longer than others to process, and some machines or workers may be better at processing certain types of orders.
Load is the standard hours of work (or equivalent units of production) assigned to a production facility. After load and capacity have been determined, a load percent can be calculated as
Centers loaded above 100% will not be able to complete the scheduled work without some adjustment in capacity or reduction in load.
Determining Loads and Capacities
Copy Courier (CC) is a fledgling copy center in downtown Richmond run by two college students. Currently, the equipment consists of two high-speed copiers that can be operated by one operator. If the students work alone, it is conceivable that two shifts per day can be staffed. The students each work 8 hours a day, 5 days a week. They do not take breaks during the day, but they do allow themselves 30 minutes for lunch or dinner. In addition, they service the machines for about 30 minutes at the beginning of each shift. The time required to set up for each order varies by the type of paper, use of color, number of copies, and so on. Estimates of setup time are kept with each order. Since the machines are new, their efficiency is estimated at 90%.
Due to extensive advertising and new customer incentives, orders have been pouring in. The students need help determining the capacity of their operation and the current load on their facility. Use the following information to calculate the normal daily capacity of Copy Courier and to project next Monday's load and load percent.
Job No. | No. of Copies | Setup Time (min) | Run Time (min/unit) |
|---|---|---|---|
10 | 500 | 5.2 | 0.08 |
20 | 1000 | 10.6 | 0.10 |
30 | 5000 | 3.4 | 0.12 |
40 | 4500 | 11.2 | 0.14 |
50 | 2000 | 15.3 | 0.10 |
Solution
The machines and operators at Copy Courier are out of service for 1 hour each shift for maintenance and lunch. Utilization is thus 7/8, or 87.5%. Daily copy shop capacity is:
2 machines × 2 shifts × 8 hours shift × 90% efficiency
× 87.5% utilization = 25.2 hours or 1512 minutes
The projected load for Monday of next week is as follows:
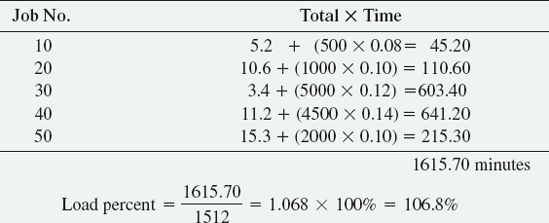
Copy Courier is overloaded 6.8%. Several options are available to alleviate the overload. If each worker extends his or her working day by approximately 36 minutes, the load percent will reduce to 99%. The same effect can be achieved by increasing efficiency to 97%. This may involve limiting the orders accepted to those that can be processed more efficiently, or grouping jobs by similar processing requirements so that setup time is reduced.
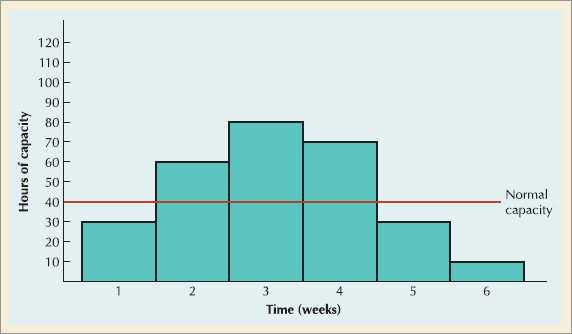
Load profiles are a graphical comparison of load versus capacity. As shown in Figure 15.9, the normal capacity of Department A is 40 hours per week. We can see that the machine is underloaded in periods 1, 5, and 6, and overloaded in periods 2, 3, and 4. Underloaded conditions can be leveled by:
• Load profile: a graphical comparison of load versus capacity.
Additional work can be acquired by transferring similar work from other machines in the same shop that are near or over capacity, by making components in-house that are normally purchased from outside suppliers, or by seeking work from outside sources. Pulling work ahead seems like a quick and easy alternative to alleviate both underloads and overloads. However, we must remember that the MRP plan was devised based on an interrelated product structure, so the feasibility of scheduling work in an earlier time period is contingent on the availability of required materials or components. In addition, work completed prior to its due date must be stored in inventory and thus incurs a holding cost. When work is shifted to other time periods, the MRP plan should be rerun to check the feasibility of the proposed schedule.
If an underloaded condition continues for some time, reducing the size of the workforce may be necessary. Smaller underloads can be handled by reducing the length of the working day or workweek, by scheduling idled workers for training sessions or vacations, or by transferring workers to other positions at machine centers or processes where overloads are occurring.
Overloaded conditions are the primary concern of the MRP planner because an overloaded schedule left unchecked cannot possibly be completed as planned. Overloads can be reduced by:
Eliminating unnecessary requirements;
Rerouting jobs to alternative machines, workers, or work centers;
Splitting lots between two or more machines;
Increasing normal capacity;
Subcontracting;
Increasing the efficiency of the operation;
Pushing work back to later time periods; or
Revising the master schedule.
Some capacity problems are generated from an MRP plan that includes lot sizes, safety stock and unsubstantiated requirements for service parts or forecasted demand. To verify that a capacity overload is caused by "real" need, the planner might examine the MRP matrices of the items assigned to a machine center during an overloaded period as well as the matrices of the parents of those items processed, all the way up the product structure to the master schedule. Or, the MRP system could be rerun with lot sizes temporarily set to one and safety stock to zero to see if the capacity problem is eliminated.
MRP systems assume that an entire lot of goods is processed by one machine or operator. Given the job shop environment in which most MRP systems are installed, there are usually several machines that can perform the same job (although perhaps not as efficiently). With CRP, load profiles are determined with jobs assigned to the preferred machine first, but when capacity problems occur, jobs can certainly be reassigned to alternate machines. In addition, if two or more similar machines are available at the same time, it may be possible to split a batch—that is, assign part of an order to one machine and the remainder to another machine.
Normal capacity can be increased by adding extra hours to the work day, extra days to the work week, or extra shifts. Temporary overloads are usually handled with overtime. More extensive overloads may require hiring additional workers. Work can also be outsourced.
Improving the efficiency of an operation increases its capacity. Assigning the most efficient workers to an overloaded machine, improving the operating procedures or tools, or decreasing the percentage of items that need to be reworked or scrapped increases efficiency and allows more items to be processed in the same amount of time. Because output increases with the same amount of input, productivity increases. This is especially useful for alleviating chronic overloads at bottleneck operations, but it does take time to put into effect.
If later time periods are underloaded, it may be possible to push work back to those periods so that the work is completed but later than originally scheduled. There are two problems with this approach. First, postponing some jobs could throw the entire schedule off, meaning customers will not receive the goods when promised. This could involve a penalty for late delivery, loss of an order, or loss of a customer. Second, filling up the later time periods may preclude accepting new orders during those periods. It is normal for time periods further in the future to be underloaded. As these periods draw nearer, customer orders accelerate and begin taking up more of the system's capacity.
If all the preceding approaches to remedying overloads have been tried, but an overload still exists, the only option is to revise the master schedule. That means some customer will not receive goods as previously promised. The planner, in conjunction with someone from marketing, should determine which customers have the lowest priority and whether their orders should be postponed or canceled.
There are cost consequences associated with each of these alternatives, but there is usually no attempt to derive an optimal solution. More than likely, the MRP planner will use the options that produce a feasible solution quickly. In many manufacturing environments, new customer orders arrive daily, and feasible MRP plans can become infeasible overnight.
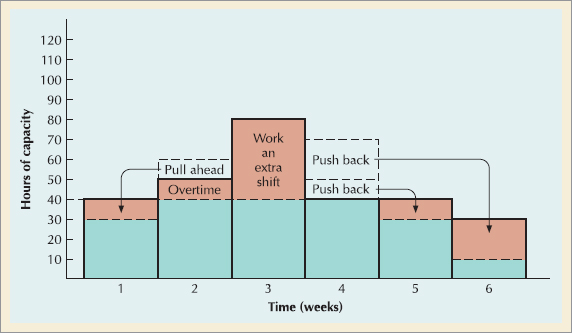
Figure 15.10 shows one possible remedy for the overloads shown in Figure 15.9. Ten hours of work are pulled ahead from period 2 to period 1. Ten hours of overtime are assigned in period 2. An entire 40-hour shift is added in period 3. Ten hours of work from period 4 are pushed back to period 5, and 20 hours are pushed back to period 6. This process of balancing underloads and overloads is called load leveling.
Reduce overloads by increasing normal capacity, improving efficiency, or postponing work.
• Load leveling: the process of balancing underloads and overloads.
CRP identifies capacity problems, but the planner solves the problems. With experience, the task of shifting work and leveling loads is not as formidable as it appears. However, it is helpful if the initial load profile is as accurate as possible and if previous planning stages (i.e., sales and operations planning and master production scheduling) have considered capacity constraints. Some companies formalize capacity planning at each stage of production planning. Resource requirements planning is associated with the sales and operations plan, and rough-cut capacity planning is performed prior to the approval of a master schedule. Capacity requirements planning may still be performed on the material requirements plan, but its role is to fine-tune existing resources rather than to find or develop new resources.
Once the feasibility of an MRP plan has been verified by CRP, the plan can be executed by releasing orders in the time periods indicated. Normally, the ERP system automatically releases the orders. Work orders sent to the shop enter a shop floor control system, where daily scheduling and monitoring take place. When received, purchase orders are logged through the inventory system electronically before moving to manufacturing. Refer back to Figure 15.1. The figure shows the entire MRP process from the sales and operations plan to manufacture as a closed-loop system. The term is used to describe the numerous feedback loops between plans for production and available capacity.
The MRP process described in the previous sections and depicted in Figure 15.1 makes certain assumptions about production resources and how they should be allocated. Today's ERP technology allows us to relax some of the more restrictive assumptions of MRP. For example, we have learned the following:
Material is not always the most constraining resource. The iterative procedure described in the previous section for determining material availability first, then verifying capacity may not be relevant to some industries. If there are particular processes that constrain the system or other capacity constraints that are difficult to relax, then they should drive the schedule rather than the availability of materials. Similarly, a bill of material may not be as important as a bill of labor, a bill of resources, a bill of distribution, or a bill of information.
Lead times can vary. Fixed lead times assume that either lot sizes will continue unchanged or that they have no bearing on lead time. Under this assumption, the lead time necessary to process an order would remain the same whether that order consists of 1 unit or 100 units, and whether the shop is operating empty or at capacity. ERP processors today are able to handle variable lead times, but users must determine how sensitive the system should be to parameters that change.
Not every transaction needs to be recorded. MRP tries to keep track of the status of all jobs in the system and reschedules jobs as problems occur. In a manufacturing environment of speed and small lot sizes, this is cumbersome. It might take as long to record the processing of an item at a workstation as it does to process the item. Managers must assess how much processing detail is really needed in the common database and how much control is enough.
The shop floor may require a more sophisticated scheduling system. Dynamic scheduling environments require a level of sophistication not present in most MRP systems. Chapter 17 introduces more advanced planning and control techniques for detailed scheduling.
Scheduling in advance may not be appropriate for on-demand production. Many companies today produce products on-demand from customers. The just-in-time or lean production environment, discussed in the next chapter, may produce better results under those circumstances. Whereas the master scheduling and bill-of-material explosion aspects of MRP are used in virtually all manufacturing environments, the MRP/CRP process is unnecessary in repetitive manufacturing driven by customer orders.
Enterprise resource planning (ERP) is software that organizes and manages a company's business processes by sharing information across functional areas. It transforms transactional data like sales into useful information that supports business decisions in other parts of the company, such as manufacturing, inventory, procurement, invoicing, distribution, and accounting. In addition to managing all sorts of back-office functions, ERP connects with supply chain and customer management applications, helping businesses share information both inside and outside the company. Thus, ERP serves as the backbone for an organization's information needs, as well as its e-business initiatives.
• Enterprise resource planning (ERP): software that organizes and manages a company's business processes by sharing information across functional areas.
Prior to ERP, most companies supported a full staff of program developers, who wrote their business applications from scratch or developed complicated interfaces to allow prepackaged applications from several vendors to pass data back and forth as necessary to complete business transactions throughout the enterprise. This process was costly, time-consuming, and error-prone. Communication among various areas of the business was difficult, and managers could not get a comprehensive view of how the business was doing at any point in time.
SAP AG, a German software company, created a generic ERP software package to integrate all business processes together for use by any business in the world. Established first in a mainframe version, the software was updated to client server architecture just as companies began replacing their old legacy systems in preparation for the Y2K problem. Sales were robust, and with essentially one product SAP became the third largest software company in the world.
With ERP, companies could integrate their accounting, sales, distribution, manufacturing, planning, purchasing, human resources, and other transactions into one application software. This enabled transactions to be synchronized throughout the entire system. For example, a customer order entered into an ERP system would ripple through the company, adjusting inventory, parts supplies, accounting entries, production schedules, shipping schedules, and balance sheets.
ERP systems help companies manage their resources efficiently and, at the same time, better serve their customers. Owens Corning replaced over 200 legacy systems with one ERP system. By coordinating customer orders, financial reporting, and global procurement, the company was able to save over $65 million. IBM Storage Systems reduced the time required to reprice its line of products from 5 days to 5 minutes, the time to ship a replacement part from 22 days to 3 days, and the time to complete a credit check from 20 minutes to 3 seconds. Microsoft saved $12 million annually just in early-payment discounts from vendors when its ERP system went live. Monsanto cut its production planning from 6 weeks to 3, reduced working capital, and enhanced its bargaining position with suppliers, saving the company an estimated $200 million a year.
ERP integrates business processes.
ERP systems facilitate customer interaction.

Senior Manager of Financial Planning and Analysis for Air Products
I began working at Air Products as a business analyst assessing the profitability of capital projects. Air Products spends between $700 and $800 million a year on capital projects, 25% of which support existing operations. the remaining 75% is invested in growth opportunities, predominantly building new or expanded production facilities. Our company was founded on the strength of a simple, yet revolutionary, idea—producing and selling industrial gases "on-site." That means building gas-generating facilities adjacent to customer sites to reduce distribution costs.
Air Products has since broadened its scope to include specialty gases and chemicals, but "on-sites," as we call them, remain a core business. Because we are investing a great deal of money in new plant and equipment to supply each customer, we negotiate 15-year contracts with minimum-volume commitments and cost pass-through provisions. Capital project analysis is more than "running the numbers." As a business analyst, I worked with operations, engineering, marketing, and sales to put together a thorough analysis of each investment opportunity.
My current job involves setting policies for financial analysis (such as worldwide hurdle rates and risk assessment) and developing the financial plan for the company using multiyear cash flow projections to make decisions on capital and acquisition spending, dividend policy, and debt restructuring. A portion of my time is spent monitoring working capital. By lowering inventories, purchasing costs, and receivables, we have more capital to invest in growth. Two fairly recent corporate initiatives that are significantly reducing costs are e-procurement and ERP (enterprise resource planning.)
We are about halfway through a five-year implementation of SAP's ERP system. The system automates transactions, streamlines processes, and provides us with more useful information with which to make decisions. For example, we're getting a better handle on our costs through newly designed cost centers. SAP also helps us rationalize our facilities and make better sourcing decisions. Implementation has been going well. It's been more of a cultural and process change than a technical one. We can standardize processes, but getting people to consistently follow them is another matter.
We use APDirect, an Ariba product, for various e-procurement initiatives. For B2B, we are members of industry exchanges such as Elemica for the chemical industry and Rosetta Net for electronics. Many of our transactions take place over established EDI (electronic data interchange) systems. For strategic sourcing, we've joined a consortium called LSN (Leveraged Sourcing Network) consisting of 20 to 25 companies from a variety of industries who, when combined, represent the purchasing power of a Fortune 10 company. We also have a direct sourcing application that allows closed bids, forward and reverse auctions, and project workspaces for collaboration. We probably save $10 million annually in costs with our e-procurement initiatives.
In our company, like many others, most of our capital projects and costs savings opportunities involve operations. By streamlining our processes, automating and standardizing our systems, and working collaboratively across functional lines, we can increase our efficiency and profitability—not to mention "face time" with our customers. Air Products is successful today not only because of its operational excellence, but also because of the ability of its people to create lasting relationships built on understanding our customers' needs.
Global companies benefit the most from ERP.
Global companies and those that share data regularly benefit the most from ERP. Nation-specific laws, currencies, and business practices embedded in the system enable it to translate sales transactions smoothly between business units in different countries—for example, a company in Taiwan and its customer in Brazil.
ERP simplifies customer interaction and speeds production with its configure-to-order capabilities. Customers ordering online or through a sales rep can quickly choose from a variety of options, for which a bill of material is automatically generated and sent to production. National Park Service employees log on to a special segment of Vanity Fair's Web site to purchase their uniforms. Vanity Fair's ERP system makes sure the items selected are approved and automatically debits their clothing allowance. Walmart's 5000 suppliers can link directly to the data warehouse to see how its products are selling and decide when to replenish the stock.
Data entered once into an ERP system, say from manufacturing, need not be reconciled with accounting or warehouse records because the records are all the same. With broader, more timely access to operating and financial data, ERP systems encourage flatter organizational structures and more decentralized decision making. At the same time, they centralize control over information and standardize processes. Standardized transactions make businesses more efficient; shared data makes them more creative.
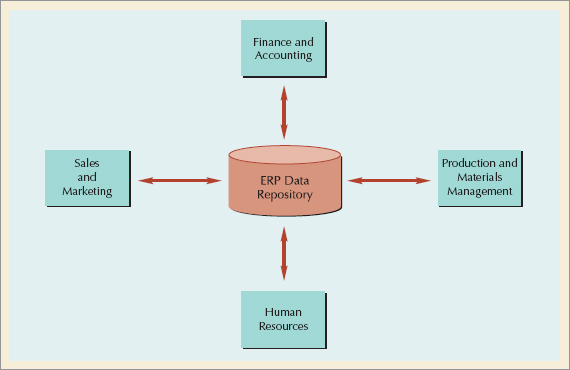
ERP systems consist of a series of application modules that can be used alone or in concert. The modules are fully integrated, use a common database, and support processes that extend across functional areas. Transactions in one module are immediately available to all other modules at all relevant sites—corporate headquarters, manufacturing plants, suppliers, sales offices, and subsidiaries.
Although ERP modules differ by vendor, they are typically grouped into four main categories: (1) finance and accounting, (2) sales and marketing, (3) production and materials management, and (4) human resources. Figure 15.11 shows the type of information that flows between customers, suppliers, and these various functional areas.
Finance/Accounting
The finance and accounting module encompasses financial accounting, investment management, cost control, treasury management, asset management, and enterprise controlling. Included are cost centers, profit centers, activity-based costing, capital budgeting, and profitability analysis, as well as enterprise measures of performance. The finance module provides consistent financial data that is updated in real time and that links operational results with the financial effects of those results. For every physical transaction, the financial result is shown.
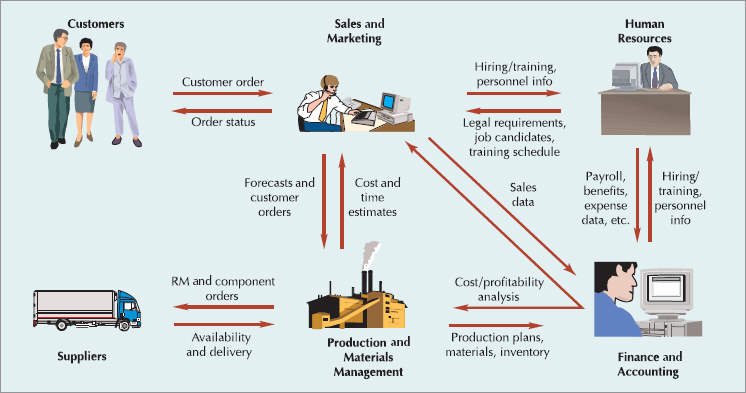
Figure 15.11. Organizational Data Flows: Source: Adapted from Joseph Brady, Ellen Monk, and Bret Wagner, Concepts in Enterprise Resource Planning (Boston: Course Technology, 2001), pp. 7–12.: Note: The flow between HR and Production is similar to that between HR and Sales. It was eliminated from the figure to simplify the diagram.
Sales/Marketing
The sales and marketing module supports customer-related activities such as order processing, product configuration, and delivery quotations. Pricing, promotions, availability, and shipping options are determined as sales orders are entered. The sales module allows for profitability analyses based on different pricing designs with discounts and rebates, and the projection of accurate delivery dates. It can also look into the company's finished goods and work-in-process inventories as well as material availability to determine how quickly an order can be filled. Managers can reserve inventory for specific customers, request certain supplier options, and customize orders. Distribution requirements, transportation management, shipping schedules, and export controls are included in the module, as are billing, invoicing, rebate processing, product registrations, and customer complaints. Distribution is coordinated more closely with manufacturing and sales in order to maintain customer delivery schedules.
Production/Materials Management
The production and materials management module is set up to handle all types of manufacturing processes—make-to-order, assemble-to-order, repetitive, and continuous. The module interfaces with CAD programs; performs process planning, bill-of-material processing, and product costing; processes engineering change orders; plans material requirements (MRP); allocates resources; and schedules and monitors production. Kanbans, Gantt charts, master schedules, and available-to-promise are all supported. It links sales and distribution to materials management, production planning, and financial effects in real time. Inventory is adjusted instantly and resource planning is done on a daily basis. Materials management refers to supply chain related activities such as purchasing, inventory and warehouse functions, supplier evaluations, just-in-time (JIT) deliveries, and invoice verification.
Human Resources
The human resources module covers all personnel management tasks, including workforce planning, employee scheduling, training and development, payroll and benefits, travel expense reimbursement, applicant data, job descriptions, organization charts, and workflow analysis. It provides a database of personnel, maintains salary and benefits structures, and does payroll accounting as well.
Together, these modules form an integrated information technology strategy for effectively managing the entire enterprise. ERP connects processes that belong together, giving every employee fast, convenient access to the information required for their jobs. As shown in Figure 15.12, ERP creates a central depository for the company's data, which enables the company to perform various business analyses. A company can quickly access data in real time related to forecasting and planning, purchasing and materials management, product distribution, and accounting and financial management, so that it can deploy its resources quickly and efficiently. It can help schedule its production capacity to meet demand and reduce inventory levels. By consolidating information from sales the company can better negotiate contracts and product prices, and determine their effect on the company's financial position. These types of decisions often require advanced analytical capabilities collectively called business intelligence.
Both the scope and detail of ERP systems are impressive. In addition to the four major mod-ules in an ERP system, there are hundreds of functional support modules. Many of the systems are table-driven, with over 8000 tables to configure. As might be expected, these systems require considerable time and skill to implement. In the next section, we discuss issues in implementation.
Business intelligence sifts through data to find patterns and predict behavior.
ERP implementation has a checkered history of mammoth projects over budget and out of control. Dow Chemical spent half a billion dollars and seven years implementing an ERP system that it is now overhauling. FoxMeyer Drug claims that ERP implementation sent it into bankruptcy.
ALONG THE SUPPLY CHAIN
Under Armour at the Top of Their Game with ERP
Under Armour (UA) is a sports apparel company launched by a University of Maryland football player to market a new type of athletic shirt that fits tightly and wicks away moisture. The innovative new product was a hit with teammates and other athletes, and quickly found its way onto the shelves of Dick's Sporting Goods, creating an entirely new market for what has come to be known as "performance sports apparel." Today, Under Armour sells its products via the Internet, catalogs, and 17,000 sporting goods stores worldwide. In direct competition with giants Nike, Adidas, and Columbia Sportswear, it holds a 74% market share and boasts an average annual growth rate of 40% over the past 12 years.
Having a great product is only one avenue to success. Keeping costs down, suppliers reliable, and customers satisfied is equally important. For Under Armour, that means investing in IT for its business. CEO and founder Kevin Plank says, "We run this company much like a team. Sales and marketing is like offense. Manufacturing and distribution is like defense. Finance and IT are like our special teams." (The Today Show, NBC, 4/15/09)

For its ERP system, Under Armour chose an out-of-thebox product with SAP'S Apparel and Footwear Solution for Consumer Products. Because the software had widespread use in the apparel industry (including Nike, Adidas, and Columbia Sportswear), UA proceeded with confidence to implement the system without modification. Eight months later with the help of a 20-person implementation team and implementation partner, Metamor, Under Armour had finished the implementation process. The company was careful to schedule three mock "go-lives" to accelerate personnel training and anticipate any problems with the changeover by testing in a safe environment without affecting ongoing operations.
The apparel industry is marked by rapid product introductions, seasonal demand, and lengthy supply chains. To meet customer due dates, increase inventory turns, and minimize markdowns, the supply chain must be both fluid and tightly controlled. SAP brought ATP (available-to-promise) functionality to Under Armour's supply chain and enabled the company to allocate inventory across customers and suppliers worldwide. UA can now close its books faster, bring new operations or countries online more readily, and make faster, more knowledgeable decisions with real-time data.
For those activities not covered in SAP'S basic software, UA chose outside vendors Dassault Systemes for PLM (product lifecycle) software and Oracle for ED1 (electronic data interchange) to electronically exchange key documents with suppliers. Both systems were implemented quickly and efficiently. Together these systems help Under Armour stay at the top of its game.
Think about the types of products offered and customers served by UA. What information and functionality would be needed for different market segments and customers?
Under Armour is not a patented product. How can UA retain its dominance in performance apparel against competitors who now offer similar products?
Sources: Adapted from Trey Palmisano, "From Rags to Microfiber: Inside the Rapid Rise of Under Armour," Sports Illustrated, April 2009; Merrill Douglas, "Jim Calo: Under Armour's Over Achiever," Inbound Logistics, September 2007; Beth Stackpole, "PLM's Vertical Challenge," Managing Automation, February 2008; and Maroushka Kanywani "Why Under Armour Selected SAP," Dashboard Insight, January 2009.
ERP vendors and their customers have learned from these debacles, and the second-generation ERP systems are substantially different from the first generation.
New ERP offerings sport stand-alone modules and open architecture. Companies can pick and choose the modules they want to install and can even choose a collection of modules from different vendors—the best-of-breed approach. While single-source ERP systems are easier to integrate, best-of-breed systems may provide a better match with organizational needs. Table 15.7 lists several enterprise software vendors and their area of expertise.
ERP implementation involves: (1) analyzing business processes, (2) choosing the modules to implement, (3) aligning the level of sophistication, (4) finalizing delivery and access, and (5) linking with external partners.
• Best-of-breed: refers to the selection of ERP modules from different vendors.
Table 15.7. Selected Enterprise Software Vendors and Their Area of Expertise
Specially | |
|---|---|
Large enterprise discrete manufacturing ERP, SCM | |
Large enterprise discrete manufacturing and services | |
3. Oracle's PeopleSoft | Human resources and employee relationship management |
4. Oracle's Siebel Systems | |
Supply chain management (SCM) | |
5. PTC, EDS, Dassault Systems | |
8. SCT | Process industry; education; energy |
Multinational midmarket manufacturing | |
Small to midmarket ERP, CRM |
Analyze Business Processes
Analyzing business processes is the first step in implementation. Since ERP is an integrated technology that pervades and connects all parts of a company, it usually alters the way a company makes decisions; thus, its implementation typically requires major changes in a company's organizational structure and business processes. Companies that have had success with ERP have taken the time to think about how their processes work and how they can best be integrated before "automating" them. To guide companies in this massive project, ERP vendors have designed their software around best practices for specific industries. Solution maps and stories of successful implementations are available for such industries as aerospace and defense, apparel, automotive, chemicals, consumer products, engineering and construction, health care, high-tech industries, insurance, media, oil and gas, pharmaceuticals, the public sector, real estate, retail, telecommunications, and utilities. Companies can either use the software as a blueprint for how their processes should operate and adjust their processes, or they can map out their own business processes and customize the software accordingly. Most companies try a combination of these approaches.
Choose Modules to Implement
Determining which ERP modules to implement and how they should be configured is a process-oriented (rather than technology-oriented) decision. The decision should be guided by questions such as: (1) Which processes have the biggest impact on customer relations? (2) Which processes would benefit the most from cross-functional or interorganizational integration? (3) Which processes should be standardized throughout the organization and which should be allowed to vary?
Small-market and midsize-market companies with time and budget constraints have an especially hard time implementing ERP. In response, software vendors like SAP have created a fast-track approach to ERP implementation. Based on the processes and applications that have proved most successful in the past, SAP has created 11 industry-specific best-practices templates designed to maximize efficiency and minimize customization. Plain vanilla, template-based modules chosen by the client are provided at a fixed price and implemented over a fixed timetable. The results are impressive. eCompany installed fully functional ERP modules for materials management, function planning, finance, and online retailing in three weeks for less than $200,000. Interactive Apparel implemented SAP's materials management, sales and distribution, warehouse management, and financial modules in nine weeks for less than $150,000.
Align Level of Sophistication
Knowing the level of sophistication needed for your business is also key to effective ERP implementation. QAD, a midmarket ERP vendor, offers industry specific software to manufacturing companies and international clients. QAD software can be directed with instructions much simpler than those of larger ERP vendors. Instead of deploying a single system to manage all of a company's plants, QAD tailors its software to individual plants, then links them with corporate financial, distribution, and support functions. Since 65% of QAD's customers are international, its software incorporates different countries' methods for invoicing, accounting, and amortization. For example, QAD uses a model to decide how an incoming order from a trading partner should be handled, automatically processing transactions across enterprises, languages, and customs. QAD is known for both its ease of implementation and ease of use.
The Internet provides another aid to implementation. ERP vendors, including Oracle, and SAP, now offer their products through portals. The vendor hosts the application, which the customer accesses over the Internet with their browser. Portals are less expensive, so they give midsize market and smaller clients access to the same services as larger corporations. ERP services can also be accessed through third-party application service providers (ASPs). Redback Networks, for example, uses Qwest CyberSolutions to access Oracle's suite of enterprise solutions, including finance, order management, human resources, manufacturing, shipping, and inventory systems.
Link with External Partners
The value of e-business relies on a company's ability to integrate its internal processes with external suppliers, customers, and companies. First-generation ERP systems lacked the ability to interact outside the organization with other ERP systems, with e-businesses, or directly with customers. By the second generation of ERP, vendors had learned to create Web-centric systems by consolidating data and allowing dynamic access from various clients. Software vendors have developed powerful new analytic tools and applications that capitalize on ERP's infrastructure. Examples of such software systems are customer relationship management, supply chain management, and product lifecycle management.
Perhaps no new application reinforces the changing focus of ERP better than customer relationship management. Customer relationship management (CRM) software plans and executes business processes that involve customer interaction, such as marketing, sales, fulfillment, and service. CRM changes the focus from managing products to managing customers. With the advent of e-commerce, companies have the opportunity to sell directly to the customer. Marketing can be personalized to individual preferences and behaviors. A wealth of data on customer buying behavior is available from records of purchases and analysis of clickstreams. Special events, such as holidays or product promotions, can trigger customer purchases. Point-of-sale data from physical stores, mail-order purchases, and online purchases are monitored. All of these data go into a data warehouse, where they are analyzed for patterns (called data mining) from which predictions of future behavior are made.
Prospect information, customer profiles, sales-force automation, and campaign modules for direct mail and special sales promotions are managed with CRM. In addition to collecting and analyzing customer data, CRM provides decision support for forecasting demand, demand management, pricing products and services, quoting order delivery dates, and planning for customer service needs. Customer service includes tracking and tracing orders, returns, repairs, service, and warranty management. CRM interacts with supply chain management (SCM) software and ERP to ensure prompt and accurate order fulfillment, and to plan for future requirements.
• Customer relationship management (CRM): software that plans and executes business processes involving customer interaction, such as sales, marketing, fulfillment, and customer service.
As discussed in Chapter 10, supply chain management (SCM) software includes supply chain planning, supply chain execution, and supplier relationship management. Planning involves designing the supply chain network, demand planning, and collaborative supply planning. Execution involves fulfillment, manufacturing, and delivery. Relationship management handles all the interactions with suppliers from supplier certification to quality assurance, contracts, and agreements.
• Supply chain management (SCM): software that plans and executes business processes related to supply chains.
From the above list you can see that the distinction between business software applications has become increasingly blurred as ERP vendors are adding more SCM functions, and SCM vendors are encroaching on ERP. SAP, whose ERP applications, R /3, runs most Fortune 500 companies, is now concentrating on e-business with new offerings in supply chain management, customer relationship management, and product lifecycle management. i2 technologies, a leader in supply chain management software, has incorporated ERP functions into its TradeMatrix software. Oracle, a leader in e-business software and databases, emphasizes CRM, B2B, and business intelligence.
• Product lifecycle management (PLM): software that manages the product development process, product lifecycles, and design collaboration with suppliers and customers.
A new entry into business application software is product lifecycle management (PLM). PLM manages product data through the life of the product, coordinates product and processes redesign, and collaborates with suppliers and customers in the design process.
PLM, CRM, ERP, and SCM make a powerful combination. Figure 15.13 shows how these types of software systems can work together. Customer and supplier collaboration on design with PLM can reduce time to market for new products and services. Similarly, customer and supplier collaboration in manufacturing via ERP helps speed the product to the customer. Design and manufacture collaborate in the DFMA (design for manufacture and assembly) process discussed in Chapter 4.
Getting ERP, PLM, CRM, and SCM systems talking to each other within a company is difficult. Getting them to communicate across hundreds of different companies and vendors is a daunting task. Using the same suite of products from one vendor facilitates integration, but most companies prefer a best-of-breed approach, buying the products or modules that best fit their business from a variety of vendors. It is common for e-business applications to come with application programming interfaces (APIs) that give other programs well-defined ways of speaking to them. But APIs that allow communication between application A and application B are overwhelmed when applications C, D, and E are added to the exchange. Enter third-party vendors that offer enterprise application integration (EAI). This software breaks down a complex business process into a series of transactions between applications. It then brokers those transactions in language each application can understand. That language is most likely XML (for extensible markup language); newer software uses XML extensively.
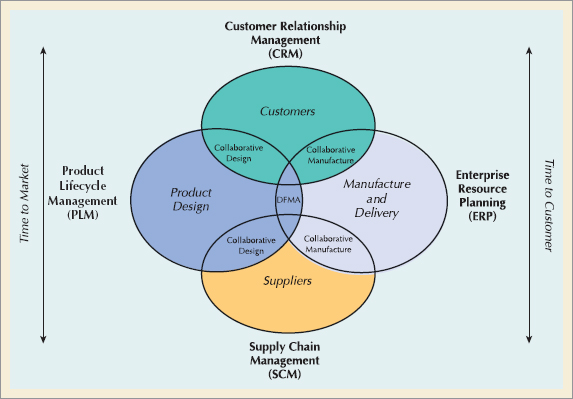
Figure 15.13. ERP and Related Software Systems Source: Adapted from George Shaw, "Building the Lean Enterprise: Reducing Time to Market." Industry Week (Webcast, June 14, 2001), http://www.industryweek.com/Events/TimeToMarket/pent0614.html.
• XML: the business language of the Internet.
Electronic data interchange (EDI) used to be the language of business-to-business communication. While EDI is good at transmitting orders and invoices, it cannot change product descriptions, transmit product drawings, update in real time, or easily communicate with ERP systems. XML, on the other hand, was built for the Internet. Instead of downloading data from one system and reentering it into another, XML tags each chunk of data—such as part number, price, and delivery date—before sending it to a trading partner. The receiving XML-run system picks out the data by its tag and inserts it into the proper place in its ERP system. Thus, Web sites can communicate with Web sites, computers with computers.
Connectivity and integration will continue to be an issue as new technologies emerge. IBM estimates that 70% of all code written today consists of interfaces, protocols, and other procedures to establish linkages among various systems.
For many companies, purchasing an ERP software package means paying too much money for features and functionality they will never use. Recent trends in software engineering, such as SOA, can provide relief. Service-oriented architecture (SOA) is a collection of "services" that communicate with each other within software or between software. Clients can bundle together the services that they need and do not need to purchase the entire software system. These systems can be more flexible and efficient than current offerings, but they can also cost more to customize. SOA radically changes how software is designed, offered, sold, and used. Software vendors like the ability to reuse and share services across clients and business services. SOA also provides a means to deploy and quickly re-configure applications as business conditions change.
• Service-oriented architecture (SOA): service-oriented architecture.
We have seen that ERP software can be quite expensive and time consuming to install, maintain and operate. The decomposition of large software systems into services has prompted another revolution in the way software is delivered to customers. Many companies prefer accessing business software, such as ERP or CRM, from the vendor's site or a third-party host site, instead of installing, running and maintaining it in-house. This approach, known as software as a service (SaaS), is gaining popularity in both large and small companies. In addition to providing the software on-demand to its clients, vendors or third party providers also maintain and run the IT infrastructure, including the networks, servers, operating systems, and storage necessary to run the software. This broader view of on-demand IT services, usually delivered by a provider over the Internet, is known as cloud computing. Salesforce was the first business software vendor to successfully use cloud computing in the CRM market, followed by NetSuite for e-commerce and financials. Today's larger ERP vendors are also en-tering the SOA and SaaS arena. For example, SAP offers NetWeaver as its technology platform for SOA and Business ByDesign for small to mid-sized businesses who are interested in SaaS.
• Software as a service (SaaS): software as a service.
• Cloud computing: on-demand IT services.
Material requirements planning (MRP) is a computerized inventory control and production planning system. It has enjoyed widespread use in industry, primarily for batch manufacturing, as an information system that improves manufacturing decision making. MRP began as a system for ensuring that sufficient material was available when needed. However, in application, it became clear that material was not the only resource in short supply. Planning capabilities for machine and labor resources were added to the system in the form of capacity requirements planning (CRP).
MRP requires input from other functional areas of a firm, such as marketing and finance. As these areas began to see the power of a common database system, they encouraged the expansion of MRP into areas such as demand forecasting, demand management, customer order entry, accounts payable, accounts receivable, budgets, and cash flow analysis. Clearly, this enhanced version was more powerful than the original MRP system that ordered material and scheduled production. It provided a common database that the entire company could use. Its what if? capability proved invaluable in evaluating tradeoffs, and the easy access to information encouraged more sophisticated planning. Thus, MRP evolved into a more comprehensive enterprise resource planning system, or ERP.
ERP is a powerful software system that organizes and manages business processes across functional areas. In addition to managing all sorts of back-office functions, ERP connects with supply chain and customer management applications, helping businesses share information both inside and outside the company. ERP is essential to e-business initiatives and to related software systems, such as customer relationship management (CRM), supply chain management (SCM), and product lifecycle management (PLM).
assemble-to-order a manufacturing environment in which major subassemblies are produced in advance of a customer's order and are then configured to order.
backward scheduling scheduling backward from a due date to determine when to begin a job.
best-of-breed the selection of ERP modules from different vendors.
bill of material (BOM) a list of all the materials, parts, and assemblies that make up a product, including quantities, parent– component relationships, and order of assembly.
capacity the maximum capability to produce.
capacity requirements planning (CRP) a computerized system that projects the load from a given material plan onto the capacity of a system and identifies underloads and overloads.
cloud computing on-demand IT services usually delivered over the Internet.
cumulative lead time the total length of time required to manufacture a product; also, the longest path through a product structure.
customer relationship management (CRM) software that plans and executes business processes that involve customer interaction, such as sales, marketing, fulfillment, and customer service.
cycle counting a method for auditing inventory accuracy that counts inventory and reconciles errors on a cyclical schedule rather than once a year.
efficiency how well a machine or worker performs compared to a standard output level.
enterprise resource planning (ERP) software that organizes and manages a company's business processes by sharing information across functional areas.
expedite to speed up orders so that they are completed in less than their normal lead time.
explosion the process of determining requirements for lower-level items by multiplying the planned orders of parent items by the quantity per assembly of component items.
forward scheduling scheduling forward from today's date to determine the earliest time a job can be completed.
item master file a file that contains inventory status and descriptive information on every item in inventory.
load the standard hours of work assigned to a facility.
load leveling the process of balancing underloads and overloads.
load percent the ratio of load to capacity.
load profile a chart that compares released orders and planned orders with the capacity of a facility.
lot sizing determining the quantities in which items are usually made or purchased.
master production schedule (MPS) a schedule for the production of end items (usually final products). It drives the MRP process that schedules the production of component parts.
material requirements planning (MRP) a computerized inventory control and production planning system for generating purchase orders and work orders of materials, components, and assemblies.
modular bill of material a special bill of material used to plan the production of products with many optional features.
netting the process of subtracting on-hand quantities and scheduled receipts from gross requirements to produce net requirements.
periodic order quantity a lot sizing technique that orders at set time invervals.
product lifecylce management (PLM) software that manages the product development process, product lifecycles, and design collaboration with suppliers and customers.
product structure file a file that contains computerized bills of material for all products.
Software as a service (SaaS) software as a service; on-demand access of software from a provider's site
SOA service oriented architecture; a software architecture that bundles together stand-alone services.
supply chain management (SCM) software that plans and executes business processes related to supply chains.
time fence a date specified by management beyond which no changes in the master schedule are allowed.
time-phased bill of material an assembly chart shown against a time scale.
time phasing the process of subtracting an item's lead time from its due date to determine when an order should be released.
utilization the percentage of available working time that a worker spends working or a machine operating.
XML extensible markup language; used to help different ERP systems communicate over the Internet.
15-1. Describe a production environment in which MRP would be useful. Describe a production environment in which MRP would not be useful.
15-2. Explain with an example the difference between dependent and independent demand.
15-3. What are the objectives, inputs, and outputs of an MRP system?
15-4. How is a master production schedule created, and how is it used?
15-5. What is the purpose of phantom bills, K-bills, and modular bills of material?
15-6. What type of information is included in the item master file?
15-7. Describe cycle counting. How does it improve inventory performance?
15-8. Describe the MRP process, including netting, explosion, lot sizing and time phasing.
15-9. What are the inputs to capacity requirements planning? Discuss several alternatives for leveling the load on a facility.
15-10. Discuss several assumptions of MRP and how they are being relaxed with new technology.
15-11. Explain how MRP could be applied to (a) the surgery suite of a hospital, (b) scheduling university classes, (c) a chain of restaurants, and (d) hotel renovations.
15-12. How does MRP differ from ERP? Find a description of an MRP module from a software vendor.
15-13. Access the Web site of an ERP vendor such as Oracle, SAP, Infor, i2 Technologies or QAD. Make a list of the modules available. Choose one module to describe in detail.
15-14. What are the capabilities of customer relationship management (CRM) software? How do ERP and CRM relate?
15-15. What are the capabilities of supply chain management software? How do ERP and SCM relate?
15-16. Compare the ERP/CRM/SCM offerings of two different software vendors.
15-17. What is PLM? How does it relate to other business software?
15-18. Describe how the ERP systems from two different companies can converse.
15-19. While there are numerous ERP software vendors, the two largest are SAP and Oracle. Find out how these two companies compete, and compare their customers and product offerings.
15-20. Discuss the scope of ERP and difficulties in implementation.
15-21. Interview managers at three companies in your area about their use of ERP. How have their experiences been similar? What accounts for the similarities and differences?
15-22. APICS is a professional organization for operations management. Find out if there is a local APICS chapter in your area. Attend a meeting and write a summary of the speaker's comments.
15-23. From articles in recent business magazines, describe the newest trends in e-business software.
Complete the following MRP matrix for item X.
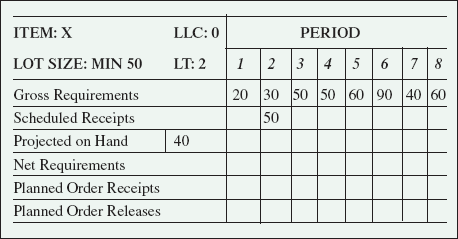
In what periods should orders be released, and what should be the size of those orders?
How would your answer change if the cost of ordering item X were $100, the cost of carrying were $2 a week, and the POQ lot sizing technique were used?
Which lot sizing technique yields the lowest total cost?
SOLUTION
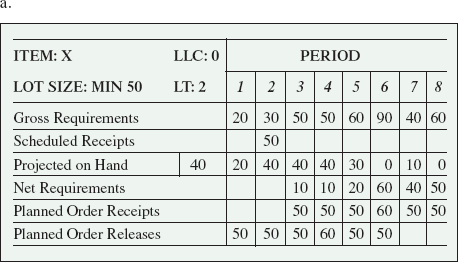
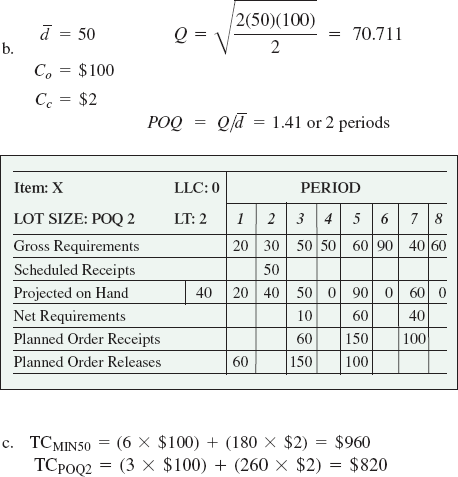
Choose the POQ lot sizing technique
15-1. Referring to the product structure diagram for product A determine:
how many K's are needed for each A.
how many E's are needed for each A.
the low-level code for item E.
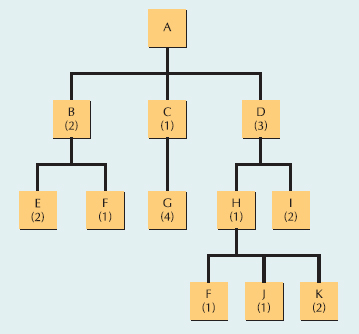
15-2. Construct a multilevel bill of material for product Z. How many Us are needed to make each Z? How many Ws are needed to make each Z?
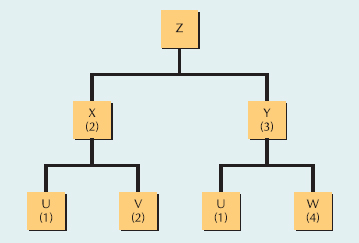
15-3. The classic One-Step step stool shown to the right is assembled from a prefabricated seat (with bolts attached), one bottom leg, one top leg, five nuts, and four leg tips. Construct a product structure diagram for the One-Step step stool. Be sure to include subassemblies that are formed as part of the assembly process.
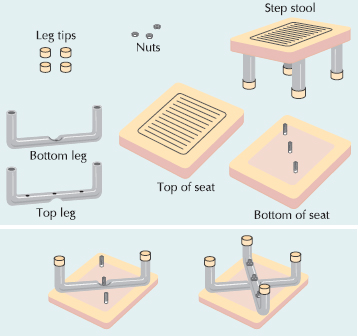
15-4. Draw a product structure diagram from the following bill of materials and calculate how many D's are needed for each A.
Level | Item | Quantity |
|---|---|---|
0 | A | 1 |
−1 | B | 2 |
−−2 | D | 3 |
−−2 | E | 2 |
−1 | C | 4 |
−−2 | D | 3 |
−−2 | F | 1 |
15-5. Product A is assembled from two units of S1 and three units of S2. S1 is made of one unit of C1, four units of C2, and one unit of C3. S2 is made of three units of C2 and two units of C3.
Draw a product structure diagram for product A.
How many C3's are needed to fill an order for 100 A's?
Assume no inventory on hand, products take one day to assemble, subassemblies take two days and components take three days. When should an order be released for C3 if the 100 A's are needed by day 7?
15-6. The popular Racer Scooter comes in a variety of colors with lots of options. The customer can choose one of four color wheels, one of three sizes (small, medium, or large), and whether or not to have shocks, a wheelie bar, foam handles, racing stripes, lights, sound effects, a carrying strap, or a carrying bag.
How many different scooters can be made from the various options? Construct a modular bill of material for the Racer Scooter. How many items are in the modular bill? What are the pros and cons of giving the customer so many choices?
15-7. Draw a product structure diagram from the bill of material for an Xavier skateboard shown below. Assuming a 10% profit margin, how should the Xavier be priced?
Level | Item | Quantity | Price |
|---|---|---|---|
0 | Skateboard | 1 | |
−1 | Deck | 1 | $54.90 |
−1 | Grip tape | 1 | $ 4.95 |
−1 | Wheel assembly | 2 | − |
−−2 | Wheels | 2 | $ 8.95 |
−−2 | Bearings | 4 | $ 4.95 |
−−2 | Truck | 1 | $33.90 |
−1 | Nuts and Bolts | 4 | $ 1.99 |
−1 | Riser | 2 | $ 3.95 |
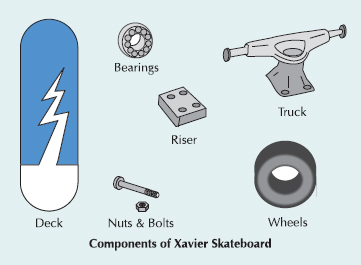
15-8. The Best Wheels Bicycle Company produces bicycles in different styles for boys and girls, in heights of 26 inches or 20 inches, and with 10 speeds, 3 speeds, or 1 speed.
How many different kinds of bicycles does Best Wheels make?
Construct a modular bill of material for Best Wheels (one level). Assume that bike sales are equally split between boys and girls, 26-inch bikes are preferred two-to-one to 20-inch bikes, and 3-speed bikes account for only 20% of sales. The remaining sales are divided equally between 10-speed and 1-speed bikes.
If bicycle sales are expected to reach 10,000 over the holiday shopping season, how many 26-inch bikes should Best Wheels plan to produce? How many 10- speed bikes?
15-9. From the product structure diagram for item X shown at the top of the next column, determine how many of each lower-level items (B through I) are needed to fill an order for 50 X's.
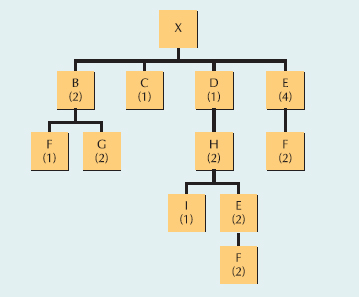
15-10. The Alpha Beta Company produces two products; A and B, that are made from components C and D. Given the following product structures, master scheduling requirements, and inventory information, determine when orders should be released for A, B, C, and D and the size of those orders.
On Hand | Schedules Receipts | Lot Size | MPS | |
|---|---|---|---|---|
A | 10 | 0 | L4L | 100, period 8 |
B | 5 | 0 | L4L | 200, period 6 |
C | 140 | 0 | Mini 50 | − |
D | 200 | 250, period 2 | Mult 250 | − |
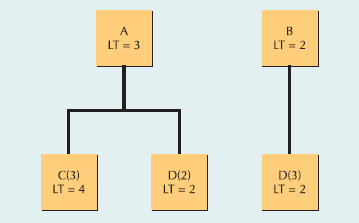
15-11. Kid's World sells outdoor play equipment for children. One of its most popular items is a 5-foot by 7-foot wooden sandbox shown below. General assembly instructions follow.
Assembly Instructions: The wood pieces for the sandbox are ordered precut and treated. Kid's World sands the wood, drills several holes in each piece as required for assembly, and coats each piece with 2 ounces of water sealer. The sides are then assembled one corner at a time by attaching a 1-foot wood strip cater-corner between a 5-foot and 7-foot side. Four bolts are inserted through the predrilled holes and secured with nuts. After the left and right corners of the sandbox have been assembled, the two pieces are joined in a similar manner to form the box assembly. A triangular-shaped wooden seat is attached to each corner of the box assembly with four flat-headed nails for each seat. The sandbox is now complete.
Construct a multilevel bill of material for the sandbox.
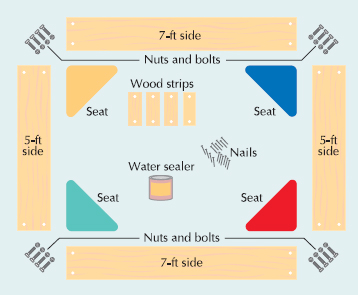
15-12. Complete the following MRP matrix for item A:
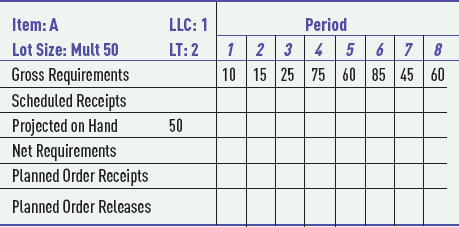
15-13. Complete the following MRP matrix for Item X. Determine when orders should be released and the size of those orders.
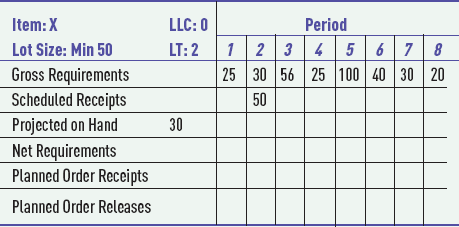
15-14. Files and More, Inc. (F&M), a manufacturer of office equipment, uses MRP to schedule its production. Because of the current recession and the need to cut costs, F&M has targeted inventory as a prime area for cost reduction. However, the company does not want to reduce its customer service level in the process. Demand and inventory data for a two-drawer file cabinet are given in the following table. Complete an MRP matrix for the file cabinet using: (a) L4L, (b) EOQ, and (c) POQ lot sizing. Which lot-sizing rule do you recommend?
Period | 1 | 2 | 3 | 4 | 5 |
|---|---|---|---|---|---|
Demand | 20 | 40 | 30 | 10 | 45 |
Ordering cost = $100 per order
Holding cost = $1 per cabinet per period
Lead time = 1 period
Beginning inventory = 25
15-15. F&M's best-selling item is a standard office desk. The desk consists of four legs, one top, one drawer, two side panels, one back panel, and two drawer guides, as shown below. Each side is assembled from a side panel, two legs, and a drawer guide. The base is formed from the back panel and two sides. In final assembly, the top is attached to the base and the drawer is slid into place. Lead times are two days for purchased items and one day for assembled items:
Construct a time-phased assembly chart for the desk.
With no inventory on hand, how long would it take to complete a customer order?
The desk sides, back, and drawer are metal. The top is woodgrain. F&M is considering making the desk top in its own factory. The top would take four days to manufacture. Would making the desk top in-house affect the time required to fill a customer order?
F&M's customers like the desk and its price, but would like to be able to get desks in three days. Which items should F&M keep in inventory to fill an order in three days?
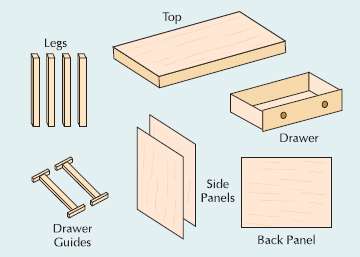
15-16. Given 150 units of beginning inventory, a lead time of one period, an ordering cost of $400 per order, and a holding cost of $2 per unit per period, determine which lot sizing technique would result in the lowest total cost for the following demand data.
Period | 1 | 2 | 3 | 4 | 5 | 6 | 7 | 8 |
|---|---|---|---|---|---|---|---|---|
Gross Requirements | 100 | 90 | 85 | 70 | 150 | 200 | 300 | 250 |
15-17. Given an ordering cost of $200, a holding cost of $2 per unit, and a negligible lead time, examine the following demand patterns and predict which lot sizing technique would result in the lowest total cost. Verify your predictions.
Period
1
2
3
4
Gross Requirements
50
50
50
50
Period
1
2
3
4
Gross Requirements
50
10
50
10
Period
1
2
3
4
Gross Requirements
50
50
10
10
Period
1
2
3
4
Gross Requirements
50
10
10
50
15-18. Daily demand for an item is shown here. Assume a holding cost of $0.50 per unit per day, a setup cost of $100 per setup, a lead time of one day and 70 units on hand. Determine when a work order should be released for the item and the size of the order using the L4L, EOQ, and POQ lot sizing techniques. Which technique produces the lowest total cost?
Period | 1 | 2 | 3 | 4 | 5 | 6 | 7 | 8 | 9 | 10 |
|---|---|---|---|---|---|---|---|---|---|---|
Gross Requirement | 50 | 30 | 25 | 35 | 40 | 50 | 35 | 45 | 70 | 75 |
15-19. Product A is assembled from one B and two C's. Each item requires one or more operations, as indicated by the circles in the product structure diagram. Assume lead time is negligible. From the information given:
Develop a load profile chart for each of the three work centers.
Level the loads. Discuss possible consequences of shifting work to other periods.
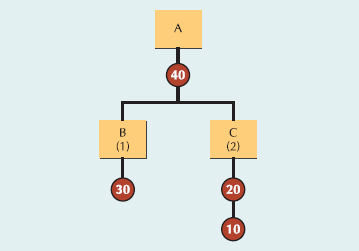
MASTER PRODUCTION SCHEDULE
Period | 1 | 2 | 3 | 4 | 5 | 6 |
|---|---|---|---|---|---|---|
Product A | 100 | 150 | 100 | 200 | 100 | 100 |
ROUTING AND WORK STANDARDS FILE
Operation | Item | Work Center | Standard Time per Unit (hr) |
|---|---|---|---|
10 | C | Machining | 0.50 |
20 | C | Heat treat | 2.00 |
30 | B | Machining | 1.00 |
40 | A | Assembly | 0.40 |
15-20. Sitting on Maggie Brumfield's desk is the latest planned order report from the company's MRP system. Maggie's job is to determine if there is enough capacity to handle the workload and to level the load if it's uneven. She gathers the latest cost figures and gets to work. Subcontracting and hiring extra workers are not options at this point, but overtime, pulling work ahead, and postponing work are. Regular production costs $10 an hour and is limited to 40 hours a week. Overtime costs $15 an hour and cannot exceed 40 extra hours (i.e., a double shift). An inventory cost of $3 per period is assessed for each hour's worth of work performed in advance. Postponing work costs $20 per item per period.
Use the following information to construct an initial load summary chart. Level the loads. Then create a revised chart that meets demand at the least possible cost. How much money is saved by economically leveling the load?
PLANNED ORDER REPORT
Item | Week | |||
|---|---|---|---|---|
1 | 2 | 3 | 4 | |
A | 90 | |||
B | 100 | 250 | ||
C | 600 | 160 | ||
D | 0 | |||
PROCESSING TIMES
Item | Setup Time (min) | Run Time (min per unit) |
|---|---|---|
A | 15 | 3 |
B | 30 | 15 |
C | 50 | 10 |
D | 45 | 4 |
15-21. Pizza Express offers large pepperoni pizzas for $5 on Tuesdays from 5:00 to 9:00 in the evening. Three cooks are on duty during that time. The fixed cost for the four-hour period is $100. The variable cost is $2 per pizza.
If it takes 10 minutes to prepare each pizza, worker efficiency is approximately 95% and employees get a 10- minute break each hour, how many pepperoni pizzas can Pizza Express produce during its four-hour special?
Assuming all pizzas produced can be sold, is the promotion worth the effort?
15-22. Amy gets home from classes around 5 P.M. each day and can only reasonably work on her studies until midnight. She usually watches an hour of television to relax, works out for 30 minutes, and takes 30 minutes to eat dinner. She has found that if she takes a 5-minute break each hour, she can remain more focused. Today she feels 80% on task. Homework for the evening includes two critical analyses for Government, one thesis for American Lit, and three Spanish translations. Estimated processing times are shown below. Setup time includes time spent online gathering resources and finding reference books around the apartment.
What is Amy's effective capacity to do work this evening?
What is her load percent?
How would you suggest she adjust her capacity to complete her tasks on time?
Tasks | Setup Time | Processing Time per Task |
|---|---|---|
Government | 15 minutes | 40 minutes |
American Lit | 30 minutes | 120 minutes |
Spanish | 10 minutes | 30 minutes |
15-23. The Best Wheels Bicycle Company has scheduled the production of the following bicycles this month.
Model | Week | ||||
|---|---|---|---|---|---|
1 | 2 | 3 | 4 | ||
(B2610) | 26-inch 10-speed | 50 | 100 | 195 | 150 |
(B2003) | 20-inch 3-speed | 15 | 30 | 65 | 45 |
(B2001) | 20-inch 1-speed | 20 | 40 | 80 | 60 |
The two critical work centers for producing these bikes are welding and assembly. Welding has an efficiency of 95% and a utilization of 90%. Assembly has an efficiency of 90% and a utilization of 92%. The time required (in hours) by each bike in the two work centers is as follows:
Welding | Assembly | |
|---|---|---|
B2610 | 0.20 | 0.18 |
B2003 | 0.15 | 0.15 |
B2001 | 0.07 | 0.10 |
Assume 40 hours is available per week for each work center. Calculate the capacity and load percent per work center per week.
15-24. Bryan is Professor Russell's graduate assistant. He would like to leave for Spring Break tomorrow, but first he has to grade the midterm exams from four classes. These classes are new for Bryan, so he estimates his grading efficiency to be 80%. Professor Russell has estimated the time required to create the key and the time to grade each paper as shown below. Bryan anticipates that he'll need five hours of sleep, an hour to pack, an hour to get to the airport, an hour to post the grades, and three twenty minute breaks during the day for meals. Can Bryan finish his work and make it to the airport on time in a 24 hour day?
Class | Time to Create Key | Time to Grade Each Paper (mins) | # Papers |
|---|---|---|---|
1 | 10 | 2 | 35 |
2 | 15 | 5 | 50 |
3 | 5 | 1 | 60 |
4 | 20 | 10 | 25 |
15-25. Given the following master production schedule requirements and bill of labor, determine the work load in each work center for January. Given a 40-hour week and four weeks per month, how many workers would need to be assigned to each work center to meet demand? Assume parttime workers are available.
MASTER PRODUCTION SCHEDULE FOR JANUARY
Product | Units |
|---|---|
A | 60 |
B | 220 |
C | 140 |
BILL OF LABOR IN STANDARD HRS/UNIT
Product | Work Center 1 | Work Center 2 |
|---|---|---|
A | 1.70 | .50 |
B | 1.30 | .90 |
C | 1.80 | .66 |
Just ERP
Just Sofas (JS) had begun the year full of promise with a new facility, restructured manufacturing process, and high hopes for its new ERP system. Most of the domestic furniture manufacturers had long since gone overseas, but JS believed being close to the customer gave it a competitive edge. The workers had rallied behind President Ruffner's idea of guaranteed four-day deliveries on customer orders. And for a while, the promo had worked. Then orders began pouring in and the scheduling system imploded.
It was for just such a case that Ruffner had sought out an ERP system—to automatically handle customer orders, factory schedules, and supply chain coordination as demand varied. Ruffner had carefully chosen the ERP software package used by all the large corporations he knew of, reasoning that if successful companies had chosen this vendor, who was he to choose otherwise. Implementation had proceeded carefully as well, one might say painstakingly slow, as the IT staff started with the finance module and worked down through sales and marketing, order fulfillment, production planning, MRP, capacity planning, and finally scheduling. Actually, the scheduling module was still having the kinks worked out and the bill of materials file had not been updated to the current catalog offerings, but everything else seemed to be working fine.
Ruffner had included statements about the ERP system in his earnings reports for the past three quarters, noting that "productivity wanes as new IT system is being implemented," "earnings down as company adjusts to new ordering system," and "scheduling glitch causes backlog of customer orders." For this quarter, he was trying to put a more positive spin on "only 5% of orders shipped on time due to incomplete jobs waiting for materials that were not ordered as they should have been." He supposed a more innocuous "new scheduling system still not up to speed" would suffice. What Ruffner really wondered was if the company could survive another year like this one.
What capabilities of an ERP system would be useful for a company like Just Sofas?
Describe the environment under which the ERP system was being implemented. Was due diligence conducted in choosing the ERP vendor?
Does Ruffner understand the relationships between strategy and operations? Why or why not?
What problems contributed to the disappointing results of the ERP system? How would you suggest that Just Sofa proceed next year?
Hosuki
Hosuki, a small car maker, competes with larger manufacturers by building cars to order. The company has invested heavily in technology and close partnerships with suppliers. Customers enter their orders and choose their options on the company Web site. Hosuki's ERP system responds with an estimated cost and completion date. After the customer approves the order, Hosuki sets to work.
Quick response for Hosuki is dependent on collaborative manufacturing with its trading partners. A virtual bill of material for a typical car appears on the next page. Notice each item is color-coded to the supplier who is responsible for providing that item. Hosuki has full visibility into its suppliers' ERP systems to check on-hand quantities and order progress. These data are essential in quoting accurate due dates. Most of the car's components are purchased. Hosuki makes the body of the car, assembles the main components, and takes care of final inspection and testing. The machine that stamps out body parts operates eight hours a day.
Since the suppliers produce in high volume, the lead time for an order is the same regardless of the quantity of the order. In contrast, with limited sales volume and limited space, Hosuki assembles its cars in batches of 10. Each assembly process takes half a day. The setup times and run times per unit for the body stamping machine are given below.
Hosuki has just received its first corporate order—for 10 midsized vehicles. The company would like delivery as soon as possible.
Create a time-phased assembly chart to determine when the 10 cars can be delivered.
What adjustments are needed in inventory levels, lead times, and batch sizes to fill an additional customer order for five custom cars in five days?
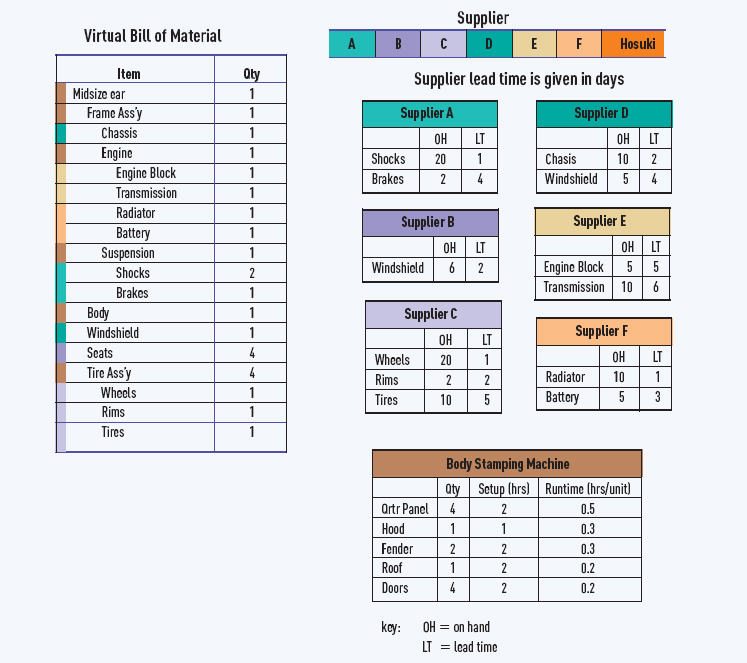
Bancroft, N., H. Seip, and A. Spungel. Implementing SAP R/3 Greenwich, CT: Manning, 1998.
Bond, B., Y. Genovese, et al. "ERP Is Dead—Long live ERP II." Gartner Advisory Research Note (October 4, 2000) http://www.gartner.com.
Brady, J., E. Monk, and B. Wagner. Concepts in Enterprise Resource Planning. Boston: Course Technology, 2001.
Bylinsky, G. "Heroes of U.S. Manufacturing." Fortune (March 19, 2001). http://www.fortune.com.
Curran, T., and G. Keller. SAP/3 Business Blueprint. Upper Saddle River, NJ: Prentice Hall, 1998.
Davenport, T. "Putting the Enterprise into the Enterprise System." Harvard Business Review (July/August 1998), pp. 121–131.
Davenport, T. Mission Critical: Realizing the Promise of Enterprise Systems. Boston: Harvard Business School Press, 2000.
ERP software vendors: www.sap.com, www.i2.com, www.oracle.com, www.QAD.com.
Kerstetter, J. "When Machines Chat." BusinessWeek (July 23, 2001), pp. 76–77.
Michel, R. "ERP Gets Redefined." MSI Magazine (February 1, 2001). http://www.manufacturingsystems.com.
Miller, D. "Tying It All Together." The Industry Standard Magazine (July 2, 2001). http://www.thestandard.net.
Orlicky, J. Material Requirements Planning. New York: McGraw-Hill, 1975.
Palitza, K. "SAP Lets ERP Fall Behind, Focuses on B2B." http://www.computerwire.com. Accessed October 29, 2001.
Pender, L. "Faster, Cheaper ERP." CIO Magazine (May 15, 2001). http://www.cio.com.
Peterson, K., K. Brant, et al. "Manufacturing Imperatives in Collaborative Commerce." Gartner Advisory Research Note (July 31, 2000). http://www.gartner.com.
Ptak, Carol. ERP: Tools. Techniques and Applications for Integrating the Supply Chain. Boca Raton, FL: St. Lucie Press, 200.
"Taking the Pulse of ERP." Modern Materials Handling (February 1, 2001). http://www.manufacturing.net/mmh.
Vollman, T. E., W. L. Berry, and D. C. Whybark. Manufacutring Planning and Control Systems, 3rd ed. Homewood, IL: Irwing, 1992.
Wight, O. Production Planning and Inverntory Control in the Computer Age. Boston: Cahners Books International., 1974.