
In this chapter, you will learn about . . .
Procesxds Planning
Process Analysis
Process Innovation
Technology Decisions

Web resources for this chapter include
OM Tools Software
Internet Exercises
Online Practice Quizzes
Lecture Slides in PowerPoint
Virtual Tours
Excel Worksheets
Excel Exhibits
Company and Resource Weblinks
www.wiley.com/college/russell
Processes and Technology FOR CHOCOLATE MANUFACTURING
CHOCOLATE IS DERIVED FROM THE CACAOTREE, native to Central and South America and transplanted long ago to the equatorial regions of Africa. The fruit of the cacao tree is a football-shaped pod which contains 20 to 40 seeds, called cacao beans, inside. The pods are harvested by hand (usually twice a year) and sliced open with machetes. The cacao beans and pulp are scooped out, heaped into piles or specially made boxes, and covered with banana leaves to ferment for three to nine days. Fermentation is complete when the white beans have turned a rich brown color. The fermented beans are placed on drying racks or bamboo mats to dry in the hot sun for approximately a week before being packed in large burlap sacks for shipment. Cacao beans are typically sold like sugar and coffee on a commodity exchange or futures market to candy manufacturers, importers, exporters, and trade companies.
Once transported to their new location, the beans follow a series of automated processes. They are cleaned and sorted by type and origin, and either roasted separately or blended in the roasting process to create a special taste. Cacao beans from different locations have a distinct flavor. Some chocolates are made from 10 or more different types of beans. Roasting takes place in large rotating ovens for about one to two hours, after which the beans are cooled and separated from their shells by a winnowing machine. What remains is the center of the bean, called nib, which consists of both cocoa solids and cocoa butter (about 50/50). A heavy milling machine crushes the nibs and converts them to a thick paste called chocolate liquor. Some of the chocolate liquor is pressed to separate the cocoa solids from the cocoa butter. The cocoa solids are pulverized into cocoa powder and are sold as a baking- or beverage-making product. The cocoa butter is added in varying amounts to dark or milk chocolate products, or sold to cosmetic or pharmaceutical companies.
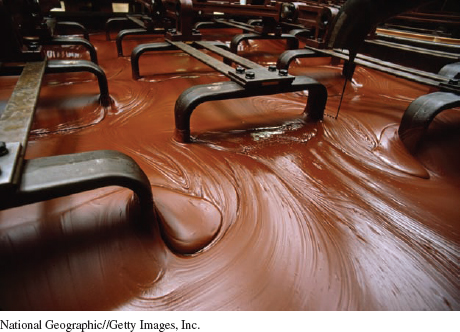
Some chocolate manufacturers buy chocolate liquor from suppliers as their raw material, others start with the cacao beans and make their own liquor. The liquor is combined with milk, sugar, and cocoa butter to form a coarse brown powder called chocolate crumb. The crumb travels through a series of steel rollers that grind the mixture and refine it into a chocolate paste. The chocolate paste is poured into a large vat where rollers knead and blend it in a process called conching. Conching can take from one to three days, or for some premium brands, one to two weeks. Next, the chocolate is tempered (i.e., cooled and warmed repeatedly) to gain the right consistency and gloss. During this time, other ingredients can be added, such as nuts or flavorings. Finally, the chocolate is poured into moulds, vibrated (to get the air out), sent down a long tunnel to be cooled, and wrapped or packaged. Hershey's can fill 1,000 molds per minute, but the entire process of making chocolate from bean to bar takes an average of four days.
Chocolate manufacturing is a complicated process that requires skill and precision. Paying attention to processes (both production and service processes) and selecting technology that can help streamline processes is the topic of this chapter.
Sources: The Field Museum, http://www.fieldmuseum.org/chocolate/; Hershey's Web site, www.hersheys.com
•Process: a group of related tasks with specific inputs and outputs.
A process is a group of related tasks with specific inputs and outputs. Processes exist to create value for the customer, the shareholder, or society. Process design defines what tasks need to be done and how they are to be coordinated among functions, people, and organizations. Planning, analyzing, and improving processes is the essence of operations management. Processes are planned, analyzed, and redesigned as required by changes in strategy and emerging technology.
Process strategy is an organization's overall approach for physically producing goods and providing services. Process decisions should reflect how the firm has chosen to compete in the marketplace, reinforce product decisions, and facilitate the achievement of corporate goals. A firm's process strategy defines its:
Vertical integration: The extent to which the firm will produce the inputs and control the outputs of each stage of the production process.
Capital intensity: The mix of capital (i.e., equipment, automation) and labor resources used in the production process.
Process flexibility: The ease with which resources can be adjusted in response to changes in demand, technology, products or services, and resource availability.
Customer involvement: The role of the customer in the production process.
•Process strategy: an organization's overall approach for physically producing goods and services.
In this chapter we examine the planning, analysis, and innovation of processes, as well as technology decisions related to those processes.
Process planning determines how a product will be produced or a service provided. It decides which components will be made in-house and which will be purchased from a supplier, selects processes, and develops and documents the specifications for manufacture and delivery. In this section, we discuss outsourcing decisions, process selection, and process plans.
•Process planning: converts designs into workable instructions for manufacture or delivery.
A firm that sells the product, assembles the product, makes all the parts, and extracts the raw material is completely vertically integrated. But most companies cannot or will not make all of the parts that go into a product. A major strategic decision, then, is how much of the work should be done outside the firm. The decision involves questions of dependence, competency-building, and proprietary knowledge, as well as cost.
•Vertical Integration: the degree to which a firm produces the parts that go into its products.
On what basis should particular items be made in-house? When should items be outsourced? How should suppliers be selected? What type of relationship should be maintained with suppliers— arm's length, controlling, partnership, alliance? What is expected from the suppliers? How many suppliers should be used? How can the quality and dependability of suppliers be ensured? How can suppliers be encouraged to collaborate?
For process planning, we need to decide which items will be purchased from an outside supplier and which items will be produced in our own factories. More advanced sourcing decisions on whom to buy from are discussed in Chapter 10.
The outsourcing decision rests on an evaluation of the following factors:
Cost. Would it be cheaper to make the item or buy it? to perform the service in-house or outsource it? The cost of buying the item from a supplier includes the purchase price, transportation costs, and various tariffs, taxes, and fees. The cost of coordinating production over long distances and increased inventory levels should also be considered. The cost of making the item includes labor, material, and overhead.
Make-or-buy decisions are influenced by many factors.
In some situations a company may decide to buy an item rather than make it (or vice versa) when, from a cost standpoint, it would be cheaper to do otherwise. The remaining factors in this list represent noneconomic factors that can influence or dominate the economic considerations.
Capacity. Companies that are operating at less than full capacity may elect to make components rather than buy them, especially if maintaining a level workforce is important. Sometimes the available capacity is not sufficient to make all the components, so choices have to be made. Typically, it is better to produce more customized or volatile products in-house, and to outsource steady products with high volume/high standardization.
Quality. The capability to provide quality parts consistently is an important consideration in the outsourcing decision. In general, it is easier to control the quality of items produced in your own factory. However, standardization of parts, supplier certification, and supplier involvement in design can improve the quality of supplied parts.
Speed. The savings from purchasing an item from a far-off vendor can be eaten up by the lengthy transit time of offshore shipments. At other times, a supplier can provide goods sooner than the manufacturer. The smaller supplier is often more flexible, too, and can adapt quickly to design and technology changes. Of course, speed is useful only if it is reliable.
Reliability. Suppliers need to be reliable in both the quality and the timing of what they sup-ply. Unexpected delays in shipments or partially filled orders because of quality rejects can wreak havoc with the manufacturing system. Many companies today are requiring that their suppliers meet certain quality and delivery standards to be certified as an approved supplier. As discussed in Chapter 2, the most common quality certification is ISO 9000. Other companies assess huge penalties for unreliable supply. Some automakers, for example, fine their suppliers $30,000 for each hour an order is late.

Expertise. Companies that are especially good at making or designing certain items may want to keep control over their production. Coca-Cola would not want to release its formula to a supplier, even if there were guarantees of secrecy. Although automakers might outsource many of their component parts, they need proprietary control over major components such as engines, transmissions, and electronic guidance systems. Japanese, Taiwanese, and Korean firms are currently learning U.S. expertise in aircraft design and manufacture by serving as suppliers of component parts. Chinese markets are often flooded with cheap knockoffs of goods manufactured by suppliers in that country. The protection of intellectual property is a major concern in expanded supply chains. Thus, the decision of whether to share your expertise with a supplier for economic gains is a difficult one.
The outsourcing decision is not a simple one. Rather, choices can be made along a continuum from a single purchasing decision to a joint venture. Figure 6.1 illustrates the sourcing continuum.
The next step in process planning is to select a production process for those items we will produce in-house. Production processes can be classified into projects, batch production, mass production, and continuous production.
•Projects: one-at-a-time production of a product to customer order.
Projects take a long time to complete, involve a large investment of funds and resources, and produce one item at a time to consumer order. Examples include construction projects, shipbuilding, new-product development, and aircraft manufacturing.
Batch production processes many different jobs through the production system at the same time in groups or batches. Products are typically made to customer order, volume (in terms of customer order size) is low, and demand fluctuates. Examples of batch production include printers, bakeries, machine shops, education and furniture making.
•Batch production: processing many different jobs at the same time in groups (or batches).
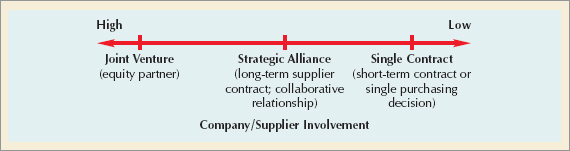
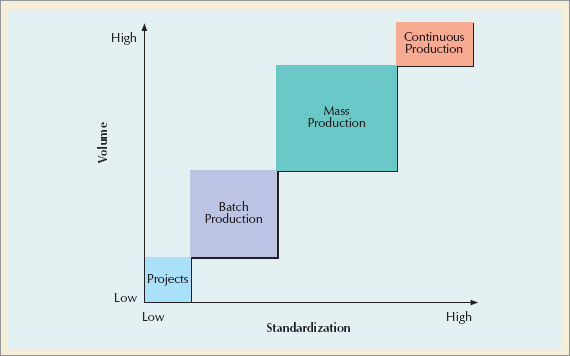
Figure 6.2. The Product Process Matrix Source: Adapted from Robert Hayes and Steven Wheelwright, Restoring the Competitive Edge Competing Through Manufacturing (New York, John Wiley & Sons, 1984), p. 209.
•Mass production: producing large volumes of a standard product for a mass market.
Mass production produces large volumes of a standard product for a mass market. Product demand is stable, and product volume is high. Goods that are mass produced include automobiles, televisions, personal computers, fast food, and most consumer goods.
•Continuous production: producing very high-volume commodity products.
Continuous production is used for very high-volume commodity products that are very standardized. The system is highly automated and is typically in operation continuously 24 hours a day. Refined oil, treated water, paints, chemicals, and foodstuffs are produced by continuous production.
The process chosen to create the product or service must be consistent with product and service characteristics. The most important product characteristics (in terms of process choice) are degree of standardization and demand volume. Figure 6.2 shows a product-process matrix that matches product characteristics with process choice.
The best process strategy is found on the diagonal of the matrix. Companies or products that are off the diagonal have either made poor process choices or have found a means to execute a competitive advantage. For example, technological advancements in flexible automation allow Motorola to mass produce customized pagers. Volvo and Rolls Royce occupy a special market niche by producing cars in a crafted, customized fashion. Examples of poor process choice include Texas Instruments' attempt to produce consumer products for mass markets by the same process that had been successful in the production of scientific products for specialized markets, and Corning's production of low-volume consumer items, such as range covers, with the same continuous process used for other items formed from glass.
Table 6.1 summarizes the characteristics of each type of process. As we move from projects to continuous production, demand volume increases; products become more standardized; systems become more capital-intensive, more automated, and less flexible; and customers become less involved.
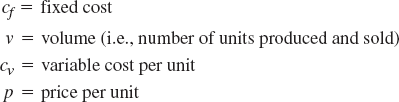
Several quantitative techniques are available for selecting a process. One that bases its decision on the cost tradeoffs associated with demand volume is breakeven analysis. The components of breakeven analysis are volume, cost, revenue, and profit.
•Breakeven analysis: examines the cost trade-offs associated with demand volume.
Volume is the level of production, usually expressed as the number of units produced and sold. We assume that the number of units produced can be sold.
Cost is divided into two categories: fixed and variable. Fixed costs remain constant regardless of the number of units produced, such as plant and equipment and other elements of overhead. Variable costs vary with the volume of units produced, such as labor and material. The total cost of a process is the sum of its fixed cost and its total variable cost (defined as volume times per unit variable cost).
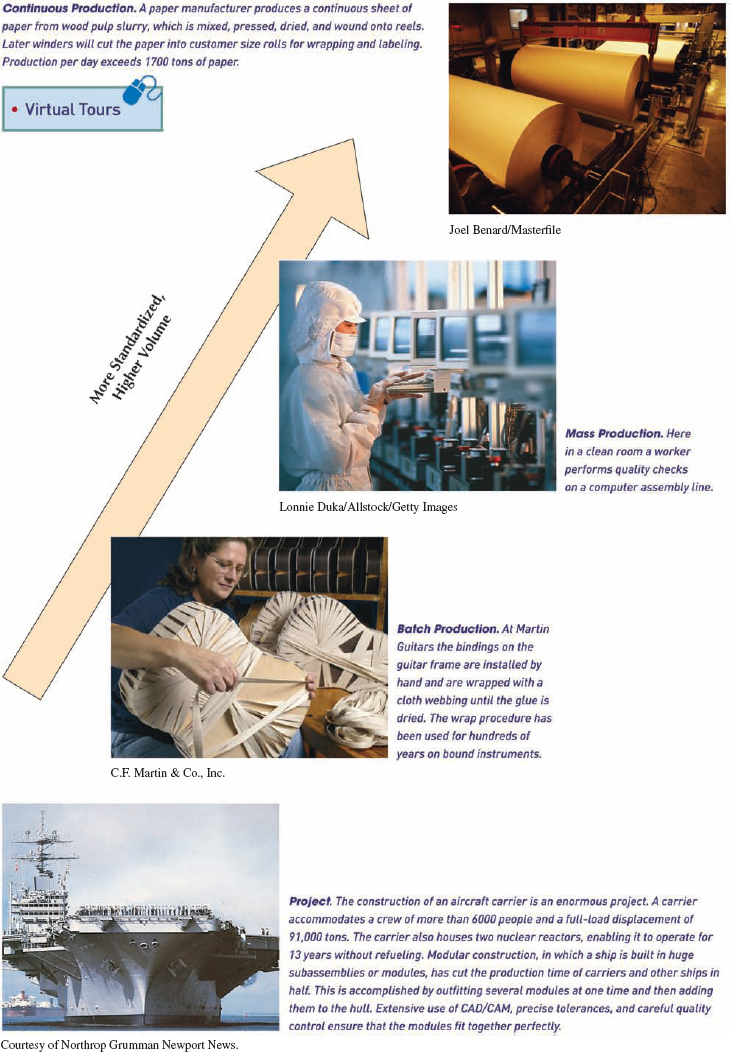
Table 6.1. Types of Processes
Type of product | Unique | Made-to-order (customized) | Made-to-stock (standardized) | Commodity |
Type of customer | One-at-a-time | Few individual customers | Mass market | |
Product demand | Infrequent | Fluctuates | Stable | Very stable |
Demand volume | Very low | Low to medium | High | Very high |
No. of different products | Infinite variety | Many, varied | Few | Very few |
Production system | Long-term project | Discrete, job shops | Repetitive, assembly lines | Continuous, process industries |
Equipment | Varied | General-purpose | Special-purpose | Highly automated |
Primary type of work | Specialized contracts | Fabrication | Assembly | Mixing, treating, refining |
Worker skills | Experts, craftspersons | Wide range of skills | Limited range of skills | Equipment monitors |
Advantages | Custom work, latest technology | Flexibility, quality | Efficiency, speed, low cost | Highly efficient, large capacity, ease of control |
Disadvantages | Nonrepetitive, small customer base, expensive | Costly, slow, difficult to manage | Capital investment, lack of responsiveness | Difficult to change, far-reaching errors, limited variety |
Examples | Construction, shipbuilding, spacecraft | Machine shops, print shops, bakeries, education | Automobiles, televisions, computers, fast food | Paint, chemicals, foodstuffs |
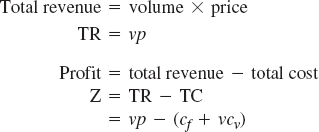
Revenue on a per-unit basis is simply the price at which an item is sold. Total revenue is price times volume sold. Profit is the difference between total revenue and total cost. These components can be expressed mathematically as follows:
Total cost = fixed cost + total variable cost
TC = cf + vcv
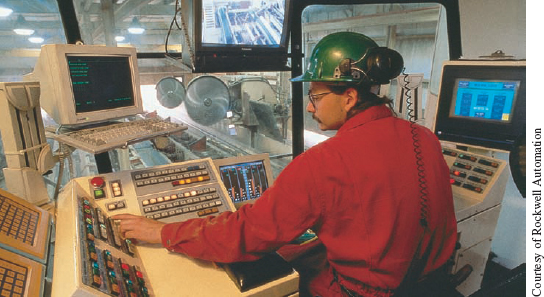
Continuous processes are used for very-high-volume, commodity products whose output is measured rather than counted. The production system is capital-intensive and highly automated (with workers who monitor the equipment rather than perform the work) and is typically operated 24 hours a day.
where
In selecting a process, it is useful to know at what volume of sales and production we can expect to earn a profit. We want to make sure that the cost of producing a product does not exceed the revenue we will receive from the sale of the product. By equating total revenue with total cost and solving for v, we can find the volume at which profit is zero. This is called the breakeven point. At any volume above the breakeven point, we will make a profit. A mathematical formula for the breakeven point can be determined as follows:
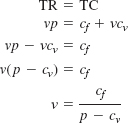
BreakEven Analysis
Travis and Jeff own Up Right Paddlers, a new startup company with the goal of designing, making, and marketing stand-up paddle boards for streams and rivers. A new fitness craze, stand-up paddle boards are similar to surfboards in appearance, but are used by individuals to navigate down rivers in an upright position with a single long pole (or paddle), instead of sitting in tubes or rafts and floating down. The boards are constructed from heavy duty raft material that is inflatable, rather than the fiberglass material used in surfboards. Unlike surfboards that market for $500 to $1000 each, paddle boards are typically sold for between $100 and $400. Since Travis and Jeff are just starting out and the demand for paddle boards on the East Coast has not been firmly established, they anticipate selling their product for $100 each. Travis estimates the fixed cost for equipment and space will be $20,000, and the material and labor costs will run $50 per unit. What volume of demand will be necessary for Travis and Jeff to break even on their new venture?
Solution
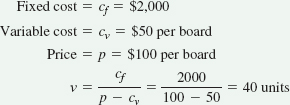
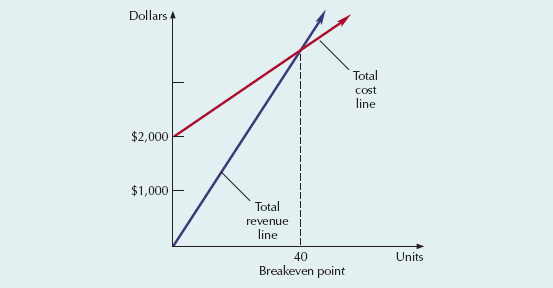
The solution is shown graphically in the following figure. The x-axis represents production or demand volume, and the y-axis represents dollars of revenue, cost, or profit. The total revenue line extends from the origin, with a slope equal to the unit price of a board. The total cost line intersects the y-axis at a level corresponding to the fixed cost of the process and has a slope equal to the per-unit variable cost. The intersection of these two lines is the breakeven point. If demand is less than the breakeven point, the company will operate at a loss. But if demand exceeds the breakeven point, the company will be profitable. The company needs to sell more than 40 paddle boards to make a profit.
Breakeven analysis is especially useful when evaluating different degrees of automation. More automated processes have higher fixed costs but lower variable costs. The "best" process depends on the anticipated volume of demand for the product and the tradeoffs between fixed and variable costs. Example 6.2 shows how breakeven analysis can guide the selection of a process among several alternatives. The example uses this procedure:
Formulate a total cost equation for each process considered.
Calculate the point of indifference between two alternative processes (i.e., the volume at which the total cost of manufacturing is the same for the two processes) by setting their total cost equations equal to each other and solving for v, demand volume.
Above the point of indifference, choose the alternative with the lowest variable cost.
Below the point of indifference, choose the alternative with the lowest fixed cost.
Process Selection
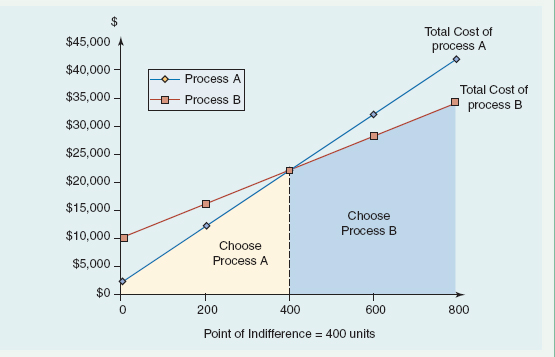
Jeff, the more optimistic of the two owners of UpRight Paddlers, believes that demand for paddle boards will exceed the breakeven point of 40 units calculated in Example 6.1. He proposes spending $10,000 in fixed costs to buy more automated equipment that would reduce the materials and labor cost to $30 per board. The boards would sell for $100, regardless of which manufacturing process is chosen. Compare the two processes and determine for what level of demand each process would be preferred. Label Travis' proposal as Process A, and Jeff's proposal as Process B.
solution
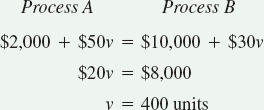
If demand is less than or equal to 400 boards, the alternative with the lowest fixed cost, process A, should be chosen. If demand is greater than or equal to 400 boards, the alternative with the lowest variable cost, process B, is preferred. Our decision can be confirmed by examining the next graph. (Because the boards will be sold for $100 apiece regardless of which process is used to manufacture them, no revenue line is needed.)
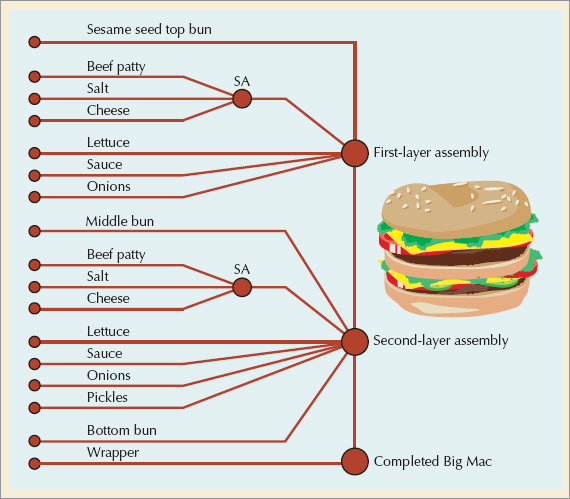
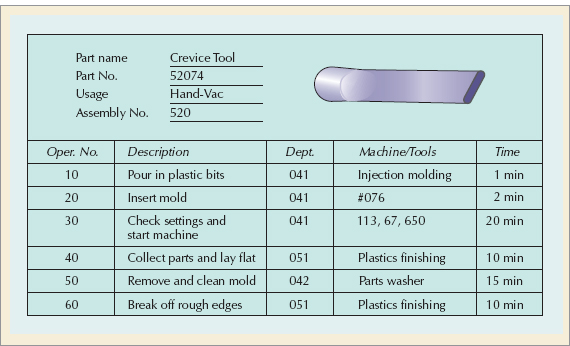
Process plans are a set of documents that detail manufacturing and service delivery specifications. They begin with detailed drawings of product design (usually from a CAD system) and include assembly charts or bills of material (showing the parts and materials needed and how they are to be assembled together), operations sheets or routing sheets (listing the operations to be performed with details on equipment, tools, skills, etc.), and quality-control checksheets (specifying quality standards and quality data to be recorded).
•Process plans: a set of documents that detail manufacturing and service delivery specifications.
Process plans are used in both manufacturing and service settings. A hospital, for example, has a set of process plans (often called protocols) for different types of medical procedures and service plans for each particular patient. Similarly, in manufacturing, some process plans are standard, and others are created for each customer order. Figure 6.3 shows an assembly chart for a Big Mac. Figure 6.4 shows an operations sheet for a plastic molded vacuum cleaner attachment.
•Assembly charts: a schematic diagram of a product that shows the relationship of component parts to parent assemblies.
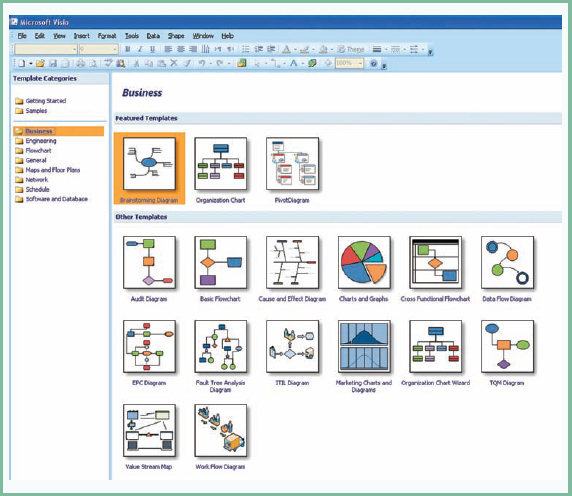
Process analysis is the systematic examination of all aspects of a process to improve its operation—to make it faster, more efficient, less costly, or more responsive to the customer. The basic tools of process analysis are process flowcharts, diagrams, and maps. Exhibit 6.1 shows the various flowcharts available in Microsoft Visio to map out business processes.
These flowcharts come in many different sizes, shapes, and forms; several are depicted in this chapter. While the format and symbols used may vary, the "process" of building a flowchart follows these steps:
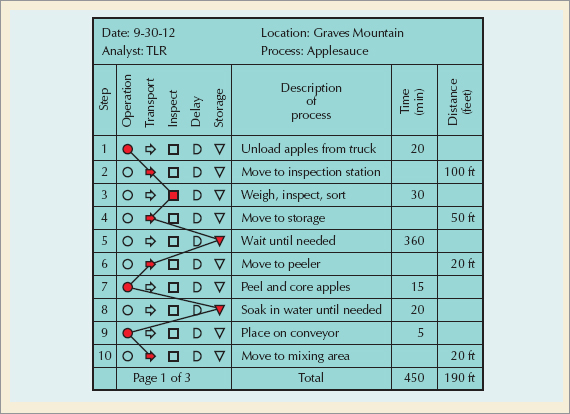
The classic process flowchart looks at the manufacture of a product or delivery of a service from a broad perspective. The chart uses five standard symbols, shown in Figure 6.5, to describe a process:
•Process flowchart: a document that uses standardized symbols to chart the productive and nonproductive flow of activities involved in a process.
Process improvement teams are likely to make a first pass at diagramming a process, with adhesive notes plastered on large sheets of paper connected with hand-drawn arrows. As documentation of the process becomes more complete, departments or companies may prefer particular symbols to represent inputs, outputs, decisions, activities, and resources.
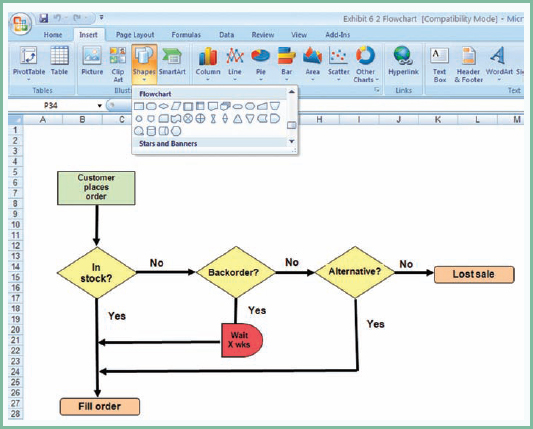
Flowcharts can take many forms, from freehand drawings to animated simulations. Exhibit 6.2 shows a simple flowchart created in Excel. More sophisticated flowcharting tools are available from Microsoft Visio, SmartDraw (www.smartdraw.com), iGrafx (www.igrafx.com), and others. You may be able to download free trial copies of the software for limited periods of time.
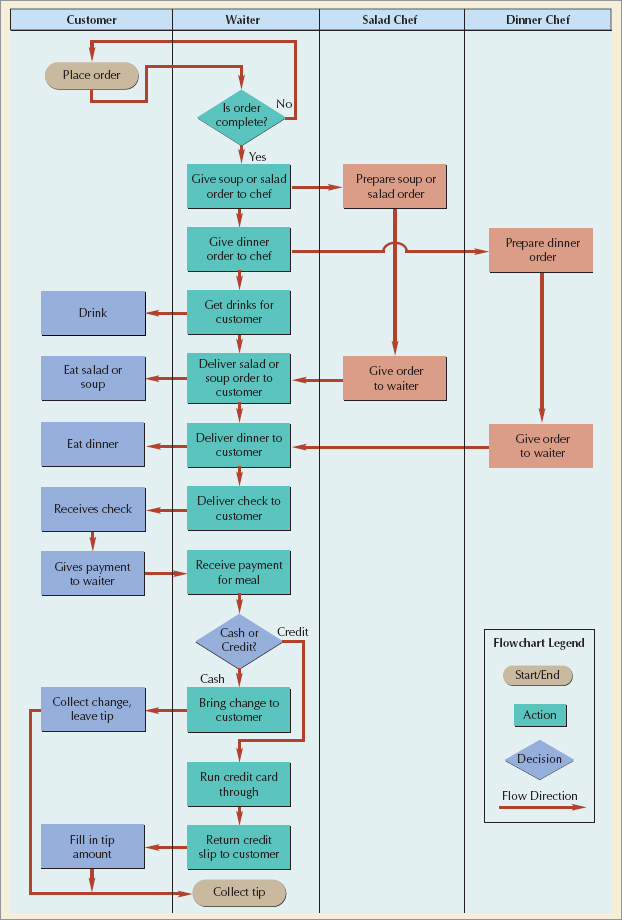
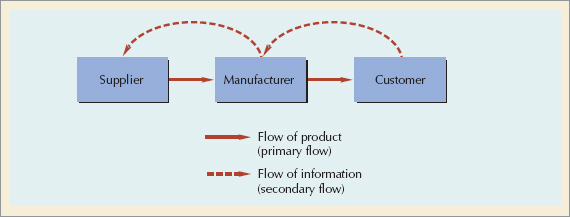
Figure 6.6 shows a process map, or swimlane chart, so called because it maps out the activities performed by various people in the process. Often process maps will include a time scale as well. Figure 6.7 shows a simple value chain flowchart from supplier to customer.
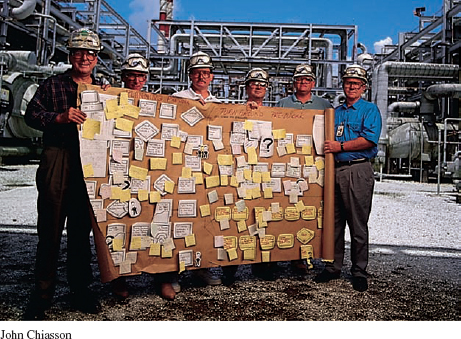
These workers at a Dow Chemical plant are displaying a process map they developed to analyze an existing process. The flowchart is not neat and tidy, but it does offer some obvious candidates for improvement. U.S. workers and managers in both industry and government are examining their processes in an attempt to redesign work for high-quality, less waste, and speedier operation.
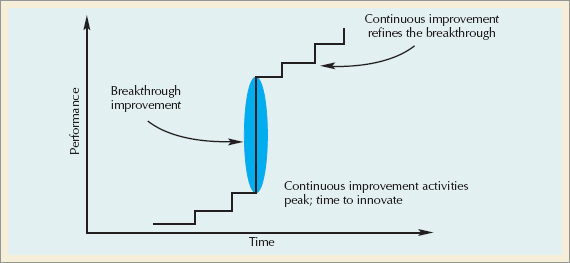
Processes are planned in response to new facilities, new products, new technologies, new markets, or new customer expectations. Processes should be analyzed for improvement on a continuous basis. When continual improvement efforts have been exhausted and performance expectations still cannot be reached with an existing process, it is time to completely redesign or innovate the process.
Process innovation[11] projects are typically chartered in response to a breakthrough goal for rapid, dramatic improvement in process performance. Performance improvement of 50 to 100% within 12 months is common. In order to achieve such spectacular results, an innovation team is encouraged to start with a clean sheet of paper and rethink all aspects of a process, from its purpose to its outputs, structure, tasks, and technology. Figure 6.8 shows the relationship between continuous improvement, breakthrough improvement, and process innovation.
•Process innovation: the total redesign of a process for breakthrough improvements.
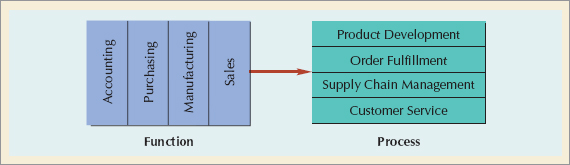
Process innovation is most successful in organizations that can view their system as a set of processes providing value to the customer, instead of functional areas vying for limited resources. Figure 6.9 shows this change from a functional to a process orientation. In an environment of rapid change, the ability to learn faster, reconfigure processes faster, and execute processes faster is a competitive advantage.
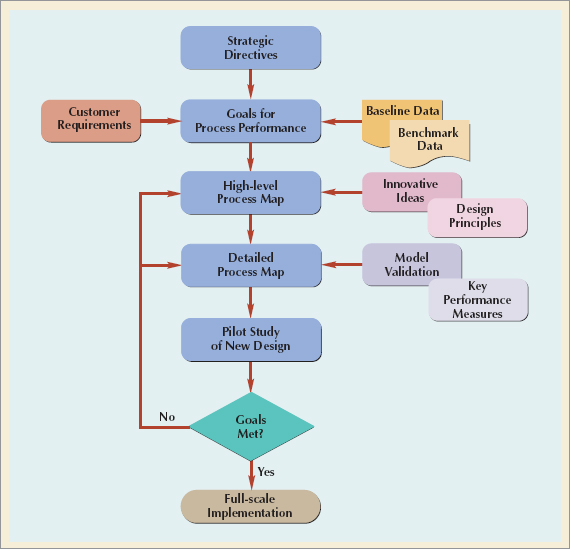
Figure 6.10 outlines the innovation process. Let's review the process step-by-step. The initial step establishes the goals for process performance. Data from the existing process are used as a baseline to which benchmarking data on best industry practices, customer requirements data, and strategic directives are compared.[12] Analyzing the gap between current and desired performance helps to determine whether the process needs to be redesigned. If redesign is necessary, a project team is chartered and provided with the preliminary analysis and resulting goals and specifications for process performance. Although the goals for a process may be specific, the specifications are not (or else the creativity of the group is hampered). It is important that the project team be convinced that total redesign of the process is absolutely necessary to achieve the performance objectives.
Establish goals and specifications.
Process maps work backward from a performance goal.
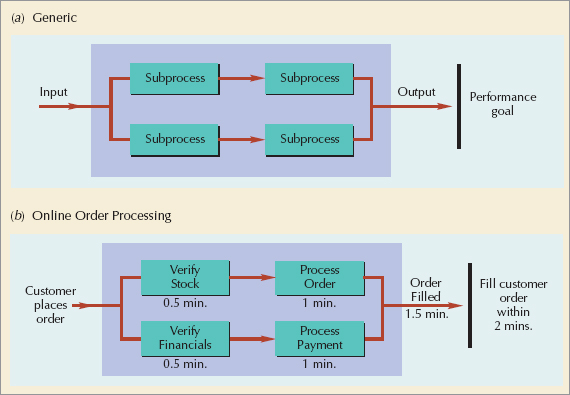
A useful tool in beginning the redesign of a process is a high-level process map. Pared to its simplest form, a high-level map contains only the essential building blocks of a process. As shown in Figure 6.11, it is prepared by focusing on the performance goal—stated in customer terms—and working backward through the desired output, subprocesses, and initial input requirements. Design principles, such as performing subprocesses in parallel whenever possible, help to structure the map efficiently. Table 6.2 lists several additional design principles recommended for process innovation. Innovative ideas can challenge the conventional ordering of subprocesses, or the need for a subprocess. Table 6.3 presents various techniques to prompt innovative thinking.
After the general concept of redesign is agreed on, a detailed map is prepared for each subprocess or block in the high-level map. Blocks are added only if an activity can contribute to the output goal. The existence of each block or activity is challenged: Does it add value for the customer? Does it have to be done? Could it be done more quickly, more easily, or sooner? Could someone else do it better?
A detailed map guides decisions on allocation of resources and work methods. To guarantee that the detailed map will produce the desired results, key performance measures are determined and set in place. The model is also validated through simulation, interviewing, and partial testing. When the team is satisfied that the performance objective can be reached with the new design, a pilot study is conducted.
Use pilot studies for rapid prototyping.
Process innovation is not like other projects, which can be carefully planned and flawlessly executed. Innovation is by definition something new and untested. Milestones, costs, and benefits are guesses at best. A pilot study allows the team to try something, see if it works, modify it, and try again.
Table 6.2. Principles for Redesigning Processes
Source: Omar El Savvy, Redesigning Enterprise Processes for e-Business (New York: McGraw-Hill, 2001), pp. 57-75. |
|---|
|
Table 6.3. Techniques for Generating Innovative Ideas
Source: Adapted from AT&T Quality Steering Committee, Reengineering Handbook (Indianapolis: AT&T Technical Publications Center, 1991). |
|---|
|
After a successful pilot study, full-scale implementation can begin. Since process innovation involves radical change, the transition period between introducing the changed process and the incorporation of the new process into day-to-day operations can be difficult. The redesigned process may involve changing the way executives manage, the way employees think about their work, or how workers interact. The transition needs to be managed with a special concern for the "people" aspects of change. The innovation process is complete when the transition has been weathered and the new process consistently reaches its objective.
The concept of process innovation emerged in response to rapid changes in technology that rendered existing processes obsolete. In the next section, we discuss the impact of technology decisions and provide resources for a more in-depth study of technology.
ANASTASIA THATCER

I'm a process manager for the public sector division of one of the largest and best performing health-care corporations in the United States. My region is the Northeast where the processes I oversee are responsible for the health care of over 400,000 lives.
I began my work auditing claims processing, and then became interested in how a claim works its way through the system. I noticed all sorts of inefficiencies. For example, high dollar claims were manually handled with 10 different touch points. The Claims Processor would identify high dollar claims and then forward it to the Special Matters Expert, who would work with the Claims Liaison, who would need approval from the Executive Director of the plan, who would consult the Claims Analyst, who would ask Contracting to get back to them so that they could inform the Executive Director, who would make a decision and send it to the Liaison, who would notify the Special Matters Expert, who would lastly pass along the decision to the Claims Processor, who would pay the claim. After redesign, the approval goes from Claims Processor to Special Matters Expert to Executive Director, period. The process flows more efficiently using fewer resources, and the providers are happier because they receive their payments more quickly, which ultimately ensures that members get access to the best care possible.
Like a lot of manufacturing firms, we have more data than we can process efficiently, and it seems that people are always looking for the same information. I remember one situation in particular with case management of high-risk pregnancies. There was a two-month backlog, which meant that by the time the case manager got around to contacting the patient, the pregnancy was too far along for treatment to make much of a difference. I analyzed the process and found that if we developed a shared database between the applicants, the case managers, and the nurses, we could eliminate the manual data entry of cases. That one change reduced the backlog to zero, saved the company millions, and most importantly reduced the number of detained babies (those that need to stay in the hospital after the mother had been released) by 50%. In this job, you can make a real difference. You can save lives.
I was amazed when I took the operations management class at NYU that there's a field of study for what I do. I live by flowcharts and Pareto analysis. We're always configuring and reconfiguring systems. If it doesn't work, we try something else. It's important to take a step back and look at the broader picture. Then you have to take risks and make decisions, and always look for ways of improving the process.
Technology decisions involve large sums of money and can have a tremendous impact on the cost, speed, quality, and flexibility of operations. More importantly, they define the future capabilities of a firm and set the stage for competitive interactions. Thus, it is dangerous to delegate technology decisions to technical experts or financial analysts. A manager's ability to ask questions and understand the basic thrust of proposed technology is invaluable in making wise technology choices.
In this section we discuss the financial justification of new technology, followed by a brief technology primer.
After it is decided that a part will be produced or service provided in-house, specific technology decisions can be made. Alternatives include using, replacing, or upgrading existing equipment, adding additional capacity, or purchasing new equipment. Any alternative that involves an outlay of funds is considered a capital investment. Capital investments involve the commitment of funds in the present with an expectation of returns over some future time period. The expenditures are usually large and can have a significant effect on the future profitability of a firm. These decisions are analyzed carefully and typically require top management approval.
The most effective quantitative techniques for capital investment consider the time value of money as well as the risks associated with benefits that will not accrue until the future. These techniques, known collectively as capital budgeting techniques, include payback period, net present value, and internal rate of return. Detailed descriptions can be found in any basic finance text. Although capital budgeting techniques are beyond the scope of this text, we do need to comment on several factors that are often overlooked in the financial analysis of technology.
Capital budgeting techniques are used to evaluate new technology.
Purchase Cost The initial investment in equipment consists of more than its basic purchase price. The cost of special tools and fixtures, installation, training, maintenance, and engineering or programming adjustments can represent a significant additional investment. Operating costs are often underestimated as well.
Purchasing cost includes the add-ons necessary to make the technology work.
Operating Costs To assess more accurately the requirements of the new technology, it is useful to consider, step-by-step, how the equipment will be operated, started, stopped, loaded, unloaded, changed over, upgraded, networked, maintained, repaired, cleaned up, speeded up, and slowed down.
Visualize how the technology will be used.
Annual Savings Most new technology is justified based on direct labor savings. However, other savings can actually be more important. For example, a more efficient process may be able to use less material and require less machine time or fewer repairs, so that downtime is reduced. A process that produces a better-quality product can result in fewer inspections and less scrap and rework. New processes (especially those that are automated) may significantly reduce safety costs, in terms of compliance with required regulations, as well as fines or compensation for safety violations.
New technology can save money through better quality and more efficient operation.
Revenue Enhancement Increases in revenue due to technology upgrades or new-equipment purchases are often ignored in financial analysis because they are difficult to predict. Improvements in product quality, price reductions due to decreased costs, and more rapid or dependable delivery can increase market share and, thus, revenue. Flexibility of equipment can also be important in adapting to the changing needs of the customer.
New technology can enhance revenue.
Replacement Analysis As existing equipment ages, it may become slower, less reliable, and obsolete. The decision to replace old equipment with state-of-the-art equipment depends in large measure on the competitive environment. If a major competitor upgrades to a newer technology that improves quality, cost, or flexibility and you do not, your ability to compete will be severely damaged. In some industries, technology changes so rapidly that a replacement decision also involves determining whether this generation of equipment should be purchased or if it would be better to wait for the next generation. Replacement analysis maps out different schedules for equipment purchases over a two to five year period and selects a replacement cycle that will minimize cost.
Deciding when to upgrade to a new technology often depends on the competitive environment.
Risk and Uncertainty Investment in new technology can be risky. Estimates of equipment capabilities, length of life, and operating cost may be uncertain. Because of the risk involved, financial analysts tend to assign higher hurdle rates (i.e., required rates of return) to technology investments, making it difficult to gain approval for them.
It is risky to invest in new technology, and it's risky not to.
Piecemeal Analysis Investment in equipment and new technology is also expensive. Rarely can a company afford to automate an entire facility all at once. This has led to the proposal and evaluation of equipment purchases in a piecemeal fashion, resulting in pieces of technology that don't fit into the existing system and fail to deliver the expected returns.
Make sure new and existing technology are compatible.
Technology is important in both manufacturing and service operations. Cars now have hundreds of embedded systems performing thousands of computerized functions. Pacemakers, vending machines, Xerox copiers, and store shelves notify the manufacturer when repairs or restocking are needed. Coming soon are clothes that measure the wearer's vital statistics and notify a physician or change medication regimes when necessary, and refrigerators that pre-order ingredients to match weekly menus or order milk when the supply is low. We discuss many of the information technology advances that support these systems in more detail in Chapter 10. In this section, we present a brief overview of technology advances in manufacturing systems.
Technology in manufacturing includes computer aided design, robots, automated guided vehicles, computer numerically controlled machines, automated storage and retrieval systems, and flexible manufacturing systems. Automated manufacturing systems integrated through computer technology are aptly called computer-integrated manufacturing (CIM). With the advent of the Internet and the increased globalization of both markets and production, CIM has evolved into a Web-centric collaborative venture known as e-manufacturing (eM).
E-manufacturing involves sharing real-time data with trading partners and customers and making collaborative decisions about production based on that data. In order to collaborate, information must be converted into electronic form, protocols for communication must be established, and infrastructure must be in place for connectivity with customers, suppliers, and partners. Rather than making huge volumes of standard products in anticipation of demand, e-manufacturing uses realtime information on customer orders and productive capacity across the supply chain to speed customized products directly to the customer. Figure 6.12 shows the components of e-manufacturing categorized by product, process, manufacturing, and information technologies. Table 6.4 serves as a technology primer, briefly defining the terms listed in the figure.
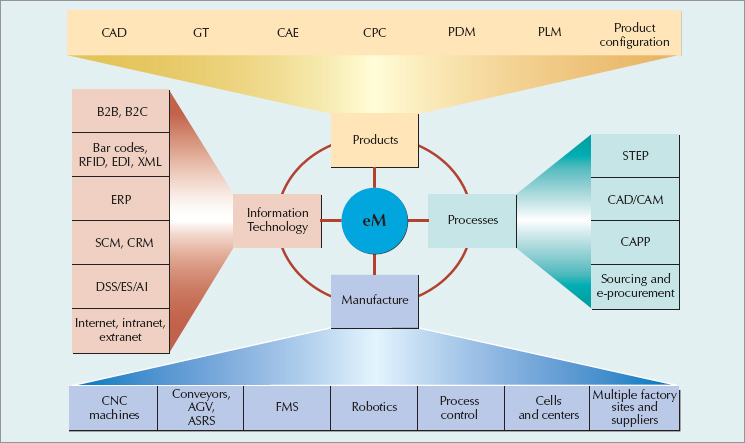
Table 6.4. A Technology Primer
CAD | Computer-aided design | Creates and communicates designs electronically |
GT | Group technology | Classifies designs into families for easy retrieval and modification |
CAE | Computer-aided engineering | Tests the functionality of CAD designs electronically |
CPC | Collaborative product commerce | Facilitates electronic communication and exchange of information among designers and suppliers |
PDM | Product data management | Keeps track of design specs and revisions for the life of the product |
PLM | Product lifecycle management | Integrates the decisions of those involved in product development, manufacturing, sales, customer service, recycling, and disposal |
Defines products "configured" by customers who have selected among various options, usually from a Web site | ||
STEP | Standard for exchange of product model data (ISO 10303) | Set standards for communication among different CAD vendors; translates CAD data into requirements for automated inspection and manufacture |
Computer-aided design and manufacture | The electronic link between automated design (CAD) and automated manufacture (CAM) | |
CAPP | Computer aided process planning | Generates process plans based on a database of similar requirements |
Electronic purchasing of items from e-marketplaces, auctions, or company Web sites | ||
CNC | Computer numerically controlled | Machines controlled by software code to perform a variety of operations with the help of automated tool changers; also collects processing information and quality data |
FMS | Flexible manufacturing system | A collection of CNC machines connected by an automated material handling system to produce a wide variety of parts |
Manipulators that can be programmed to perform repetitive tasks; more consistent than workers but less flexible | ||
Fixed-path material handling; moves items along a belt or overhead chain; "reads" packages and diverts them to different directions; can be very fast | ||
AGV | Automatic guided vechicle | A driverless truck that moves material along a specified path; directed by wire or tape embedded in the floor or by radio frequencies; very flexible |
ASRS | Automated storage and retrieval system | An automated warehouse—some 26 stories high—in which items are placed in a carousel-type storage system and retrieved by fast-moving stacker cranes; controlled by computer |
Continuous monitoring of automated equipment; makes real-time decisions on ongoing operation, maintenance, and quality | ||
CIM | Computer-integrated manufacturing | Automated manufacturing systems integrated through computer technology; also called e-manufacturing |
Information Technology | ||
|---|---|---|
B2B | Business-to-business | Electronic transactions between businesses usually over the Internet |
B2C | Business-to-consumer | Electronic transactions between businesses and their customers usually over the Internet |
Internet | A global information system of computer networks that facilitates communication and data transfer | |
Communication networks internal to an organization; can be password (i.e., firewall) protected sites on the Internet | ||
Intranets connected to the Internet for shared access with select suppliers, customers, and trading partners | ||
A series of vertical lines printed on most packages that identifies the item and other information when read by a scanner | ||
Radio frequency identification tags | An integrated circuit embedded in a tag that can send and receive information; a twenty-first century bar code with read/write capabilities | |
EDI | Electronic data interchange | A computer-to-computer exchange of business documents over a proprietary network; very expensive and inflexible |
XML | Extensible markup language | A programming language that enables computer-to-computer communication over the internet by tagging data before its is sent |
ERP | Enterprise resource planning | Software for managing the basic requirements of an enterprise. Including sales & marketing, finance & accounting, production & materials management, and human resources |
SCM | Supply chain management | Software for managing the flow of goods and information among a network of suppliers, manufacturers, and distributors |
CRM | Customer relationship management | Software for managing interactions with customers and compiling and analyzing customer data |
DSS | Decision support systems | An information system that helps managers make decisions; includes a quantitative modeling component and an interactive component for what-if? analysis |
ES | Expert systems | A computer system that uses an expert knowledge base to diagnose or solve a problem |
Al | Artificial intelligence | A field of study that attempts to replicate elements of human thought in computer processes; includes expert systems, genetic algorithms, neural networks, and fuzzy logic (see Chapter 17) |
Important issues in process design are types of processes, process planning, analysis and innovation, and technology decisions. The type of production process selected depends primarily on demand volume and degree of product standardization. Projects are produced one at a time to customer order. Batch production is used to process a variety of low-volume jobs. Mass production produces large volumes of a standard product for a mass market. Continuous production is used for very-high-volume commodity products.
Process planning consists of converting product designs into workable instructions for manufacture. They often appear in the form of assembly charts, process flowcharts, operations sheets, and manufacturing or delivery specifications. On a broader scale, process planning involves process selection, technology decisions, and decisions on outsourcing. Process analysis drives the continuous improvement of operations; process innovation drives breakthrough improvements.
assembly chart a schematic diagram of a product that shows the relationship of component parts to parent assemblies, the groupings of parts that make up a subassembly, and the overall sequence of assembly.
batch production the low-volume production of customized products.
breakeven analysis a technique that determines the volume of demand needed to be profitable; it takes into account the trade-off between fixed and variable costs.
continuous production the production of a very-high-volume commodity product with highly automated equipment.
mass production the high-volume production of a standard product for a mass market.
operations sheet a document that shows the series of operations necessary to make each item listed on the assembly chart.
process a group of related tasks with specific inputs and outputs.
process flowchart a document that uses standardized symbols to chart the productive and nonproductive flow of activities involved in a process; it may be used to document current processes or as a vehicle for process improvement.
process innovation the total redesign of a process.
process planning the conversion of designs into workable instructions for manufacture, along with associated decisions on component purchase or fabrication, and process and equipment selection.
process plans a set of documents that detail manufacturing or service delivery specifications.
process strategy an organization's overall approach for physically producing goods and services.
project the one-of-a-kind production of a product to customer order that requires a long time to complete and a large investment of funds and resources.
vertical integration the degree to which a firm produces the parts that go into its products
Texloy Manufacturing Company must select a process for its new product, TX2, from among three different alternatives. The following cost data have been gathered:
PROCESS A | PROCESS B | PROCESS C | |
|---|---|---|---|
Fixed cost | $10,000 | $40,000 | $70,000 |
Variable cost | $5/unit | $2/unit | $1/unit |
For what volume of demand would each process be desirable?
SOLUTION
If v represents the number of TX2s demanded (and, we assume, produced), then
Total cost for process A = $10,000 + $5v
Total cost for process B = $40,000 + $2v
Total cost for process C = $70,000 + $1v
Next, we calculate the points of indifference between each pair of processes by equating their total costs and solving for demand volume, v. Always begin with the process that has the lowest fixed cost and compare it to the process with the next lowest fixed cost, and so on. For this example, we'll compare process A to process B and process B to process C.
Comparison 1: Process A versus Process B
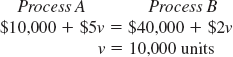
If demand is less than or equal to 10,000, we should choose the alternative with the lowest fixed cost, process A. Conversely, if demand is greater than 10,000, we should choose the aternative with the lowest variable cost, process B. At 10,000 units we can actually choose either A or B.
Comparison 2: Process B versus Process C
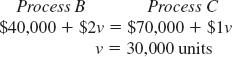
If demand is greater than 30,000 units, we should choose process C. If demand is less than 30,000 but greater than 10,000 (see comparison 1), we should choose process B. At 30,000, we can choose either B or C.
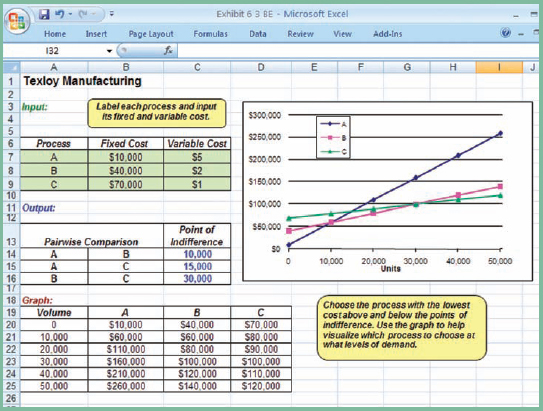
The Excel solution to this problem is shown in Exhibit 6.3.
To summarize, from the graph in Exhibit 6.3 and our decision rules, we can recommend the following process selection:
Below 10,000 units, choose process A.
Between 10,000 and 30,000 units, choose process B.
Above 30,000 units, choose process C.
6-1. Discuss the types of decisions that are involved in creating a process strategy. Apply the four elements of process strategy to the process of completing a project or paper for one of your classes. Does the process differ from class to class?
6-2. List and explain six factors that affect the decision to out-source. Explain the sourcing continuum.
6-3. Describe the four basic types of production processes. What are the advantages and disadvantages of each? When should each be used?
6-4. What are the major cost factors considered in process selection? How is breakeven analysis used for process selection?
6-5. What kind of information do the following documents communicate?
Assembly chart
Operations sheet
Process flowchart
6-6. What does process planning entail? How would process planning differ for batch and continuous processes?
6-7. Explain the basic steps involved in process innovation.
6-8. Our thinking process, limited by the paradigms under which we operate, can become very rigid. Try these out-of box thinking exercises:
Where does the letter Z belong in this pattern, above or below the line? Why?
What letter comes next in the following pattern? Why?
OTTFF
Connect the nine dots below with four straight lines. Do not lift your pencil.

Circle the three errors in the following sentence: There is three misstakes in this sentence.
6-9. Describe the factors often overlooked in the financial justification of new technology.
6-10. Briefly discuss the components of e-manufacturing. In what ways can companies collaborate in producing goods and services? Report on at least one Web source on collaborative manufacturing or e-manufacturing.
6.11. Read about issues in outsourcing from a search on the Web. Then, look at the Web site of a company that you buy from to see where their products are made.
6.12. Create a flowchart for the process of building flowcharts described on page 235.
6.13. Explore the sustainability requirements of production outsourced to different parts of the world.
6-1. Construct a process flowchart of a process with which you are familiar. Identify bottlenecks, potential failure points, and opportunities for improvement.
6-2. Create an operations chart for making pancakes.
6-3. Mikey W. Smitty, an emerging rapper, is getting ready to cut his first CD, called "Western Rap." The cost of recording the CD is $5000 but copies are $5 apiece. If the CDs can be sold for $15 each, how many CDs must be sold to break even? What is the breakeven point in dollars?
6-4. Mikey W. Smitty is confident that demand for his "Western Rap" CD will substantially exceed the break-even point computed in Problem 6-3. So, Mikey is contemplating having his CD cut at a classier (and pricier) studio. The cost to record the CD would rise to $9000. However, since this new studio works with very high volume, production costs would fall to $2 per CD.
What is the breakeven point for this new process?
Compare this process to the process proposed in the previous problem. For what volume of demand should Mikey choose the classier studio?
6-5. Patricia Zell, a dollmaker from Olney, Maryland, is interested in the mass marketing and production of a ceramic doll of her own design called Tiny Trisha. The initial investment required for plant and equipment is estimated at $25,000. Labor and material costs are approximately $10 per doll. If the dolls can be sold for $50 each, what volume of demand is necessary for the Tiny Trisha doll to break even?
6-6. Although it will fulfill her lifelong dream, Patricia is not confident that demand for her Tiny Trisha doll will exceed chooses a less appealing site and does more of the work by hand, her initial investment cost can be reduced to $5000, but her per-unit cost of manufacture will rise to $15 per doll.
What is the breakeven point for this new process?
Compare this process to the process proposed in the previous problem. For what volume of demand should Patricia choose this process?
6-7. David Austin recently purchased a chain of dry cleaners in northern Wisconsin. Although the business is making a modest profit now, David suspects that if he invests in a new press, he could recognize a substantial increase in profits. The new press costs $15,400 to purchase and install and can press 40 shirts an hour (or 320 per day). David estimates that with the new press, it will cost $0.25 to launder and press each shirt. Customers are charged $1.10 per shirt.
How many shirts will David have to press to break even?
So far, David's workload has varied from 50 to 200 shirts a day. How long would it take to break even on the new press at the low-demand estimate? at the highdemand estimate?
If David cuts his price to $0.99 a shirt, he expects to be able to stabilize his customer base at 250 shirts per day. How long would it take to break even at the reduced price of $0.99? Should David cut his price and buy the new press?
6-8. The school cafeteria can make pizza for approximately $0.30 a slice. The cost of kitchen use and cafeteria staff runs about $200 per day. The Pizza Den nearby will deliver whole pizzas for $9.00 each. The cafeteria staff cuts the pizza into eight pieces and serves them in the usual cafeteria line. With no cooking duties, the staff can be reduced by half, for a fixed cost of $75 per day. Should the school cafeteria make or buy its pizzas?
6-9. Soft Key is trying to determine how best to produce its newest product, DVORK keyboards. The keyboards could be produced in-house using either Process A or Process B, or purchased from a supplier. Cost data are given below. For what levels of demand should each process be chosen?
Fixed Cost | Variable Cost | |
|---|---|---|
Process A | $ 8,000 | $10 |
Process B | $20,000 | $ 4 |
Supplier | $0 | $20 |
6-10. NanoTech is ready to begin production of its exciting new technology. The company is evaluating three methods of production: (A) a small production facility with older equipment, (B) a larger production facility that is more automated, and (C) subcontracting to an electronics manufacturer in Singapore. The costs of each alternative are shown below. Determine for what level of demand each production process should be chosen.
Process | Fixed Cost | Variable Cost |
|---|---|---|
A | $200,000 | $40 |
B | $600,000 | $20 |
C | $0 | $60 |
6-11. Alma has decided to purchase a cell phone with Internet access and must choose a rate plan. The "occasional-user" plan is $0.50/minute, regardless of how many minutes of air time are used. The "frequent-user" plan charges a flat rate of $55/month for 70 minutes of air time plus $0.33/minute for any time over 70 minutes. The "executive" plan charges a flat fee of $75 per month for 100 minutes of air time plus $0.25/minute over 100 minutes. In the interest of simplicity, Alma has decided to go with the occasional-user plan to start with and then upgrade as she sees fit at a later date.
How much air time per month would Alma need to use before she upgrades from the occasional-user plan to the frequent-user plan?
At what usage rate should she switch from the frequent-user plan to the executive plan?
6-12. Merrimac Manufacturing Company has always purchased a certain component part from a supplier on the East Coast for $50 per part. The supplier is reliable and has maintained the same price structure for years. Recently, improvements in operations and reduced product demand have cleared up some capacity in Merrimac's own plant for producing component parts. The particular part in question could be produced at $40 per part, with an annual fixed investment of $25,000. Currently, Merrimac needs 300 of these parts per year.
Should Merrimac make or buy the component part?
As another alternative, a new supplier located nearby is offering volume discounts for new customers of $50 per part for the first 100 parts ordered and $45 per part for each additional unit ordered. Should Merrimac make the component in-house, buy it from the new supplier, or stick with the old supplier?
Would your decision change if Merrimac's annual demand increased to 2000 parts? increased to 5000 parts?
Develop a set of rules that Merrimac can use to decide when to make this component, when to buy it from the old supplier, or when to buy it from the new supplier.
6-13. Prydain Pharmaceuticals is reviewing its employee healthcare program. Currently, the company pays a fixed fee of $300 per month for each employee, regardless of the number or dollar amount of medical claims filed. Another health-care provider has offered to charge the company $100 per month per employee and $30 per claim filed. A third insurer charges $200 per month per employee and $10 per claim filed. Which health-care program should Prydain join? How would the average number of claims filed per employee per month affect your decision?
6-14. Gemstone Quarry is trying to decide whether to invest in a new material-handling system. The current system (which is old and completely paid for) has an annual maintenance cost of $10,000 and costs approximately $25 to transport each load of material. The two new systems that are being considered vary both in sophistication and cost. System 1 has a fixed cost of $40,000 and a cost per load estimated at $10. System 2 has a fixed cost of $100,000 but a per-load cost of $5. At what volume of demand (i.e., number of loads) should Gemstone purchase System 1? System 2?
6-15. Tribal Systems, Inc., is opening a new plant and has yet to decide on the type of process to employ. A labor-intensive process would cost $10,000 for tools and equipment and $14 for labor and materials per item produced. A more automated process costs $50,000 in plant and equipment but has a labor/material cost of $8 per item produced. A fully automated process costs $300,000 for plant and equipment and $2 per item produced. If process selection were based solely on lowest cost, for what range of production would each process be chosen?
6-16. Lydia and Jon order their holiday gifts through the mail. They have spent many evenings at home comparison-shopping through gift catalogues and have found all the things they need from three mail-order houses, B.B. Lean, Spoogle's, and Sea's End. The purchase price for their selections from each catalogue is given here. The shipping and handling charge per item is also given. If Lydia and Jon want to order all their gifts from the same source, which catalogue should they choose? How does the number of items ordered affect your recommendation?
B.B. Lean | Spoogle's | Sea's End | |
|---|---|---|---|
Purchase price | $400 | $500 | $460 |
Shipping/handling per item | $ 6 | $ 3 | $ 4 |
6-17. Sandra Saunders and her design team are analyzing the production costs for three alternative monitor designs. Given the cost information below, and assuming form and function are similar for each design, which monitor design would you recommend?
Monitor | Fixed Cost | Variable Cost |
|---|---|---|
A | $ 700,000 | $250 |
B | $1,000,000 | $125 |
C | $1,500,000 | $100 |
6-18. Three Bags Full is a small grocery store chain in the Lehigh Valley. The company is trying to decide whether to include a bakery section in its stores. You have been asked to run the numbers using pies as an example. Baking the pies in-house would cost $80 per day and $1 per pie. Pies can be purchased for $4 each from a local bakery, or $3 each from a large regional bakery. The regional bakery requires a minimum purchase of 25 pies per day. Which alternative would you recommend? (Hint: graph the problem.)
6-19. Keisha has been inundated with product-of-the-month offers from various marketing companies. She is considering joining a club that allows DVDs to be downloaded from a members-only Web site, but can't decide which membership offers the best deal. Given the cost information below, which club would you recommend for Keisha?
Club | Membership fee | Cost per DVD |
|---|---|---|
Almost Free Flicks | $ 40 | $5 |
Best Movies | $ 65 | $4 |
Choice Cinema | $100 | $3 |
6-20. Pete Patel is the sports liaison for the student government association. During the fall semester, the group promotes school spirit with "orange effect" t-shirts. The shirts feature a special screen-printed logo that can be expensive to make. Pete's supplier, Classic Tees, has quoted three prices for the shirts with differing logo packages, as shown below.
If the t-shirts are sold for $6 each, how many shirts would have to be sold to break even with Package l ?
Pete is considering selling the shirts for $8 each. What is the breakeven point for packages 1 and 2 with an $8 price?
Which logo package would you recommend if Pete expects to sell 75 shirts? 200 shirts?
Assuming the shirts would be sold at the same price regardless of the logo package, create a decision rule for Pete to use based on anticipated sales volume.
Package | Cost of Logo | Cost per Shirt |
|---|---|---|
1 | $300 | $4 |
2 | $100 | $6 |
3 | $0 | $8 |
6-21. Sized Rite is trying to determine how best to produce its new line of shoes for expanded feet. Demand for its w-i-d-e products is uncertain. Given the alternative processes and costs below, determine at what level of demand you would choose each process.
Fixed Cost | Variable Cost | |
|---|---|---|
Process A | $20,000 | $ 5 |
Process B | $10,000 | $10 |
Supplier C | 0 | 20 |
A Manager's Woes
Kyle Peschken has been a manager for the discount store, Zelmart, for the past two years. It's time for his annual performance review, and Kyle would like to make a big impression on the corporate staff. Walking through the store, he makes a mental note of which departments need to be straightened, which ones need to be reorganized, and which employees he'd like to schedule during the week of his review. And then he sees it—blocking the aisles, creating commotion, and looking very unprofessional—the long line in the electronics department. It's time to confront Chris, the sales clerk.
"Chris what's the holdup here?"
"I'm waiting for a manager to approve this $120 check. And then I have to show this lady a digital camera from the display cabinet. She's been waiting half an hour, and then. . . ."
"Alright Chris . . . I can help out for a little while . . . "
Two hours later, Kyle exited the electronics department disheartened. That's no way for a store manager to spend his afternoon. There's got to be a logical way to solve this, thought Kyle. He walked back to his office and wrote down the facts as he knew them.
Customer service managers (CSMs) must approve all checks over $100, and over 50% of purchases in electronics exceed $100.
It's more efficient to stage CSMs at the front of the store by the 12 checkout lines.
It takes an average of 10 minutes for the CSM to reach electronics after being paged.
Because of cost controls, the number of CSMs is limited to two per shift, and there is no room in the budget for additional hires of any type.
Electronics must be purchased in the electronics department (to prevent theft).
Store policy allows customers to check out other items at the electronics counter if they are making purchases in that department. (This makes sense especially if the customer wants to write a check for the entire purchase.)
Store clerks must monitor the locked cabinets and stay with a customer who wants to view an item from the cabinet.
Because of the size of the enclosed department, only two checkout counters will fit in electronics.
Moving the electronics department to the front of the store would not be wise because shoppers tend to pick up impulse items on their way to the center of the store where electronics are located.
The average time a customer spends in electronics during peak periods is an unacceptable 40 minutes.
Help Kyle come up with a solution to his inefficient department. Draw a flowchart of the current process from the customer's point of view and try to identify areas for improvement. If small improvements will not fix the problem, try a more innovative approach. Chart out your suggestions and bring them to class. [It may help to visit a similar store and watch their checkout process.]
Wrong Meds, Again!
"It was horrible," said the distraught client. "No matter how many times I provided the information, no one listened to me. And they obviously didn't listen to each other either, because they used the wrong meds . . . again."
"Okay, calm down. Now tell me what happened from the beginning," urged Melanie Torrent, the Quality Assurance Manager for Hope Memorial Hospital.
"I got a call at work saying my father was being taken to the hospital from the nursing home. The nursing home always sends a list of medications with the ambulance, but when I got to the emergency room, they were asking my dad what medications he was taking. Of course my dad told them he wasn't taking any medications and they believed him! He's sent to the emergency room from a nursing home and they decide it's reasonable for him not to be on any medications . . . so of course I corrected him and told them to find the medication list. I don't know whether the ambulance driver forgot to bring in the list, or gave it to the wrong person, or what, but they couldn't find it. My dad must be on 12 different medications so I wasn't sure I could remember them correctly. I called the nursing home and we went over the list with them, and then I gave the handwritten list to the nursing station.
In the meantime, my dad was admitted to the hospital and moved to a hospital room. Again, a nurse came in with a computer and asked me to tell them what meds he was talking. I tried to tell them that the emergency room had the list, but she said it would be the next morning before the list got updated online. Nevertheless, the nurse called down to the emergency room and was faxed up the list of medications. Only the fax was unreadable, so they came back to me. It was a few hours before his next meds were due, so I drove over to the nursing home, had them make several legible copies of the meds list and drove back to the hospital. I gave the nurse the list, kept one for myself and posted the other on the bulletin board in my dad's room. The nurse thanked me and said she'd take care of it at the end of her shift.
After a long night at the hospital, I woke up the next morning to see my dad hallucinating. I knew immediately what had happened—there's a certain drug that he has this reaction to. I ran down to the nurse's station and had her look up the medications he had been given. Sure enough, it was there, along with several other medications he should no longer be taking. Turns out, the list was from two years ago when he had last been admitted to the hospital! How could they have made that kind of mistake—using data from two years ago?"
"That is something we'll look into. More importantly, has your father been taken off the drug?"
"Yes."
"And has the medication list been corrected?"
"Yes."
"And how is he doing today?"
"Fine today, but it could have been more serious and I think you should look into changing your procedures so this doesn't happen again . . ."
"I appreciate you bringing this to my attention. I will speak to the persons involved and I assure you this will not happen again. Hope Memorial prides itself on being a caring and responsible health care provider. Now if you'll excuse me, I have another client to see . . ."
Trace the path of the medication list and denote possible failure points. Construct a process flowchart of the existing process and create a new chart of an improved process.
Was the medication error a failure of individuals or a failure of the process? Explain.
Think about the different settings, the ambulance, the emergency room, the hospital room, and the nurse's station. How is data handled in each scenario? Can the process of recording information be changed so that every one is using the same data? How can the accuracy of the data be assured?
Given Melanie's reaction, do you think this error will happen again? Why or why not?
The DPA Protocol
Blake is an intern in the Department of Performing Arts (DPA) at State University. One of his duties is to schedule end-of-term recitals for the department's graduating seniors and to create and distribute programs for those recitals. The recitals for each student include several performance pieces and often feature classical pieces with foreign titles and composers. The students submit a request for recital online and are sent an email confirmation of their recital schedule (from Blake). With that confirmation is a reminder that the material for the program needs to be submitted by a certain time. Generally, these are emailed to Blake, who puts them in standard program format and prints, folds, and distributes them to the recital venue on the evening of the performance. The department has recently been-embarrassed by mistakes in the programs, and after verifying that the source of the error is usually with the student, not Blake, the department has created a new protocol to improve the process.
Below are copies of emails about the new protocol. Create a flowchart of the old and new protocols and identify where problems or delays might occur. What would you do to improve the process?
Bedworth, D., M. Henderson, and P. Wolfe. Computer-Integrated Design and Manufacturing. New York: McGraw-Hill, 1991.
Bylinsky, Gene. "Hot New Technologies for American Factories." Fortune Now (June 26, 2000).
Curan, Thomas, Gerhard Keller, and Andrew Ladd. SAP R/3 Business Blueprint. Upper Saddle River, NJ: Prentice Hall, 1998.
El Sawy, Omar. Redesigning Enterprise Processes for e-Business. New York: McGraw-Hill, 2001.
Foston, L. Fundamentals of Computer Integrated Manufacturing. Upper Saddle River, NJ: Prentice Hall, 1991.
Hammer, Michael, and James Champy. Reengineering the Corporation. New York: HarperCollins, 1993.
Hammer, Michael, and Steven Stanton. The Reengineering Revolution. New York: HarperCollins, 1995.
Hayes, Robert, Gary Pisano, David Upton, and Steven Wheel-wright. Operations Strategy and Technology: Pursuing the Competitive Edge. Hoboken, NJ: Wiley, 2005.
Hunt, V. Daniel. Process Mapping. New York: Wiley, 1996. Keen, Peter. The Process Edge. Boston: Harvard Business School Press, 1997.
Nevens, J., D. Whitney, T. DeFazio, A. Edsall, R. Gustavson, R. Metzinger, and W. Dvorak. Concurrent Design of Products and Process: A Strategy for the Next Generation in Manufacturing. New York: McGraw-Hill, 1989.
Noori, H. Managing the Dynamics of New Technology. Upper Saddle River, NJ: Prentice Hall, 1990.
Reinhardt, Andy. "Log On, Link Up, Save Big." BusinessWeek (June 22, 1998), pp. 132–138.
Richards, Bill. "Superplant." eCompany Now (November 2000).
Skinner, W. Manufacturing: The Formidable Competitive Weapon. New York: Wiley, 1985.
Teresko, John. "The Dawn of e-Manufacturing." Industry Week (October 2, 2000).
Valery, N. "Factory of the Future." The Economist (May 30, 1987), pp. 3–18.
Worldwide Robotics Survey and Directory. Pittsburgh: The Robotic Institute of America, 1999.
Zurawski, Laura, and Mark Hoske. "E-manufacturing: A Catchy Name for What You Should be Doing Anyway." Control Engineering (February 13, 2001).
[11] Process innovation is also known as business process reengineering (BPR), process redesign, restructuring, and many other company-specific terms.
[12] Although process innovation means redesigning the process from scratch, it does not mean that the existing process should be ignored. The existing process should be studied long enough to understand "what" the process is and "why" it is performed. Exactly "how" it is performed is less relevant because the how will change dramatically during the course of the project.