Chapter 4
Warming Up to the Solar Resource
IN THIS CHAPTER
![]() Understanding solar radiation
Understanding solar radiation
![]() Seeing the effects of the sun’s path
Seeing the effects of the sun’s path
![]() Making the most of the solar resource with proper module placement
Making the most of the solar resource with proper module placement
Akey consideration in the overall performance of any PV system is how the installed system can use the sun’s energy most effectively. For the array to perform at its best, you need to install it so that it has access to as much energy as possible. Because sunlight is the “fuel” for any PV array, you want to make sure your arrays have full access to as much of the solar resource (the sunlight striking your site) as possible. Having a fundamental understanding of the relationship between the sun and earth allows you to properly site the PV array.
In this chapter, I introduce you to the different forms of solar radiation and how they affect the production of a PV array. I also present you with the keys to understanding how the sun’s path affects your location. Finally, I give you language to use when describing the exact positioning of PV modules in relation to the solar resource.
Note: I don’t expect you to become an astronomer or dissect solar radiation into its different energy values after reading this chapter. I just want you to focus on the crucial concepts that’ll affect your everyday decisions when it comes to installing any PV array.
High (Or Low) Energy: Solar Radiation
Solar radiation is the term I use to describe the energy that’s sent to the earth from the sun. Having a good understanding of solar radiation is vital because solar radiation is the driving force for all PV systems. In the following sections, I get you familiar with the various components of the radiation that affects PV modules and help you differentiate between the power and energy values that come from it. I also explain how you can use readily available tools to evaluate the amount of energy received from the sun in the area where you’re working.
Distinguishing between direct radiation and diffuse radiation
The sun, that great nuclear reactor in the sky (and here you thought I wasn’t going to acknowledge nuclear energy’s role in the need to address the world’s power sources), is constantly hurling radiation toward earth. Approximately eight minutes after that radiation leaves the sun, the surface of the earth is assaulted by it. The exact amount of radiation and how you describe it depends on the planet’s atmospheric conditions. On a clear day, there’s little to interfere with the radiation; on a rainy day, the cloud cover greatly reduces the radiation that can reach you.
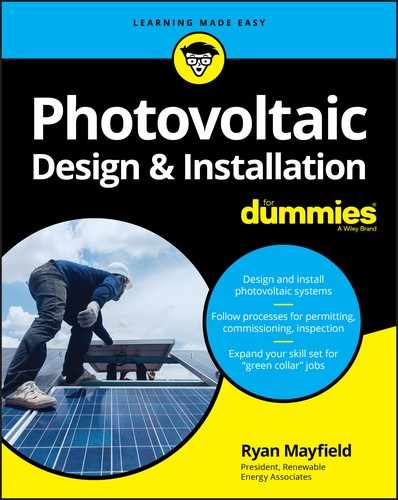
 When you work with PV systems, two main components of the sun’s radiation dominate your attention: direct and diffuse radiation. Both contribute to the overall radiation levels on earth, but it’s important to remember that they’re two separate pieces (see Figure 4-1 for a representation of these radiation components).
- Direct radiation: The direct radiation from the sun isn’t intercepted as it travels from the sun to the earth’s surface. It therefore makes the greatest contribution to a PV array and has the biggest effect on the array’s ability to convert sunlight into electrical energy. On clear, sunny days, the vast majority of the solar radiation experienced is in the form of direct radiation.
-
Diffuse radiation: The sun’s diffuse radiation takes a more roundabout path to the earth. Typically clouds, water vapor, dust, and other small airborne particles block and scatter the diffuse radiation’s path to the planet’s surface. The diffuse component of solar radiation therefore plays a minor role in the power output of a PV module. However, on days when clouds cover the sky, all the radiation is in the form of diffuse light without any direct radiation component.
Another form of diffuse radiation, albedo radiation (or reflectance), is part of the solar radiation at a site. It’s light that’s reflected from physical surroundings, such as a roof or the ground, and put back into the atmosphere as diffuse radiation.
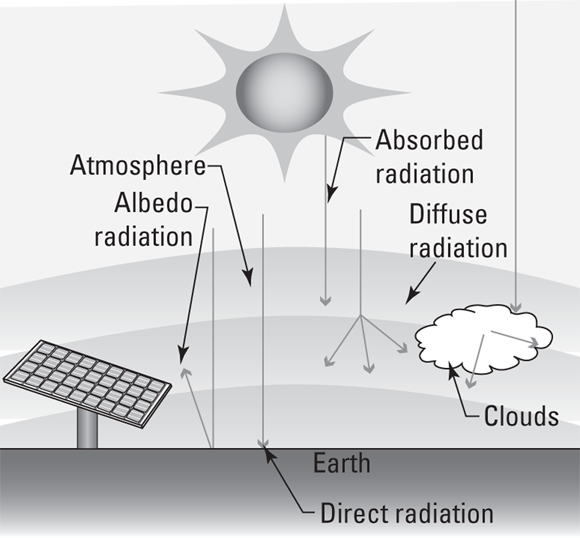
FIGURE 4-1: Direct radiation and diffuse radiation are the components of solar radiation.
The total global radiation received at a given site is the sum of the direct, diffuse, and albedo components.
 To help you better understand solar radiation, think of it as money coming into your possession: Direct radiation is like the money you get from your paycheck, and diffuse radiation is like the money you get from an interest-bearing savings account. On days when you get a lot of work (the sunny days), your paycheck (direct radiation) is the major contributor to your bankroll; the savings account interest (diffuse radiation) contributes only a small amount. On the days when work is lean (those dark, gray days), your paycheck may contribute very little, if at all, to your wallet, whereas the savings account interest still contributes a small amount to your net worth.
 One measurement that affects the solar radiation striking the earth is air mass, or the amount of atmosphere the radiation must pass through to reach the earth’s surface. You don’t need to spend too much time on the subject, but keep in mind that PV module manufacturers use a standard air mass value when rating their modules.
Determining the intensity of solar radiation: Irradiance
After you know a little bit about the components of the radiation coming from the sun (which I share in the preceding section), you can throw some numbers into the mix. The term for the intensity of the solar radiation striking the earth is irradiance, and it’s a measurement of power over an area (power is the rate of the flow of energy; jump to Chapter 3 if you need a refresher on power and other electricity basics). The standard units associated with irradiance are watts per square meter (W/m2), but you can also easily refer to them as kilowatts per square meter (kW/m2).
The amount of irradiance striking a PV module at any given moment is affected by a number of factors, including the location of the module, its position relative to the sun, the time of year, and the weather conditions. I cover most of these factors later in this chapter; in the next sections, I explain the irradiance-related basics that you need to know.
Recognizing special conditions that can affect irradiance
Some common occurrences increase the irradiance levels striking PV modules:
- Albedo radiation: Also known as reflectance, albedo radiation comes from light-colored materials, such as snow or a white roof, in the array’s vicinity. Increases due to albedo radiation generally aren’t extreme, but they can have a measurable impact, with increases as much as 5 to 10 percent (see the earlier “Distinguishing between direct radiation and diffuse radiation” section for an introduction to albedo radiation).
- The edge-of-cloud effect: This is where a cloud passes over the PV array and prevents the sun from striking the array. As the cloud moves past the sun, the edges of the cloud actually concentrate the solar radiation and increase the irradiance values on the array. These occurrences are generally short-lived (the longest one I’ve ever seen recorded was 15 minutes), but they can increase the irradiance by more than 25 percent.
So should you try to increase irradiance through the use of mirrors or other reflective surfaces? The short answer is no. PV modules have been manufactured to operate without these enhancements. Adding them actually causes modules to deteriorate faster than normal, so the net effects are a shorter life span and a smaller energy output.
Checking out charts to see irradiance differences
One way to really tell the difference between irradiance on sunny versus cloudy days is to examine charts that measure all the irradiance values, like the ones in Figures 4-2 and 4-3 (the values shown are in W/m2).
- As you can see in Figure 4-2, the irradiance levels for a location on a perfectly cloudless day look a lot like a haystack curve. The irradiance values are at 0 W/m2 at night and begin to climb as the sun rises in the sky. The irradiance values peak at solar noon and then decrease as the sun starts its descent to sunset. (Notice how the y-axis of the graph, which represents the irradiance values, doesn’t have any numbers associated with it? That’s because this graph is just meant to show you the typical look of the irradiance values over the course of one day.)
- In contrast, Figure 4-3 shows that the irradiance levels on a partially cloudy day are much more erratic. The amount of irradiance measured moves up and down, indicating the movement of clouds between the sun and the array.
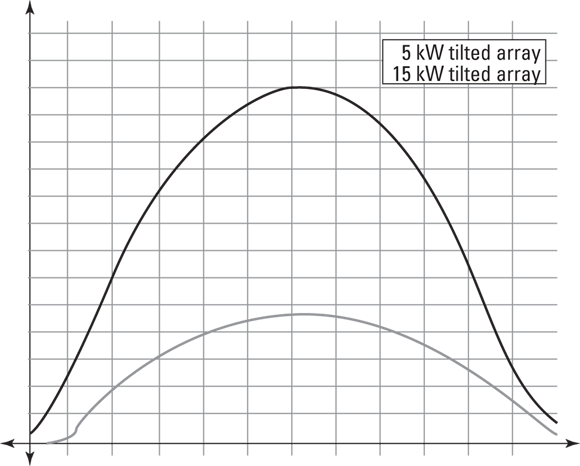
FIGURE 4-2: Irradiance measured on a cloudless day.
FIGURE 4-3: Irradiance measured on a partially cloudy day.
Relating current and voltage to irradiance
PV modules produce current (the flow of electrons) and voltage (the pressure that makes electrons move) when exposed to sunlight and the electrons are given a path to flow in. Although voltage isn’t greatly affected by irradiance, current is directly dependent on irradiance. As soon as ambient light is present (at sunrise or even during a cloudy day), the PV module will have nearly full voltage present. Current, on the other hand, will vary throughout the day as the irradiance values increase and decrease.
The exact amount of current produced by a module is directly proportional to the irradiance level. The brighter the sun is (high irradiance), the more current will flow. So when you’re inevitably asked whether PV works under cloudy conditions, know that the answer is (a qualified) yes. Because the irradiance levels are so low on cloudy days, very little current is produced, which means the PV module can provide only a little power on cloudy days (this is true whether the PV system uses batteries or is connected directly to the utility).
As I explain in Chapter 6, all PV modules report their voltage and current levels at standard test conditions (STC). For irradiance, this value is 1,000 W/m2, and it’s often given the name peak sun. You can think of peak sun as the intensity of the sun at sea level on a nice, sunny day. It isn’t the maximum irradiance you’ll ever see, but it is a point on the chart. (Actually, you have no control over the amount of irradiance striking the modules, which is why you must add some safety factors when sizing conductors and safety components; refer to Chapter 13 for the details on this.)
Measuring irradiance with a pyronometer
You can measure irradiance on the job site to estimate the current value from the module or array and compare that to the actual current measurement you make with a digital multimeter (see Chapter 3 for details on measuring current). Irradiance measurements are used most often for data collection and in troubleshooting applications. Because the amount of current flowing from the array is directly related to the irradiance, by measuring and comparing both, you can quickly determine whether the PV array is performing to expectations. I show you how to make this comparison in Chapter 6.
Never try to measure irradiance without a pyronometer. You’ll do a horrible job if you try and “eyeball” it. Pyronometers allow you to point the meter in any direction and obtain a numerical value of the irradiance. You can buy a small hand-held unit for about $150, or you can invest in a high-accuracy meter (like the kind used in laboratory environments) for thousands of dollars. Personally, I recommend the less expensive kind, especially if the pyronometer is going to live in your toolbox.
To use a pyronometer, simply turn the device on, place the sensor in the same plane as the array, and read the meter. Keep in mind that the sensor consists of a small PV cell that has been calibrated at the factory. It may not be the most accurate tool, but it’s a handy device for what you need.
Calculating solar radiation energy: Irradiation
A successful PV system designer and installer not only knows how to track irradiance levels over the course of the day (I cover irradiance earlier in this chapter) but also how to calculate the energy values from the solar radiation at the site. These energy values are referred to as irradiation and are based directly on the irradiance levels received. You use irradiation values to help figure out how much energy a PV array will produce at a particular site.
As I explain in Chapter 3, energy is determined by multiplying power (measured in either watts or kilowatts) by a duration of time, typically an hour. Consequently, energy is typically measured in kilowatt-hours (kWh). The power received from the sun is measured in W/m2, but with a quick conversion (1,000 W = 1 kW) you can transform that into kW/m2. If you take that power value and multiply it by the number of hours that receive that much irradiance, the result is kWh/m2.
However, as you can see if you refer to Figures 4-2 and 4-3, irradiance values aren’t constant for hours at a time. In fact, they can change with the blink of an eye, which leads to the following question: If the irradiance values are only constant for seconds, or minutes at best, how am I supposed to take that information and turn it into kWh/m2, which is the energy value I really need?
Love it or hate it, the answer lies in calculus. What you’re really after is the area beneath the curve, and you can find it with a few quick calculations. If you’re a calculus-hater, you’re in luck — I don’t mess with any advanced math here. That’s because the good folks at the National Renewable Energy Laboratory (NREL) have done the hard work of calculating areas beneath curves and have broken down the results into a single number for easy use.
Take a look at Figure 4-4. It’s actually the same irradiance curve as the one I present in Figure 4-2 for a perfectly cloudless day, with the exception of a square box drawn over the curve. This box represents the equivalent area covered by the curve. In other words, the NREL has turned a curve into a box. As I show you later in this chapter, the NREL publishes this information for a number of locations for your reference.

FIGURE 4-4: An irradiance curve with a box over it can help you calculate irradiation.
With the area beneath the curve represented as a box, you have one irradiance value to use and an easily defined number of hours. Now you can simply take the irradiance value, multiply it by the number of hours, and find the energy value (yes, that’s right — irradiation). For example, if the top of the box intersects the irradiance line at 850 W/m2 and the number of hours is equal to 4, then you can calculate the energy received at this location as follows:
850 W/m2 × 4 hours = 3,400 Wh/m2 = 3.4 kWh/m2
Just for a day: Peak sun hours
Typically, irradiation values have an associated time period, such as the number of kWh/m2 over the course of a day, month, or year. As a PV designer, plan to look at all of these periods, but focus on the daily values.
The amount of solar energy received at a particular location each day is measured in terms of the energy per unit area per day (kWh/m2/day). The PV design lingo for this numerical value is the number of peak sun hours or insolation. In the sections that follow, I explain how to use peak sun hours to determine a PV array’s energy output and point you toward some handy charts and maps that list peak sun hours.
The terms peak sun hours and insolation are used interchangeably because both refer to the solar energy received at a site over the course of one day. They’re also both measures of irradiation (solar energy), but they have a specific time value (one day) associated with them.
Using peak sun hours to calculate energy output
In the earlier “Relating current and voltage to irradiance” section, I tell you that the term peak sun refers to an irradiance value of 1,000 W/m2. Well, the number of peak sun hours describes the number of hours each day that the irradiance value equals 1,000 W/m2.
You probably don’t even have to refer to Figure 4-4 to remember that the sun doesn’t just pop up over the horizon, go to 1,000 W/m2, and sit there all day. At times, the irradiance values will be very low; other times, they’ll be very high. The number of peak sun hours is merely an estimation of the amount of time each day that the irradiance is equal to a peak sun. And because PV models are rated for their output under peak sun conditions, the number of peak sun hours each day indicates how many hours each day the PV array will operate at its full power output.
I think an example, complete with numbers, would be a good idea here. To start, divide your insolation value by peak sun to get a number of hours per day. Check out the example in the earlier “Calculating solar radiation energy: Irradiation” section, where the box in Figure 4-4 intersects the irradiance line at 850 W/m2 and the amount of time is 4 hours. The result of the equation is 3,400 Wh/m2 of energy (or 3.4 kWh/m2). Because this measurement was taken during a single day, it’s actually an insolation value (3.4 kWh/m2/day). By dividing that value by one peak sun (1,000 W/m2, which is equal to 1 kW/m2), you get the number of hours each day that the PV array will operate at its rated output.
3.4 kWh/m2/day ÷ 1 kW/m2 = 3.4 hours/day
You then multiply this number of hours by the power value of a given array to figure out the expected maximum energy output. So if I have a 3 kW array on my house and the number of peak sun hours today is 3.4, I can calculate the expected energy output by multiplying the two together.
3 kW array × 3.4 peak sun hours = 10.2 kWh of energy
Note: The number of peak sun hours varies with a number of factors, most notably the time of year and your position on the globe. I show you more details on these effects later in this chapter.
Referring to handy charts and maps
After you know how to make calculations using peak sun hours, how do you know precisely what peak sun hour numbers to use for your client’s area? NREL to the rescue! You can find peak sun hours data for more than 200 U.S. locations on the NREL Web site at rredc.nrel.gov/solar/pubs/redbook. Granted, other sources of peak sun hours data are out there and you can spend a lot of time dissecting all of them, but I show you the NREL data so you can acquire a fundamental understanding.
In Figure 4-5, you see an example of the data set NREL publishes in its Solar Radiation Data Manual for Flat-Plate and Concentrating Collectors. (Nicknamed “the NREL Redbook,” this resource also has a good introduction to help you better understand all the terms the Redbook uses in its charts.) Although all the values shown are based off of arrays that point true south, these tables also list multiple solar resource values based on the tilt of a PV array that’s positioned on a horizontal surface rather than a vertical one. On the left-hand side of Figure 4-5, you see 0°, Latitude –15°, Latitude, Latitude +15°, and 90°. Latitude –15° means the tilt angle of the PV array off of the horizontal is equal to the local latitude minus 15°. (I get into the details of these values later in this chapter. For now, just focus on the fact that the PV array is moving from flat to vertical as you look down the far-left column.)
Source: National Renewable Energy Laboratory
FIGURE 4-5: An example of NREL peak sun hours data.
As you move horizontally across any of these different tilt-angle designations, you see numerical values for the number of peak sun hours for each month. The unit for these values is kWh/m2/day, or peak sun hours. Think of it as the average number of hours each day of that month when your PV array will operate at its rated output.
If you keep moving to the right along any row, you see that the last value is the average peak sun hours for the year for an array at that particular location. You can quickly compare this value among all the tilt angles listed to get an idea of the best tilt angle for an array at the client’s specific location. (I tell you all about tilt angles later in this chapter and about evaluating your client’s site in Chapter 5.)
As a general rule, the number of peak sun hours increases as you move from winter to summer and then begins to decrease again as you move back toward winter. The exact amount of change is dependent on the tilt angle of the array and the latitude.
You can get an idea of the peak sun hours available across the United States in Figure 4-6. As you can see, the greatest amount of peak sun hours occurs in the southwest, and the numbers decrease as you move north. This chart can help you generalize and compare your location to others, but you should only use it to create a rough estimate of your location. You always need to look up the specific site you’re working in to make an accurate energy-production estimate.

FIGURE 4-6: An insolation map of the United States.
Examining the Effects of the Sun’s Path on the Earth
To succeed as a PV system designer and installer, you need to have a firm grasp on the relationship of the sun and the earth, particularly in terms of how they’re positioned relative to each other throughout the calendar year. For someone in northern Alaska, these changes are much more dramatic than for someone in Hawaii, but you need to understand the concepts regardless.
In the following sections, I describe general seasonal effects based on the earth’s movement, the sun’s relationship to your client’s specific location, and solar time; I also explain how to analyze sun charts and introduce the solar window.
Getting a grip on seasonal effects
The number of daylight hours each day has an obvious effect on a PV array’s production: More sun means more solar energy. As a PV installer, you need to be able to visualize how the position of the sun changes with each season and the effect that has on the arrays you’re designing and installing. In other words, you need to be able to take seasonal effects into account.
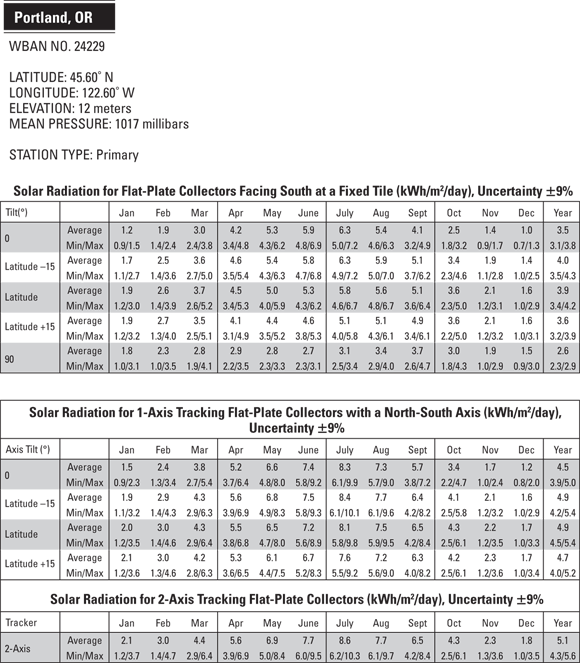
One important factor to consider is the motion of the earth around the sun. Earth takes an elliptical path around the sun, meaning that on the summer solstice (approximately June 21), the earth is actually at its farthest point from the sun. On this day, the Northern Hemisphere is tilted toward the sun, and that half of the world has its longest day (and shortest night) of the year. Time moves on, and the earth continues to orbit the sun. On the winter solstice (approximately December 21), the planet is as close to the sun as it’ll ever get; on this day, the Northern Hemisphere is tilted away from the sun, creating the shortest day and longest night.
The other factor to consider when it comes to seasonal effects is the tilt of the earth’s axis. When viewed from space, the earth’s axis has a tilt of 23.5 degrees. Because of this tilt, during the times between the spring equinox (approximately March 21) and the fall equinox (approximately September 21), the Northern Hemisphere is actually pointing toward the sun, whereas the Southern Hemisphere is pointed away from it (see Figure 4-7). As the earth’s orbit continues toward winter, the hemispheres swap their positions, so the Northern Hemisphere points away from the sun, and the Southern Hemisphere points toward the sun. On the equinoxes, the earth isn’t pointing toward or away from the sun; instead, it’s directly perpendicular with it.
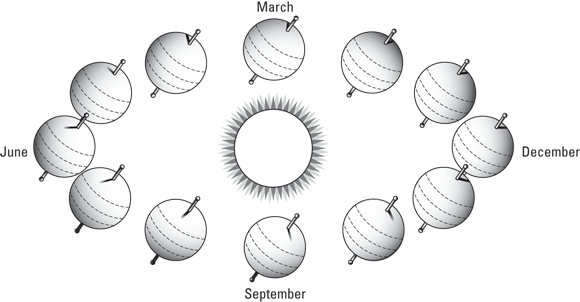
FIGURE 4-7: The earth’s movement around the sun.
Take a look at Figure 4-8 and pretend that your perspective of earth is the same as the sun’s (doing so helps you visualize how the tilt of the earth affects the amount of sunlight striking any part of the earth). Notice how the tilt during the winter and summer restricts the sun’s access to the hemispheres that are pointed away from the sun and how the sun has full access to the entire globe on the equinoxes.
- On the summer solstice, the sun is directly over the Tropic of Cancer in the Northern Hemisphere, where the latitude equals 23.5 degrees. This is the date when the Northern Hemisphere receives the most sunlight.
- On each of the equinox dates, the sun is directly perpendicular to the equator. On these dates, the earth receives equal hours of light and darkness because it’s pointed neither toward nor away from the sun.
- Finally, on the winter solstice, the Northern Hemisphere experiences its longest night of the year and shortest day because the North Pole is pointed 23.5 degrees away from the sun, and the Tropic of Capricorn in the Southern Hemisphere is perpendicular to the sun.

FIGURE 4-8: How earth’s tilt affects the amount of daylight on the solstices and equinoxes.
Understanding the sun’s relationship to your location: Altitude and azimuth
As I show you in the preceding section, the motion of the sun across the sky is due to the tilt of the earth in relationship to the sun and the path the earth takes around the sun. (Yes, I know the sun is the stationary object, and the earth is actually orbiting the sun. But for simplicity’s sake, I refer to the sun moving across the sky and how the sun’s position changes.) In the next sections, I show you how these facts relate to where you sit on earth because as a PV system designer and installer, that’s what you really care about.
When talking about the sun’s position in the sky, I use a couple key terms: altitude and azimuth. The altitude refers to how high in the sky the sun actually is, and the azimuth describes where the position is in relation to north. (Check out Figure 4-9 to get an idea of what I’m talking about.)

FIGURE 4-9: Altitude and azimuth.
Altitude
You’re probably well aware that the angle of the sun off the horizon varies throughout the year. The amount of variation is consistent across the globe, with the exact measurement dependent on the time of day and your specific latitude on the earth.
Latitude is defined as the number of degrees north or south of the equator. Your latitude affects where the sun is positioned in the sky throughout each day (relative to your position, that is). I explain how to visualize these solar positions with the help of sun charts later in this chapter.
To view the changes in the solar altitude, picture yourself standing on the equator for an entire year (I suggest picturing yourself with your favorite cold beverage in hand because a year can be a long time). On the spring equinox, the sun is directly overhead, or 90 degrees from your perspective. As the earth continues to orbit the sun, it moves toward the summer solstice. When it gets to June 21, the sun is no longer directly over your head; it has actually moved 23.5 degrees to the north. As the earth continues its path, it comes back around to the fall equinox, and the sun is directly overhead once again. And as you can probably figure out by now, when the earth moves to the winter solstice position, the sun is now 23.5 degrees to the south of your location on that day. By the time the earth gets back to March 21, your year is over, and the sun is again directly overhead.
You can now apply this motion and sun-to-earth relationship for any latitude on earth. The position directly over your head is known as the zenith angle, and it has a numerical value of 90 degrees. The sun’s highest altitude on each and every equinox is the zenith angle (90 degrees) minus the latitude you’re standing at. Alternatively, the sun is at a position of 23.5 degrees greater than the equinox position on the summer solstice and 23.5 degrees less than the equinox position on the winter solstice (in the Northern Hemisphere, that is; in the Southern Hemisphere, the calculations are the same except that the summer solstice down there is December 21 and the winter solstice is June 21). If you’re having trouble with this concept, head to the later “Interpreting sun charts” section; the charts really help drive this point home.
Azimuth
Just as the sun has a position in the sky based off of the horizon (altitude), it also has a position in the sky that moves from east to west. This position is known as the solar azimuth, and it has a steady movement on a daily basis.
The earth rotates around its own axis once every day, or once every 24-hour period. Because a full rotation of the earth measures 360 degrees, the motion of the sun is 360 degrees divided by 24 hours, which equals 15 degrees per hour. So over the course of an hour, the motion of the sun from east to west is 15 degrees.
Typically, north is considered the zero point, and the number of degrees the sun is from that point gives you the azimuth angle. The zero point is true north (I go over true north and south versus magnetic north and south in Chapter 5). Using this convention, when the sun is at a position directly to the east of your location, it can be described as having an azimuth of 90 degrees. If it’s directly to the south of your position, it has an azimuth of 180 degrees. And when it moves due west of you, it has an azimuth of 270 degrees.
With this convention, you don’t need to give a direction as well as the number of degrees because the numerical value tells the whole story. Not all sources use this convention though. Some use south as the zero point and require you to designate the direction (east or west) along with a numerical value to describe the position of the sun along the horizon. I find it easiest, however, to keep the convention with zero being north, east at 90 degrees, south at 180 degrees, and west at 270 degrees.
Ticking off solar time
One point worth noting is the difference between solar time and clock time because the two very rarely match. When looking at your client’s location, you care about locating the array based on solar time, not necessarily the time on your watch. The sun (and lucky ol’ Arizona and Hawaii) doesn’t have a clue about daylight saving time; it operates solely on solar time.
Jumping from clock time to solar time when you’re in the field isn’t a crucial task. You need to be aware of the distinction, though, especially when you’re discussing the solar window (which I fill you in on later in this chapter) and how that window relates to your client’s site. In Chapter 5, I explain how to appropriately apply this window.
Interpreting sun charts
Sun charts allow you to figure out how the sun’s path looks on paper. You can use them to pinpoint the sun’s location at any time of day and any time of year, which is helpful when you’re evaluating a particular site for potential shading issues. The sun charts in this section are the basis for the shading-analysis tools I describe in Chapter 5, so don’t skip over this material.
The solar resource available at a location is affected by that location’s position on the globe, the time of year, and the local climate. However, the path of the sun may look exactly the same in two very different locations. For example, from where I sit in Oregon, the path of the sun on a daily basis will appear identical to someone in Milwaukee, Wisconsin, because we’re sitting at similar latitudes, but the exact number of peak sun hours (solar energy) we experience each day will be different because of the differences in our weather patterns. So I may not notice any differences in the days when I go to watch the Milwaukee Brewers play some baseball, but if I bring my PV array with me, it’ll probably perform differently than it does back home in Oregon.
Figure 4-10, the sun chart for 30 degrees north latitude shows a typical sun path. The curves represent the path of the sun across the sky for various times of the year. The tallest curve is the path of the sun on the summer solstice, the middle curve represents the equinox paths (March 21 and September 21), and the lowest curve is the path on the winter solstice.
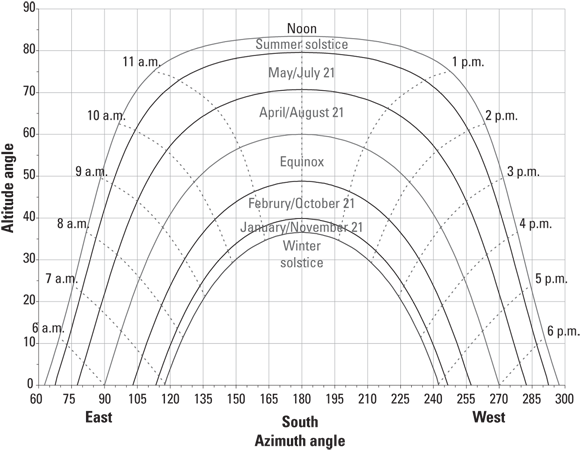
FIGURE 4-10: A sun chart for 30 degrees north latitude.
You can use a sun chart like the one in Figure 4-10 to quickly and accurately determine the sun’s altitude and azimuth. The azimuth angle is given along the x-axis, and the altitude angle is given along the y-axis. The times of day, which are based off of solar time (see the preceding section), are indicated by the dashed lines that intersect the sun paths moving east to west.
Notice that at solar noon on the equinox dates, the altitude of the sun is equal to the zenith minus the latitude (90 degrees – 30 degrees = 60 degrees). You can further evaluate the sun chart to see that the altitude difference between summer solstice and the equinox at solar noon is 23.5 degrees.
See how the sun rises north of east and sets north of west during the summer and just the opposite during the winter? All of these parts of sun charts help you understand the path of the sun and describe the solar window, which is the basis of your solar site assessments; I introduce you to the solar window in the next section.
One thing I find extremely fascinating is the fact that no matter your latitude, the sun rises due east of south and sets due west of south on the equinox dates. When you stop and think about it in terms of the earth’s relationship with the sun, as I describe earlier in this chapter, it makes sense. Nonetheless, it always strikes me as an interesting fact of life.
Opening up to the solar window
If you think about the motion of the sun across the sky at your location, you can imagine it appearing at various positions over the course of a year. In fact, this movement is very predictable and relatively easy to represent with the sun charts described in the preceding section. All the points between the solstices can be defined as the solar window. Figure 4-11 shows the portion of the sky considered in the solar window.
FIGURE 4-11: The solar window.
The path of the sun on each solstice date defines the extreme sun paths for a location. By defining these two paths, you know that the sun will always be within that “window” every day of the year. (The solar window is represented by the half gray, half clear arc in Figure 4-11.) As you design a PV system, your goal is to keep as much of that window open for the PV array as possible. If a tree or building is inside that window, the PV array will be shaded for some amount of time, reducing the energy output.
The exact solar window varies based on the latitude of your client’s site, but it’s equally important regardless of location. Because the sun will always appear in the solar window over the course of a year, you need to keep this window clear from objects that will cast a shadow on the PV array. You don’t have to go to the ends of the earth to make every minute of this window clear, but you should plan for the window to be open three hours before and three hours after solar noon every day of the year. I cover how to apply this window when selecting a site for your client’s PV system in Chapter 5.
Positioning PV Modules to Make the Most of the Solar Resource
After you know how the sun moves at your client’s location, you need to relate that movement to the placement of the PV modules. The angle off of the horizon on which the modules are mounted and the direction they’re pointed in reference to true north are the key factors for your installation. I explain some basics to know in the sections that follow; flip to Chapter 5 for full details on performing a site-survey analysis for a PV system.
Introducing tilt angle
Tilt angle is the number of degrees the PV modules are mounted off of the horizon. It’s a critical consideration in any PV system installation. Installations vary from nearly flat on some large commercial roofs (called low-slope roofs) to a very slight tilt (5 to 10 degrees) in some applications to vertical walls (which are at a 90-degree angle) and everything in between.
Tilt angle is one component in the goal of pointing the PV array toward the sun. The exact location and angle you place the modules will likely be based on a combination of design considerations, including
- Aesthetics: Even though the PV nerd in me cringes to think of any sacrifice in energy production, the realist in me knows that if PV installations look like absolute garbage on customers’ houses, the industry as a whole loses. So please keep in mind the aesthetics of the final product before you go trying to get every last kilowatt-hour out of an array. Making aesthetics a priority means you may need to mount the PV array on a roof with a tilt angle other than the optimal tilt in order to keep the array from looking like an art project gone terribly wrong.
- The end goal: Another consideration is what the end goal of the PV system is. If the system
- Will be used as the primary power source in an off-grid home, then you want to do all you can to tilt that PV array at the optimum value for the client’s location
- Is a grid-direct system in suburbia, you can take a hit on production by installing the array at a less-than-optimum tilt to maintain a reasonable installation because the utility will be present to help with power demands that are greater than what the PV array can produce
- Resides on a commercial rooftop, you may consider keeping a very low tilt on the modules to help reduce structural loading on the facility
Knowing about the tilt of the earth’s axis (which is 23.5 degrees) relates to tilt angle. How? Refer to Figure 4-5 for a refresher on the solar radiation data sets. In particular, look at how the tilt angle of the modules is represented in terms of the number of degrees off the horizontal in relation to latitude. The tilt angles in relation to the site’s latitude are affected in the following ways:
- If you adjust the tilt of the array by latitude minus 15 degrees, the PV array is perpendicular to the sun just before and just after the summer solstice. Because the sun is higher in the sky at these times of year, reducing the tilt angle of the array makes the array perpendicular to the sun and maximizes the array’s energy output during the summer months.
- If the PV array is mounted with a tilt angle equal to the local latitude, it’s perpendicular to the sun twice a year (on each equinox date) and very close to perpendicular for the weeks before and after the equinox; this makes the array perpendicular to the sun’s position in the sky for the greatest number of hours throughout the year.
- If the desire is to have the array perpendicular to the sun in the winter, then a tilt angle of latitude plus 15 degrees is optimum. This helps the array maximize energy production during the winter months.
The idea behind varying the tilt angle is to maximize the PV array’s energy production by pointing the array perpendicular to the sun as much as possible. So if your client needs to maximize energy production in the summer months (perhaps because she’s running a water pump), you should mount the array so the tilt is equal to a value of latitude minus 15 degrees. On the opposite end, if the client wants more energy production in the winter, the array should have a tilt angle of latitude plus 15 degrees.
The exact tilt angle that maximizes the annual energy production varies based on the local climate. For most locations, the optimum tilt angle (assuming you don’t change it) is somewhere between an angle that’s equal to latitude to an angle of latitude minus 15 degrees.
The NREL data for peak sun hours that I present earlier in this chapter can help you define the optimum tilt angle (see the “Referring to handy charts and maps” section). Simply compare the annual average peak sun hours for each tilt angle and see where your client’s site is maximized.
The reason for the magical 15-degree value is the fact that the sun moves 23.5 degrees between the equinox date and the solstice date and then back again. By adjusting the tilt angle by 15 degrees rather than the full 23.5, you allow the array to be perpendicular to the sun for the days and weeks surrounding the time of year you’re optimizing for.
Note: If you read almost any older textbook on the subject of PV module mounting and how best to determine tilt angle, you’ll see a nearly universal answer: Tilt the PV array at an angle equal to the latitude for maximum annual energy production. Although this would be an absolutely correct statement if your client’s site were always free of cloud cover and other weather variations, such as a lot of fog in the fall and winter, it may not be an absolute truth for your client’s location. In Chapter 5, I show you how to use some commonly available tools to help you determine the tilt angle that’ll serve your client best.
Orienting your array to the azimuth
Another major component to consider when planning the array location to maximize energy output is the orientation with respect to true north, or the azimuth. The best way to refer to the azimuth of an array is to refer to the number of degrees the array is facing with reference to true north, exactly the same as you refer to the sun’s position.
With this notation, the array has an azimuth of 90 degrees if it faces true east, 180 degrees if it faces true south, and 270 degrees if it faces true west. Bear in mind that true east, true south, and true west don’t refer to compass directions; instead, they take magnetic declination into account. (Magnetic declination is the difference between true north and magnetic north; flip to Chapter 5 to discover how to account for magnetic declination.) For an example of what I mean, look at Figure 4-12. It shows a PV module that has an azimuth that’s east of south. You could also say that this module has an azimuth of approximately 165 degrees based on how far it is from true north.

FIGURE 4-12: A PV module with an azimuth of about 165 degrees.
Because irradiance directly affects the amount of current that a PV array produces (as I explain in the earlier “Relating current and voltage to irradiance” section), it stands to reason that you want a PV array perpendicular to the sun (in other words, directly facing it) as much as possible. So generally you must point the modules as close to true south as possible (for installations in the Northern Hemisphere) or to true north (for installations in the Southern Hemisphere), but local weather conditions may require you to adjust that reasoning.
In many scenarios, such as a PV array on an existing house, you as the installer don’t have the ability to change the azimuth of the PV array, at least not easily. If sufficient room is available, you may choose to place the array on a racking system that can track the sun (see the nearby “To track or not to track?” sidebar for more on this subject). But often racking the system in such a manner that the array’s azimuth is different than that of the house it’s attached to isn’t worth it. (I cover mechanical considerations in Chapter 16 and the overall effect of nonideal array azimuth conditions in Chapter 5.)