Chapter VII
Safety Instrumentation Functions and System (Including Fire and Gas System)
Abstract
Knowledge of safety instrumented systems (SISs) based on IEC 61508, discussed in the previous chapter, has been elaborated here for distinction among the terms SIS, safety instrument function (SIF), and safety integrity level (SIL), used interchangeably. Competency structure of SIS calls for a detailed discussion of reliability theory and relationship between the same and SIS. Bathtub curve and Weibull distributions are applied for SIS reliability calculations. There are various types of failure; random, systematic, and common cause failures in various instrumentation systems need special attention. Also, discussions on special requirements for sensors, logic solvers, and final elements are covered including short discussions on safe programmable logic controller. Redundancy and voting logic play an important role for naturally same needs to be treated. SIS is different for machinery system process plants and nuclear plants; accordingly these are treated separately. Fire and gas system (FGS) is an important issue in all plants so detailed discussions including special attention on philosophy document, detection technology, and area coverage have been included. Perspective and performance-based regulation for FGS needs special attention as opinion is divided. So, pros and cons of both have been discussed.
Keywords
Bath tub curve; Common cause failure (CCF); Failure modes, effects, and diagnostic analysis (FMEDA); Proof test; Reliability, availability, and maintainability (RAM); Risk graph; Safe PLC; Short-term exposure limit (STEL); Target risk; Threshold limit value (TLV); Time weighted average (TWA); Weibull distribution
1.0. Safety Instrumented Function, Safety Instrumented System, and Safety Integrity Level Discussions
It is interesting to note the heading of the chapter! It is named like this to indicate that safety instrumented functions (SIFs–in plural) constitute a safety instrumented system (SIS). From the discussions in previous chapters, readers have come across varieties of definitions of accidents, hazards, and risks from different perspectives. Also there were a few things common such as the accidents are not always negative, and there are always aim to avoid accidents so that there is not loss to the system, personnel, and environment. At the back of the mind, we always try to develop and incorporate some things to reduce risks and to maintain work safety. Therefore, safety work involves some activities, measures, and techniques, which can contribute or help to reductions in losses in different forms, and human injury or fatality. There are quite a good number of elements involved in work safety; these include, but are not limited to the following:
• Types of consequences to include:
• Personnel: Injury, fatality, mental effect, reduced health
• Environmental damage: Contamination, exposure
• Function: Total/partial loss, production loss, machinery loss, risky operation
• Economic loss: Direct, indirect loss of costly machine, property
• Others: Loss of reputation, goodwill, opportunity
• Responsibility: Mainly includes:
• Persons: Design, operation, services, victims, and others
• Community suffering impact
• Organization: Directly, policy, planning, etc.
• Governing bodies: Standardization bodies, regulators
• Interested bodies, for example, labor union, consumer forum
• Other units: Researching bodies, statistical bodies, etc.
• Arena: Staying and performing activities:
• Workplace
• Caretaking
• Education
• Sources of risk: Refer to Chapter I
• Action taken:
• Political
• Social
• Legal/legislature
• System analysis
• Risk management (main interest area)
• Others
1.0.1. Risk Reduction
At this point, the main interest is to go about to see how, with help of risk management, the safety work is ensured.
Fig. VII/1.0.1-1 shows various methods of risk reduction in a common figure to include all risk reduction methods. Here, SIS is of main concern to us, so it is shown separately (in dark box). SISs are one of the most commonly used, engineered safeguard systems offering good flexibility to the designers. On account of safety life cycle requirements of IEC 61508/61511, and for better SIS design, experts need to analyze the risk associated with process under control at the beginning. SISs are risk-based systems. When in the subject, it is better to address the first barrier, then to SIFs. Barrier functions are planned for prevention, regulation, and mitigation of undesired events. In safety barriers, such barrier functions are used to combat undesired events. A safety function could be a technical or organizational function, human action, or a combination of them, used to reduce risks. Therefore, safety functions are a type of barrier.
1.0.2. Safety Barriers for Risks
These barriers could be conceived simply for a fire situation:
Several safety barriers for fire include:
• Smoke detection system
• Heat/thermal detection system

• Manual call/alarm
• Smoke control—air handling
• Fire door/fire wall
• Sprinkler system
• Evacuation/emergency plan
Out of these, the first four are detection and alerting safety barriers, whereas last four are protection type safety barriers. So, from here it could be argued that these safety barriers can be classified into various forms such as:
• Active/passive barrier
• Proactive/reactive
• High-demand/low-demand
• Technical, human, or organizational action
All of these can also be seen from the examples of fire (e.g., detection parts are proactive whereas protection parts are reactive). In fact, the safety barriers can be categorized according to their influence of safety. Safety barriers need to be evaluated before selection. These safety barriers actually are provided by layers of protection. From the discussions on layers of protection analysis (LOPA), it is known that safety barriers or independent protection layer (IPL) can be credited with risk reduction if they are:
• Effective in preventing the consequence
• Independent of the initiating event
• Independent of other credited independent protection layers (IPLs) for a given scenario
• Auditable
1.0.3. Safety Instrumented System Discussions
SIS is one of such safety barriers, which may be applied in combination with other technology or external risk reduction. The discussions so far were generalized in nature. Now it is time to shift the focus towards the standards which deal with electrical/electronic/programmable electronics (E/E/PEs). In both the standards IEC 61508 and 61511, safety functions or functional safety related to E/E/PEs are not always seen in isolation but in conjunction with other technology and external risk reductions. According to Clause 3.2.68 of IEC 61511-1:2003, safety function is defined as, “function to be implemented by an SIS, other technology safety related system or external risk, reduction facilities, which is intended to achieve or maintain a safe state for the process, with respect to a specific hazardous event.” The reader might have noted from the discussions on IEC 61511 in Chapter VI that in the standard SIS and SIF have been used interchangeably. One more definition from IEC 61511-1:2003 is also of interest for coming to the discussions on SIF. According to IEC 61511-1:2003, Clause 3.2.71, “safety instrumented function (SIF): safety function with a specified safety integrity level which is necessary to achieve functional safety and which can be either a safety instrumented protection function or a safety instrumented control function.” So, there are basically two types of SIFs, viz. the first one is: safety instrumented protection function, – operating in the demand mode, and other one is: safety instrumented control function (see Fig. VII/1.0.3-1), – operating in the continuous mode.

From the preceding discussions, it transpires that there are two kinds of safety functions; on-demand and continuous controls. Let’s the examine a boiler/furnace fire rate that is controlled as per demand continuously to make sure that the furnace environment is always air-enriched, and the air–fuel ratio is maintained. This is safety instrumented control function, and could be a part of basic plant control system (BPCS) also. On the other, hand flame out (total) in a boiler or furnace could cause release of toxic and inflammable gas like CO. This is specific hazard, and there is demand on safety instrumented function (part of a system) through which the automatic protective interlock will trip or close the main fuel valve to stop any inflow of fuel to the furnace, and brings the system to a safe state. This action will initiate master fuel relay (MFR) trip. Another important issue here is that corresponding to each hazard, there shall be one specific SIF, for example, closure of main fuel in the event of loss of flame is one SIF; now, if there is very low feed water flow, or very low drum water level, then through automatic protection interlock, MFR will be tripped. From here, one can conclude that SIS consists of a number of SIFs which are included for each set of hazards. So far as MFR is concerned, all separate SIFs have the same result (tripping of MFR), which in turn operates different actuators to bring the system to safe state. By definition, each SIF needs to have one SIL and depends on amount of risk reduction by the SIF for the particular hazard. The SIL is selected based on the risk posed by the hazard. From previous chapters, it is well known that risk is constituted by the consequence and frequency of occurrence of the hazard. Therefore there will be different SIL for different SIFs. Obviously highest SIL will result safer SIS! Now there could be some situations when an SIF may have multiple initiating cause scenarios. In such cases, the highest SIL corresponding to scenarios will be used. Refer to Fig. VII/1.0.3-2 for details about the interrelation amongst them.
In Fig. VII/1.0.3-2, instead of safe state, safer state has been indicated to mean that by SIF or SIL, etc., one may reach to an acceptable hazard state. Now it is time to look a little deeper into all of these terms and their interrelations in the subsequent clauses with special reference to applicable international standards IEC 61508/IEC 61511 (ISA 84 included).

1.1. Safety Instrumented Function and Safety Instrumented System Functional Aspects – Discussions
When first published, many automation professionals felt confused as to what the terms SIF and SIS really meant. Definitions as per IEC have already been elaborated in previous clauses. However, even the standard uses the term SIS and SIF somewhat interchangeably in places. Therefore it will be prudent to look into these terms a little in detail.
1.1.1. Various Terms with Application Notes
• Safety functions: Safety functions are derived from the hazard analysis and provide actions taken by the safety system specific for each hazardous event. Safety functions are implemented through the combination of SIS or SIF, other technology, and external reduction facilities. Another similar term, “functional safety,” when associated with SIF, relates to E/E/PEs and is to describe the safety system dependent on the correct functioning of constituent elements of SIF, viz. the logic solver, sensors, and final elements to attain the desired risk reduction level. Successful execution of SIF discussed later will result achievement of functional safety.
• Safety instrumented function: SIF stands for safety instrumented function. A set of control equipment intended to reduce the risk due to a specific hazard. SIF is designed to control, prevent, or mitigate a specific hazard and takes the process to a tolerable risk level. SIF is composed of a combination of sensors, logic solvers, and final elements with an assigned SIL level depending on the amount of risk that needs to be reduced. A number of SIFs constitutes SIS as shown in Fig. VII/1.0.3-2. Some issues related to SIF shall mainly cover the following:
• SIF automatically takes the process to a safer or acceptable risk state in case of violation of specific condition(s).
• Permit process to proceed in a safe manner under permissive conditions.
• Action(s) to prevent/mitigate the consequences related to industrial hazard.
• Ability to detect, decide, and act as dictated by SIL of the function.
• Safety integrity level (SIL): As per IEC 61511, each SIF shall have an associated SIL, which is a measure of safety system performance and is related to probability of failure on demand (PFD) for the associated SIF. There are four defined SILs: SIL -1, 2, 3, 4. The higher the SIL number, the lower the PFD for the safety system, indicating a better system performance. Also, it has been found that higher the SIL number, the higher the cost and complexity of the system will be. SIL is applicable and calculated for to entire SIF system, but not on individual products or components. As told earlier, each SIF is assigned an SIL. Reliability and availability of SIF due to SIL are achieved by design, design installation, and testing. SIL is also dependent on architectural constraints–detailed out in Chapter VIII. The following [2] points on SIL are worth noting:
• SIL 0/none: lowest risk
• SIL 1: 95% of the SIFs
• SIL 2: 5% of SIFs
• SIL 3: <1% (off-shore platforms/nuclear)
• SIL 4: highest risk (nuclear industry)
• Safety instrumented system (SIS): SIS is meant to prevent, control, or mitigate hazardous events and take the process to a safe state when predetermined conditions are violated. An SIS can be one or more SIFs, which is composed of a combination of sensors, logic solvers, and final elements. Other common terms for SISs are safety interlock systems, emergency shutdown (ESD) systems, and safety shutdown systems (SSDs). So, SIS is used as a protection layer between the hazards of the process and the public. SIS or SIF is extremely important when there is no other non-instrumented way of adequately eliminating or mitigating process risks. As per recommendations of standards IEC 61511:2003 (or ANSI/ISA-84.00.01-2004), a multi-disciplinary team approach following the safety life cycle, conducts hazard analysis, develops layers of protections, and implements an SIS when hazardous events cannot be controlled, prevented, or mitigated adequately by non-instrumented means.
• Proof testing interval: To achieve an SIL during the design phase calls for many design assumptions to predict the SIF performance. Operating conditions will affect these assumptions and hence SIF/SIS integrity level. SIS-specific monitoring and proof tests must be conducted as per managed procedures (see HSE.UK for guidelines) that ensure the tests are done correctly, consistently, and safely to verify all design assumptions at regular intervals referred to as proof test interval. Periodic proof testing of the entire system, including sensors, logic solvers, and final elements, is necessary to ensure the continued and demonstrable integrity of each SIF. The testing frequency is variable for each SIS depending on the technology, system architecture, and target SIL. The proof-test interval is an important component of the PFD calculation for the system. Failed devices must be properly bypassed, repaired, and then returned to a fully operational state and proof testing. It is more likely that higher the SIL, the more frequent will be proof testing.
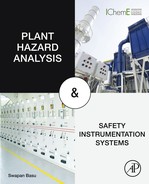
• Competency structure for functional safety: During the discussions on IEC standards, it was seen that there should be a responsible authority to implement the safety principles. For organizations, a company safety authority (CSA) is charged with this responsibility. Core principles endorsed by senior management are collectively referred to as “strategic competency principles,” which are based on a multi-tiered approach to demonstrating functional safety capability. A typical competency pyramid is shown in Fig. VI/1.1-1. There are four strategic competency principles:
• Benchmark current practice: Assessment against IEC 61508 and IEC 61511 to establish the scope of the task.
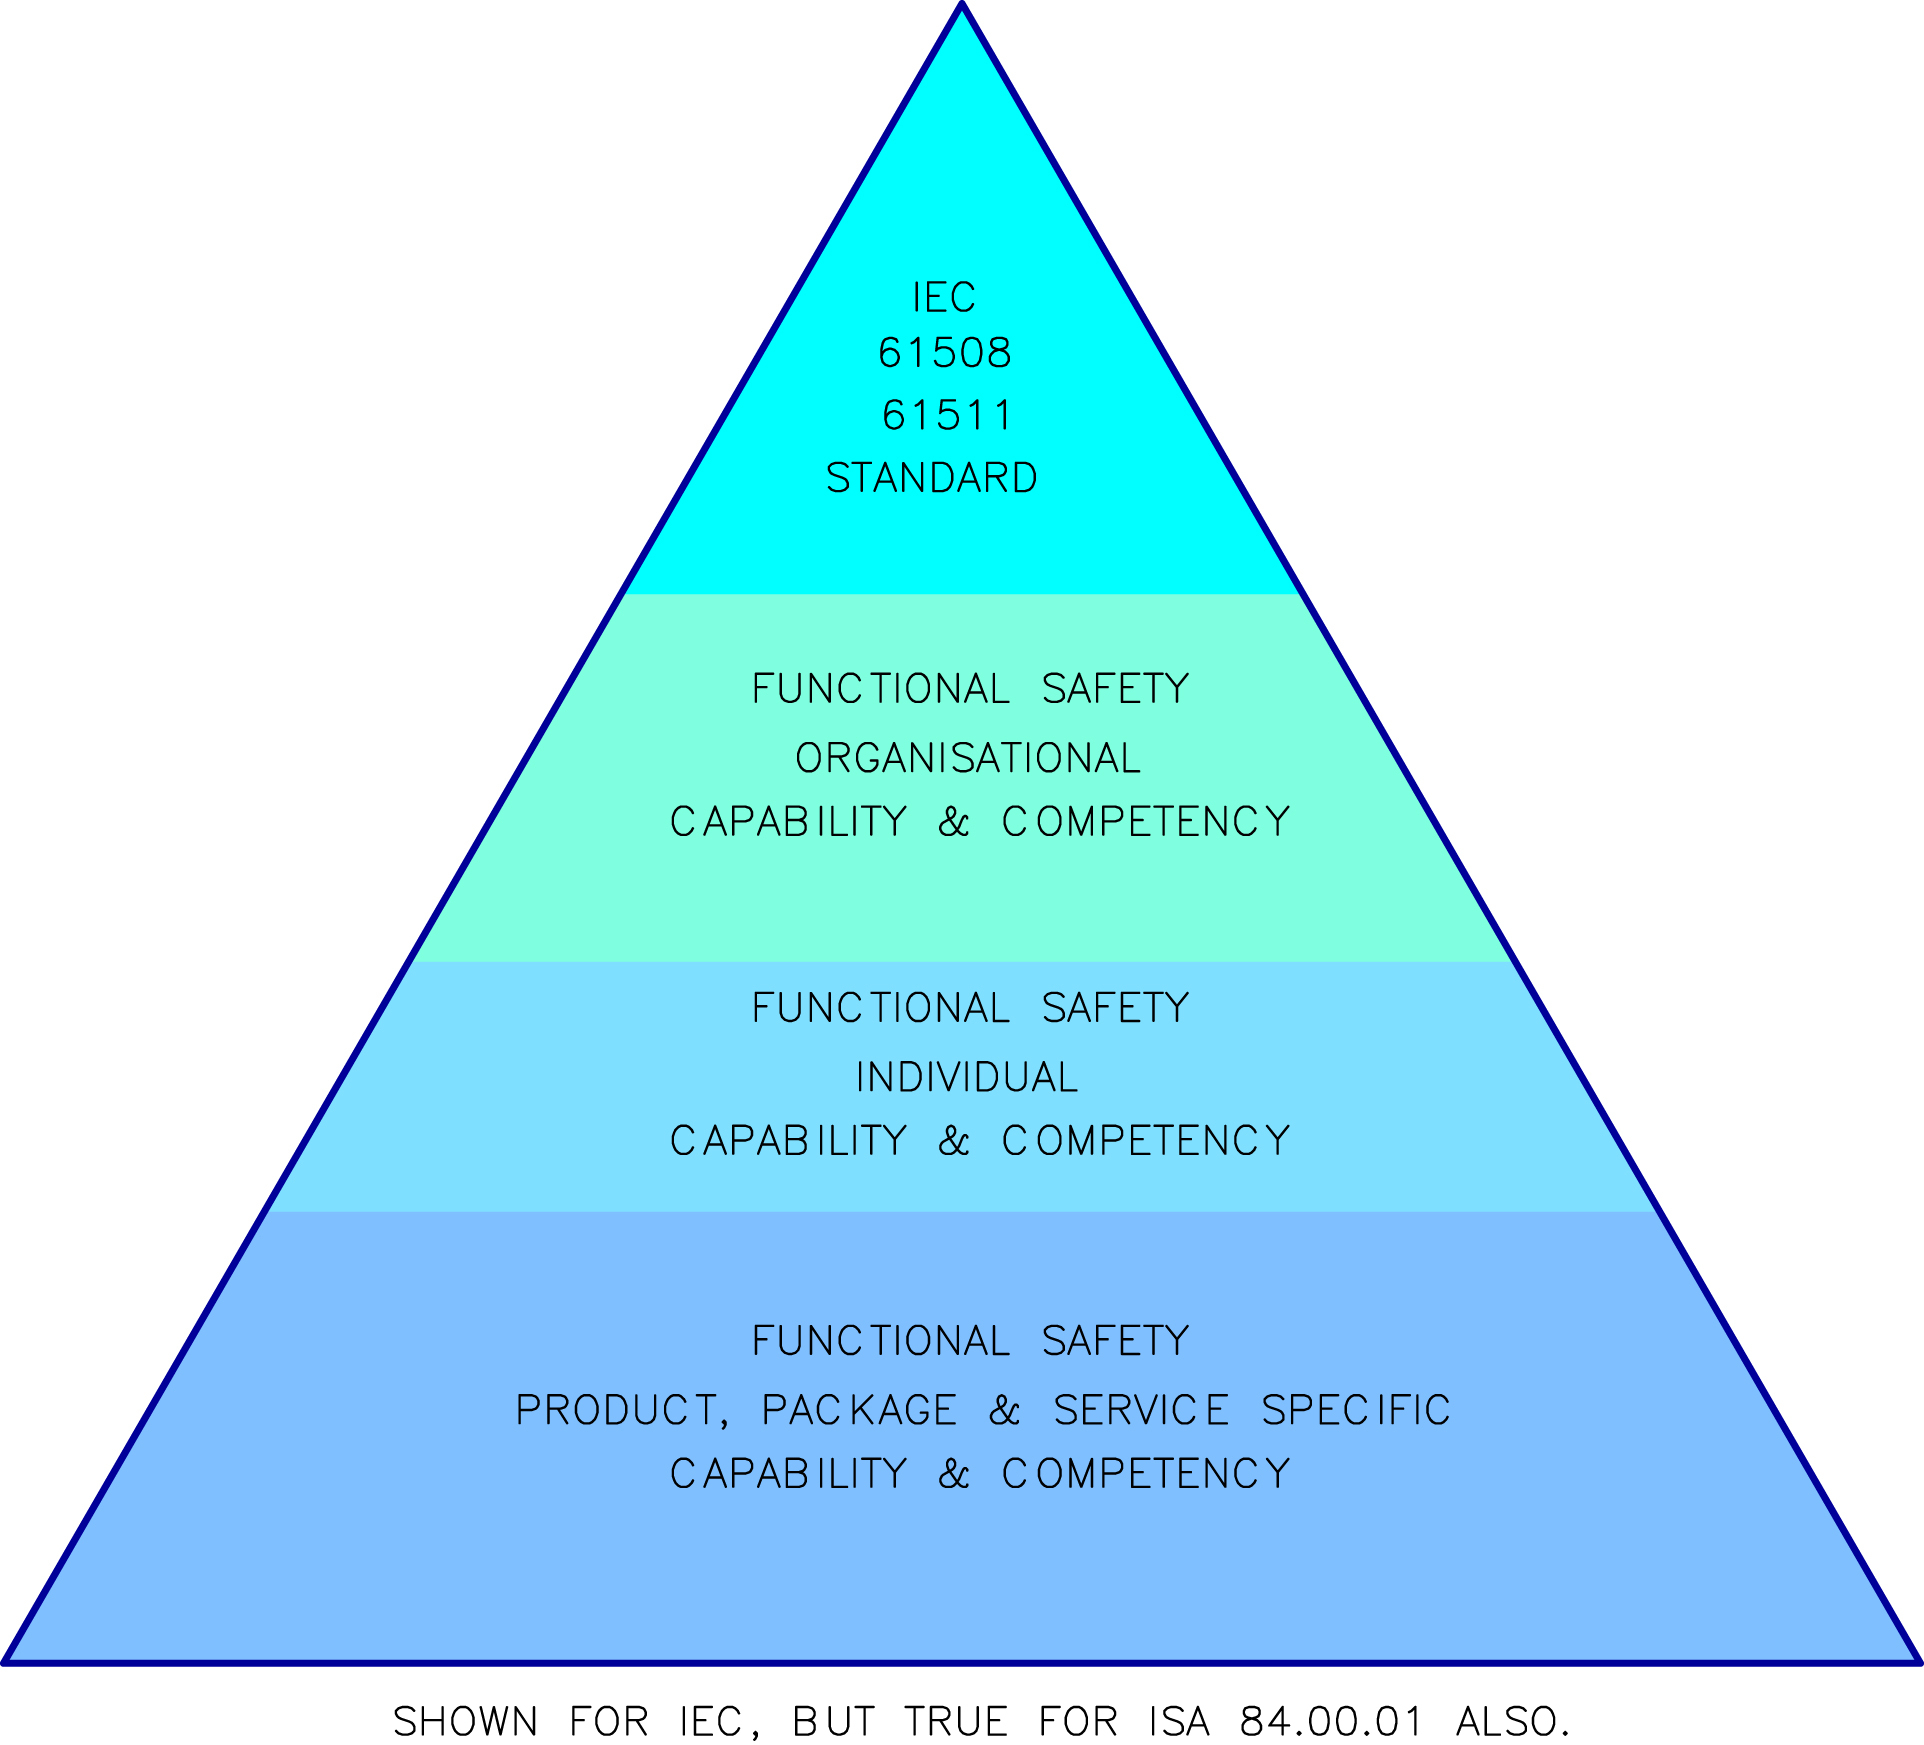
Figure VII/1.1.1-1 Competency structure for functional safety. Figure has been developed inspired by ABB doc (Functional Safety Handbook, ABB Limited, 2008). Courtesy ABB.
• Establish individual competency: Safety engineers of the organization to get certified functional safety engineer status through competent authority following their safety program.
• Manage third party integrators (if any)
The key points/issues of these strategic competency principles [3] are:
• To use certified products
• To employ competent (certified) persons
• To implement safety systems through the certified organization
These are stated here to understand by the manufacturers and system integrators how to get the accredited certificates.
1.1.2. Basic Principle Discussions
The SIS is a part of instrumentation and control system which when detects that the process is out of control and there could be possibilities of hazards, it automatically returns the process to a safe state. It could be the last line - or near last line - of defense against a process hazard. Normally it is better to keep it out of BPCS and treat separately. However, there could be cases where these may be integrated with BPCS also (let the discussions start with separate SIS). The last line or near last line of defense is what differentiates an SIS from the BPCS, which is used for normal regulatory process control. Fig. VII/1.1.2-1 shows the relationship between BPCS and SIS with respect to the process.
From the preceding example, it is clear that each of the BPCS and SIS will consist of sensors, logic solvers, and final elements. Both need to work independently. Usually BPCS regulates the process to keep the parameter of interest to the desired set point. If for some reason, the system is going out of control range, then SIS will act upon to bring the process back to the safe state. Here, one thing to be kept in mind that safe state could be an ALARP (as low as reasonably practicable), that is, in safe operating state, or in some cases, system shutdown. So, safe state is defined in that sense. This is explained with the help of an example in Fig. VII/1.1.2-2.
In the preceding example, flammable fluid is taken out of 10 m high tank, which is being fed by a line having one control valve to regulate and maintain the level in the tank, say, at 5 m. In case of high levels, there is an alarm at the 6 m level. Now there is the possibility of explosion if the tank is full. So, there is pressure safety valve AND also there is a separate level loop with set point at a point higher level than alarm set point – say at 7 m – to close the shut off valve in supply line. This is a classical example of LOPA with different IPLs, which are used to push the systems from process risk to tolerable risks, as typically shown in Fig. V/4.0-3 and Fig. VII/1.0-1. Here as shown, there are two different controls one is a modulating controls under BPCS to regulate the flow control valve (2nd in the inflow line, i.e., RHS valve). On the other hand, SIS will shutdown the inflow by closing the shut off valve (1st in the inflow line, i.e., valve in LHS). SIS will naturally come into operation after the level is above BPCS set point as well as the alarm set point. So, here SIS will act as next-to-last defense, which is the operation of plant shutdown valve (PSV). Here, IPLs are BPCS, alarm, SIS, and PSV. Independent level control shutdown function is implemented in an SIS. Here it is worth noting that the components, which include the sensor components, the logic solvers, as well as the final control elements, used in the BPCS and the SIS are separate, physically and functionally – hence independent. SISs are generally independent (both physically and functionally) from the BPCS to ensure that any condition, which might result in an out-of-control process parameter in the BPCS, is safeguarded by the SIS, regardless of the functioning of the BPCS, that is, even if BPCS fails SIS can provide a safeguard. Another issue is that SIS is acting on demand. In the given example even if operator misses alarm there is safeguard against hazard. SIS is not necessarily programmable only; it could be non-programmable also.


1.1.3. Scope, Boundary and Safety Requirement Specification
In various plant analyses, it has been seen that prior to start of the same, it is necessary to clearly define the scope and boundary for the study. Similarly, the gap between the organization's functional management system and the requirements as per the standard needs to be assessed. Only after the gap assessment, proper implementation of standard is possible. In this connection, Clause 6 of IEC 61508-1:2010 and Clause 5 of IEC 61511-1:2003 may be referenced. It is clearly stated that the two basic objectives are to specify the responsibilities and activities. Clause 6.2.17 of IEC 61508-1:2010 calls for quality management also. So, some of the pre-requisition towards such quality checks shall include, but is not limited to, the following:
• Hazard analysis and risk assessment previously done to ensure systematic development of requirements of specifications which is a key deliverable.
• The hardware for SIS (sensors and final elements also applicable) consisting of logic solver, I/O termination cabinet, power supplies, and communication module.
• The subsystem used including logic solver and accessories, needs to be third-party certified as per standard.
• Safety integrity data (PFD-hardware fault tolerance), reliability data for all devices with clear definition of the same for logic solver in the manual.
• Overall hardware architecture as per specification and software is limited variability language type (Ref: Chapter VI) with suitable library as certified functional blocks which are protected against unauthorized modification.
• Coding standard: as per IEC 61131-3 standard.
• Development tool support and facility for development application software with functional blocks.
• Development environment to facilitate creation of version and management facilities.
• Facility to integrate such as downloading and data configuration as per requirements.
SIS safety requirements necessary at early bid proposal stage, are well-defined in Clause 10.3 of 61511 part 1. These requirements offer significant benefits to both the parties (e.g., party with responsibility to develop SRS as well as the party for integration process) needing SRS. Salient requirements from 10.3.1 of 61511 part 1 are listed as follows:
• Description of SIF
• Addressing common cause issues
• Safe state for each SIF
• Source of demand with demand rate for each SIF
• Proof test interval
• Response time requirements
• SIL with mode of operation
• SIS measurement and trip point and output action
• Functional relation between process I/O and logic solver
• Manual shutdown requirements
• Energize/de-energize to trip requirements
• Resetting after SIS shutdown
• Allowable spurious trip
• Failure mode and desired SIS response
• Interface between SIS and other systems
IEC 61508 does not make a direct correlation [3] with the required level of rigor and competence. However, it has been found that more rigorous competences are necessary in the event of any one.
• Greater consequence
• Higher SIL
• Novelty of design procedure/new design
Therefore, it is better to go for specification of competence level for a well-organized company. “Knowledge,” “experience,” “training,” and “qualification” are major attributes for competence level to be considered. The reader may refer Clause 8.2.9, Table 4, and 5 of Clause 8.2.18 IEC 61508-1:2010 for further details in this regard. From the discussions so far, it has been found that various types of failure play a great role in assessing SIF or SIS. So, better to address various kinds of failures and how to address them!
1.2. Failure and Failure Classes
One of the major reasons for the need to develop standards IEC 61508/IEC 61511 (ANSI/ISA 84.00.01-2004) was to devise some means to minimize the propagation of device failure through design, operating, inspection, and maintenance practices into system. Naturally this calls for reader to understand various types of failures systems normally need to face with special reference to E/E/PEs.
1.2.1. Introductory Discussions
All plant/process controls have a range within which the control systems would operate. However, there may be situations or emergencies when systems cross such ranges (e.g., when there is a catastrophe in a grid, it is almost impossible to keep the governor control of any connected sets within given range–one similarity) then, hazardous conditions may occur. Obviously in such situations, there may be failure in one part and there will be high possibility that this propagates and may give rise to a hazardous situation. Therefore it is needless to say that SIS must address all such situations right from the beginning, so that there will lesser consequences to human life, environment, and assets. From IEC 61508/61511 discussions, it is clear that after identification of SIF, the risk reduction allocation is related to its SIL so that these two factors can establish a benchmark for system design, production or operation, and other management functions to be used throughout the SIF life cycle. In industrial application basically there are two major types of failure, viz. random failure and systematic failure. The said benchmark defines the (1) minimum performance against random failures, and (2) the rigor of the protective management to reduce the potential for systematic errors. A few common causes for random and systematic failures are listed as follows, and for further details ISA may be referenced [10]:
• Systematic fault
• SIF deign error
• Hardware error in design or implementation
• Software error
• Error in management of change (MOC)
• Installation error
• Human interaction error
There is another kind of failure, popularly known as common cause failure (CCF), which could be either random or systematic, and is responsible for failure of multiple devices, systems, etc. People often use redundant transmitters (say two of three) for SIF protection purposes. As long two of three transmitters are working, then it is okay and the system can work to take care of SIF; but if two transmitters fail then the situation is different and bad. Such kinds of failures are often found when the device specifications are violated, in multiple devices simultaneous failures can occur (and redundant instruments may fail). This is known as a CCF. In this competitive market, plant designers are very keen in designing the system optimizing system design, which calls for simplification and cost-effectiveness. Such optimizations often make the systems with lesser safety margin. “As less and less safety margin is built into the design, greater importance is placed on the precision of the predictive failure calculation” [4]. So, device failure is no longer restricted to benchmark for performance, but is a critical parameter for process design.
Characteristics of each SIF device, the interactions among its components, and the properties of the system itself are responsible for SIF performance. The following issues are responsible for performance and failure probability of SIF:
• Random failure rate of devices
• Design parameter
• Systematic failure
• Common cause failure (Random failure of multiple devices)
Independent failures of devices are analyzed to identify roots, and it is possible to reduce reoccurrence of failure. Random failures are physical failure while mostly systematic failures (design failure) occur due to human error, mainly hence a local issue. CCFs are application and/or installation specific. In IEC 61511, adapts different strategies to handle various failure types to make SIF devices are useful in the life cycle as long as these are installed and managed as per design basis and operating procedure. Now, the focus shall be on failure characteristics to conceive how these affect SIF performances.
1.2.2. Bathtub Curve Discussions
The lifetime of an entire population of products often is graphically represented by a set of curves collectively called the bathtub curve. Bathtub curve has been depicted in Fig. VII/1.2.2-1. The bathtub curve consists of three periods. First is an infant mortality or burnt-in period with a decreasing failure rate showing early-life failure. These early life failures are known as burnt-in or infant mortality failures occur on account of defects such as design defect, material defect, or error in assembly/manufacturing flaws in the components. These could be detected during burn-in and function testing prior to release from production. Device handling during shipment, unpacking, storage, transportation to work site, and installation may be responsible for infant mortality failure. The second part is a relatively constant failure rate referred to as normal life period or “useful life.” Normal or useful life failures mainly occur on account of random events with an increase of the stress on the device beyond its physical limits. Here it is worth noting that in many cases there are failures during normal life due to infant mortality failures. This is a generalized curve, not calibrated for any particular product life, with the relative failure rate of population of products over time.

Individual units may have different failure rates; some may fail during early stage while some may survive until normal life or even during wear out stage. Failure categories of different individual units have been shown in Fig. VII/1.2.2-2 (to show variations).
The third part is the wear-out period that exhibits an increasing failure rate. During the wear-out failure stage, the failure rate is positive, meaning that it is dominant over the useful life failure rate, showing the ending normal life of the device. Wear-out may be due to fatigue or depletion of materials (such as lubrication depletion in bearings) in mechanical devices. Electromechanical devices may have a gradual increase in failure rate, and depends on how well their mechanical components are inspected and maintained. In cases of electronic/programmable devices, these rate of changes may be very sharp due to the large number of aging components. A product's useful life is limited by its shortest-lived component. It is the manufacturer's responsibility to ensure proper functioning of the device under specified conditions, through the intended product life. The infant mortality period is crucial to the manufacturer/marketing company, on account of customer dissatisfaction (number of failures in short time), and warranty expense. In view of these and constant failure rate in normal life, it is desirable that the bottom of the bathtub to be as low as possible. Major issues related to the bathtub curve have been listed as follows:

• Infant mortality
• Defects elimination
• Appropriate and adequate specifications
• Sufficient design tolerance
• Sufficient component de-rating
• Early stress testing – design evaluation
Some typical testing methods are, for example: highly accelerated life test (HALT), highly accelerated stress test (HAST), and highly accelerated stress audit (HASA) adapted in different industries. In electronic industries; high temperature test and temperature cycling tests are very common for checking acceleration. Also, electronic items are tested for higher than operating voltage to find the accelerating factors.
• Wear-out:
• Electronic items wear out after a reasonable period of operation.
• In mechanical assembly, it is often seen that a particular component fails much sooner than expected life, but when replaced assembly can a last longer period.
A Weibull distribution can be used to assess actual situations so, in the following clause a brief discussion on the same has been presented.
1.2.3. Weibull Distribution
One of the most popular statistical methods is Weibull distribution for failure analysis. It is very useful for failure analysis. Waloddi Weibull invented the Weibull distribution in 1937 and claimed that his distribution applied to a wide range of problems. Salient issues on the same are as follows:
• Outline: Life of product population is predicted with the help of “Weibull” analysis in which a statistical distribution is attempted to fit into life data from a representative sample of units. Then same data set can be used for estimation of important life parameters/characteristics such as reliability or probability of failure at a specific time, the mean life, and the failure rate. For Weibull data analysis, the following information are required:
• Product life data.
• Selection of fitting a distribution pattern based on applicable parameters.
• Estimate of the parameters for fitting the distribution to the data.
• Results and plots generation for estimation of product life characteristics.
• Weibull analysis scope and data types handling include but are not limited to the following:
• Plotting the data
• Interpreting the plot
• Failure forecasting
• Spare parts forecasting
• Corrective action planning
• Maintenance planning
• Replacement strategies
• Warranty analysis
• Controlling production processes
• Supports CADCAM
• Censored or suspended data
• Mixtures of failure modes
• Extremely small samples (as small as one failure)
• Early data missing
• Failure types of Weibull analysis include but are not limited to the following areas:
• Development activity
• Production/service
• Mechanical/electronic devices
• Materials and human failures
• Lightning strikes
• Human error
• Quality control
• Design deficiencies
• Defective material
• Warranty claims
• Weibull distribution discussions: The Weibull model can be single, double, triple, and/or mixed type. Various types of mathematical modeling can be used. The typical, basic formula has been presented as follows:
 (VII/1.2.3-1)
Where f(t) stands for probability density function, f(t) >0. From this it is clear that it is a case of three-parameter model. Shape and locations can be varied in accordance with selection of range of parameter for various variables viz. η (>0), defines the bulk of the distribution parameter (scale), β (>0), determines shape (also often called Weibull slope) and γ, defines the location of the distribution in time and has wide variation.
A Weibull distribution is a generalized distribution, as each type of product population provides different types of information about the life of the product, and different life data analysis method may vary. It is quite normal that life will be in unit of time but it may not be the case always, for example, life of lubrication in automobile is dictated by kilometers running of the vehicle and not in time units. Time is a common measure of life, so often referred to as “times-to-failure.” There could be different (e.g., three) types of life data, each type provides different information about the life of the product; “with ‘complete data,’ the exact time-to-failure for the unit is known (e.g., the unit failed at 100 h of operation). With ‘suspended’ or ‘right censored’ data, the unit operated successfully for a known period of time and then continued (or could have continued) to operate for an additional unknown period of time (e.g., the unit was still operating at 100 h of operation).With ‘interval’ and ‘left censored’ data, the exact time-to-failure is unknown but it falls within a known time range [5]”. Based on statistical methods, characteristic parameters are calculated to fit a life distribution to a particular data set. For further details on this generalized statistical distribution, a standard book on statistics may be referred to. After the same is done one can use to get the following results:
• Mean life
• Failure rate
• Reliable life (reliability parameter)
• Reliability given time
• Probability plot
• Failure rate versus time
• PFD plot
• The following are major advantages of Weibull distribution:
• It can provide reasonably accurate failure analysis and failure forecasts with extremely small samples.
• It provides a simple and useful graphical plot of the failure data.
• Weibull analysis may be useful even with inadequacies in the data.
• Identification of mixtures of failures modes.
• Investigation of alternate aging parameters,
• Construction of a Weibull curve when no failures have occurred.
1.2.4. Failure Types and Random Failure
As stated earlier, there are two types of failure; random failure and systematic failure. There is another kind of failure called common cause failure. Common cause failure may be random or systematic failure. However, in ISA -TR84.00.02-2002 - part 1, this has been categorized under physical failure. However, in the note CCF of systematic failure has been mentioned. In this sub-clause, discussions shall be restricted to random failure only. The other two types will be separately in the subsequent sub-clauses. Random failures are physical failures. Random failure is characterized by unpredictable failure of device or component such as electronic card failure. As per ISA-TR84.00.02-2002 - part 1, “a failure is classified as physical when some physical stress (or combination of stressors) exceeds the capability of the installed components.” Random failures normally exhibits following characteristic features:
• Physical stress due to:
• Unusual/abnormal process conditions
• Corrosion or material deterioration
• Adverse environmental conditions
• Occurrence any time during life
• May not be detectable during accepting stage
• No particular pattern for occurrence
More and more information needs to be collected to identify the trend which can be used to minimize random and systematic failures. Random failures can be detected by diagnostics internal to the devices, externally-configured diagnostics, and proof tests. Usually PEs includes a number of such diagnostic features to combat random failures. Device redundancy is most common form to back each other up if a failure in one device occurs (provided there is no CCF discussed later). Redundancy often is used with voting schemes and diagnostics to help verify which between two or among several devices is operating correctly in the event of a fault. Redundancy and fault tolerant subsystems are used to reduce failure in devices to affect SIF. Diagnostics help in identifying the presence of current or imminent faults communicates the information to O&M personnel to avoid deterioration of SIS performance. Diagnostic programs are often run in a given interval, which is determined as per manufacturer's recommendations, good engineering practice, and system needs. It has been found that observed random failure rate often higher than actual random failure on account of interference from other systematic failures also.
1.2.5. Systematic Failure
Systematic faults occur due a combination of conditions resulting in a reproducible failure of the system, and are most often attributable to software issues in programmable safety systems. This failure may be a result of some error in design, operation or production process, installation and/or maintenance. Improper implementation of MOC at any stage could be responsible for systematic failure also. Device manufacturing errors can be addressed by diversity; this increases the SIF complexity. Diversity can be applied to sensor, I/O technologies, control and software platforms, and even product development teams. Incorrect specification, implementation, production or operational process, or installation and/or maintenance errors, which could be the cause of systematic failure, cannot be addressed by diversity discussed above. When complexities increase in SIS, probabilities of occurrence of such failure are more. Also, as the complexity increases, chances of error detection decreases. Therefore systematic failures bear some direct relationship with SIF complexity. In case of new technology, obviously there will be possibilities for many unknown failures, such as interconnectivity, communication software compatibility, etc. So, it is needless to tell that the chances of systematic failure will be high. Systematic failures include many types of errors, such as:
• Specification: Inadequate or incorrect design basis or inaccurate software specification.
• Manufacturing: Defects, hardware or software errors contributed during manufacturing or system operation.
• Implementation: Incorrect installation, programming error, interface issues, and/or not following standard.
• O&M: Inspection/testing flaws.
The preceding cases, there are some errors in any stage and are detectable. However, it may so happen due to complex combined operation that it is sometimes difficult to follow the failure pattern by testing. Hence, it is unpredictable, and systematic failure will again occur when matching conditions are forthcoming. In such cases these become intrinsic to the device hence associated SIF and hence associated SIS.
1.2.6. Common Cause Failure
This needs special attention in the case of E/E/PEs and for associated SIS. According to IEC 61511, CCF is defined as, “a failure which is the result of one or more events, causing failures of two or more separate channels in a multiple channel system, leading to a system failure.” Also, as per IEC 61511(1), life cycle recommendations for the devices, systems, or protection layers need to be assessed for independence and the potential for CCF. So, understanding of independence and common cause are very important as at times they are interrelated. Any lack of independence will result potential for a CCF. Similarly, when a common cause is identified, it means there is lack of independence. CCFs mainly occur due to external influences, and could cause more than one system component or layer of protection to fail. So, CCFs could develop serious threats to reliability of SIS, and could be responsible for simultaneous failures of redundant components and safety barriers. Common cause failure is represented by β (β = λc/λ; where λc stands for CCF failure and λ stands for total failure meaning β is factor for CCF. Often, β factor model is used to determine CCF. On account of CCFs, SIS may fail to perform functional duties demanded by a process. All CCFs have the potential to reduce the SIF–SIS performance; but they are treated in different ways, and also strategies for coping up with the situation may be different depending on the nature of the failure (e.g., systematic or random). Diversity is most often cited as a means to counter common cause and systematic failures. Here it is interesting to note from an example; in any application, two pressure transmitters are used in redundant mode each with different technology, say, one is working in capacitance principle and the other is working in piezoelectric principles, but both failed, that is, loss of signals due to diaphragm failure. Here there is diversity in transmitters- but they fail due to common mode failure which is a sub set of CCF, and in this case there may be error in design or selection of proper transmitter pressure range selections (in this case diaphragm failed, even two technologies could not save as the pressure range selection was wrong!). From here, it is clear that CCFs must be identified during the design process and the potential impact on the SIS functionality must be understood. Functional testing and inspection are also important activities, especially when operating in low-demand mode for revealing SIS failure. These functional testing and inspections greatly affect CCFs, as CCFs can be identified and corrected by efficient testing and inspection. Inadequate procedures and human errors could result simultaneous failure of components in SIF/SIS. In IEC 61508/61511standards, one does not find any mention of the critical time aspect in their definition of CCF, but in nuclear power plant critical time between two consecutive inspections have been included and is important for CCF. There are two types of CCF to be addressed:
• Single points of failure; one malfunctioning device causes an SIF failure.
• Single events leading multiple failures in a redundant subsystem.
From experience it could be argued that CCF may be introduced in:
• Design stage:
• Improper understanding of failure mechanism and response
• Improper selection of hardware
• O&M stage due to:
• Human error
• Inadequate testing
• Environmental effect beyond design basis
CCFs have variations among the industries and there lot of disagreement among the experts regarding the actual definition and causes of CCFs. Some of the issues towards these related to instrumentation shall include but are not limited to the following:
• Incorrect calibration of sensor
• Stoppage of common point in process taps
• Improper selection
• Improper maintenance
• Environmental stress
• Serious process condition variations
Major factors attributable to CCFs shall include:
• Affected components are unable to perform as required
• Multiple failures within redundant configuration
• First in line failure
• Failure to occur within critical time interval
• Failure due to single underlining defect/phenomenon
• The effect of failure to leads to major disability to perform as required
There are mainly two major factors behind CCFs, and these are actual root cause and coupling issues. From international common cause failure data exchange (ICDE) classification of common causes (Nuclear Energy Agency–NEA, 2004/2011), one gets that the following are classes of root cause [6]:
• State of other components
• Inadequacy in design, manufacture, or construction
• Human actions
• Maintenance
• Internal to component
• Procedure inadequacy
• Abnormal environmental stress
• Others
Similarly, the classes of coupling factors shall include [6]:
• Same or similar hardware
• Hardware design
• System design
• Hardware quality deficiency
• Same or similar operational conditions
• Testing and maintenance schedule
• Testing and maintenance procedure
• Testing and maintenance staff
• Operation procedure
• Operational staff
• Same or similar environmental conditions:
• Internal
• External
• Others
Based on the root cause and classification of coupling, there are three separate sets of checklists for CCF avoidance, viz. preparation, execution, and restoration. There are cause-defense matrices available, which shall include CCF, root cause, coupling factor, defense alternatives impact, and cost, etc. For further details [1,6,7] may be referenced. With this discussion on failure types concluded, we move on to look at reliability issues.
1.3. Reliability Theory and Safety Instrumented System Issues (Including Reliability Block Diagram, Risk Graph)
Functionally, reliability engineering is responsible for the development of reliability requirements for the system and design of the system or product to meet the reliability requirements. Reliability engineering also establishes reliability program, and carry out analysis to monitor the actual reliability of the system or product throughout life cycle of the same. Reliability engineering is closely related to safety engineering and to system safety. It deals with the estimation and management of high levels of “lifetime” engineering uncertainty and risks of failure. Also, major areas covered in reliability engineering are [8]:
• Reliability strategies
• System or product design
• Failure modes and effects analysis
• Reliability modeling and estimation
• Reliability testing
• Quality assurance strategies
• Work management and execution
• Continuous improvement
No system is totally immune to failure; with SIS in operation one can expect that it will always provide safe conditions when a failure occurs. Reliability with respect to SISs can be conceived as its ability to command an output to a safe state on a process demand within desired response time without causing a spurious action such as nuisance process trip. With this basic idea, in the following clauses include brief discussions to present how both the issues could be addressed to get the best out of the two. At the beginning, it is better to understand meaning of various commonly used terms in connection with reliability.
1.3.1. Common Terms in Reliability and SIS with Explanations
A few selected commonly used terms frequently encountered in reliability engineering and SIS as per standards are:
• Failure rate: The total number of failures within an item population, divided by the total number of life units expended by that population, during a particular measurement interval under stated conditions. Failure rate can be considered as the frequency with which an engineered system or component fails, expressed in failures per unit of time. It is time-dependent. In this connection, for the definition of the same, from probability point of view, may be referred to in IEC 61508-4:2010.
• Dependability: A measure of the degree to which an item is operable and capable of performing its required function at any (random) time during a specified mission profile, given the availability at the start of the mission. In other words, it is a measure of RAM of a system, where RAM stands for reliability, availability, and maintainability. Each of these three terms has been defined separately in this clause.
• Availability: A measure of the degree to which an item is in the operable and committable state at the start of the mission, when the mission is called for at an unknown state. Availability can be conceived as the probability that the system is operating properly when it is requested for use. In terms of failure, availability is the probability that a system has not failed or is undergoing a repair action when it needs to be used. From this, one can infer that if a system has a high availability then it should also have a high reliability. So these two terms go hand in hand. The relationship between availability, maintainability, and reliability has been shown in Fig. VII/1.3.1-1.

• Maintainability: The measure of the ability of an item to be retained or restored to specified condition when maintenance is performed by qualified personnel in a prescribed procedures and resources, at each prescribed level of maintenance and repair. Also, in simpler terms, it can be seen as a measure of ease and rapidity with which the system, equipment, or subsystem can be restored to operational condition following a failure. It depends on the design characteristic of the equipment or system provides other issues discussed at the beginning are made available. Relationship of availability, maintainability, and reliability has been shown in Fig. VII/1.3.1-1.
• Mean time between failure (MTBF): It is intended to measure only the time a system is available and operating. It is the mean number of live units (during which all parts of the item perform within their specified limits), during a particular measurement interval under stated conditions. It is average time excludes the time spent waiting for repair, being repaired, being re-qualified, and other downing events such as inspections and preventive maintenance, and so on [9]. Calculation basis of MTBF/MTTF is the same. MTBF: θ = T/F, where: θ, mean time between failure; T, total running time/cycles/miles/etc. during an investigation period for both failed and non-failed items; F, the total number of failures occurring during the investigation period.
• Mean time to failure (MTTF): This refers to reliability for non-repairable items: It is the expected time to failure for a non-repairable system.
• Mean time to repair: The average time required to troubleshoot and repair the equipment or system and return to normal operating condition. It is the sum of corrective maintenance times at any specified level of repair, divided by the total number of failures within an item repaired at that level, during a particular interval under stated conditions.
• RAM: Here RAM stands for reliability, availability and maintainability. These three factors collectively referred to as RAM are major attributes towards system design with great impact on sustainment, life cycle costs as well as system's ability to perform the intended mission and affect overall mission success.
Relationship among the members of RAM has been shown in Fig. VII/1.3.1-1.
• Reliability: Reliability is the probability of zero failures of an item over a defined time interval (or mission). From the definition one can infer:
• The probability of failure-free performance under stated conditions.
• The probability that a system, equipment, or device can perform its intended function for a specified interval under stated conditions.
Reliability represents the probability of components, parts, and systems to perform their required functions for a desired period of time without failure in specified environments with a desired confidence. Reliability accounts for the time in which operating system or device under specified conditions, may fail. The relationship between availability, maintainability, and reliability has been shown in Fig. VII/1.3.1-1, which is self-explanatory.
• Safe failure fraction and diagnostic coverage: Both of these terms are related to SIS and reliability, and both of them have been derived from IEC 61508-4:2010. Safe failure fraction is the ratio of average safe failure plus average dangerous failure detected and safe failure and dangerous failure. Diagnostic coverage stands for the fraction of dangerous failure detected by on line automatic tests. In order to understand, it is better to take the help of Fig. VII/1.3.1-2.
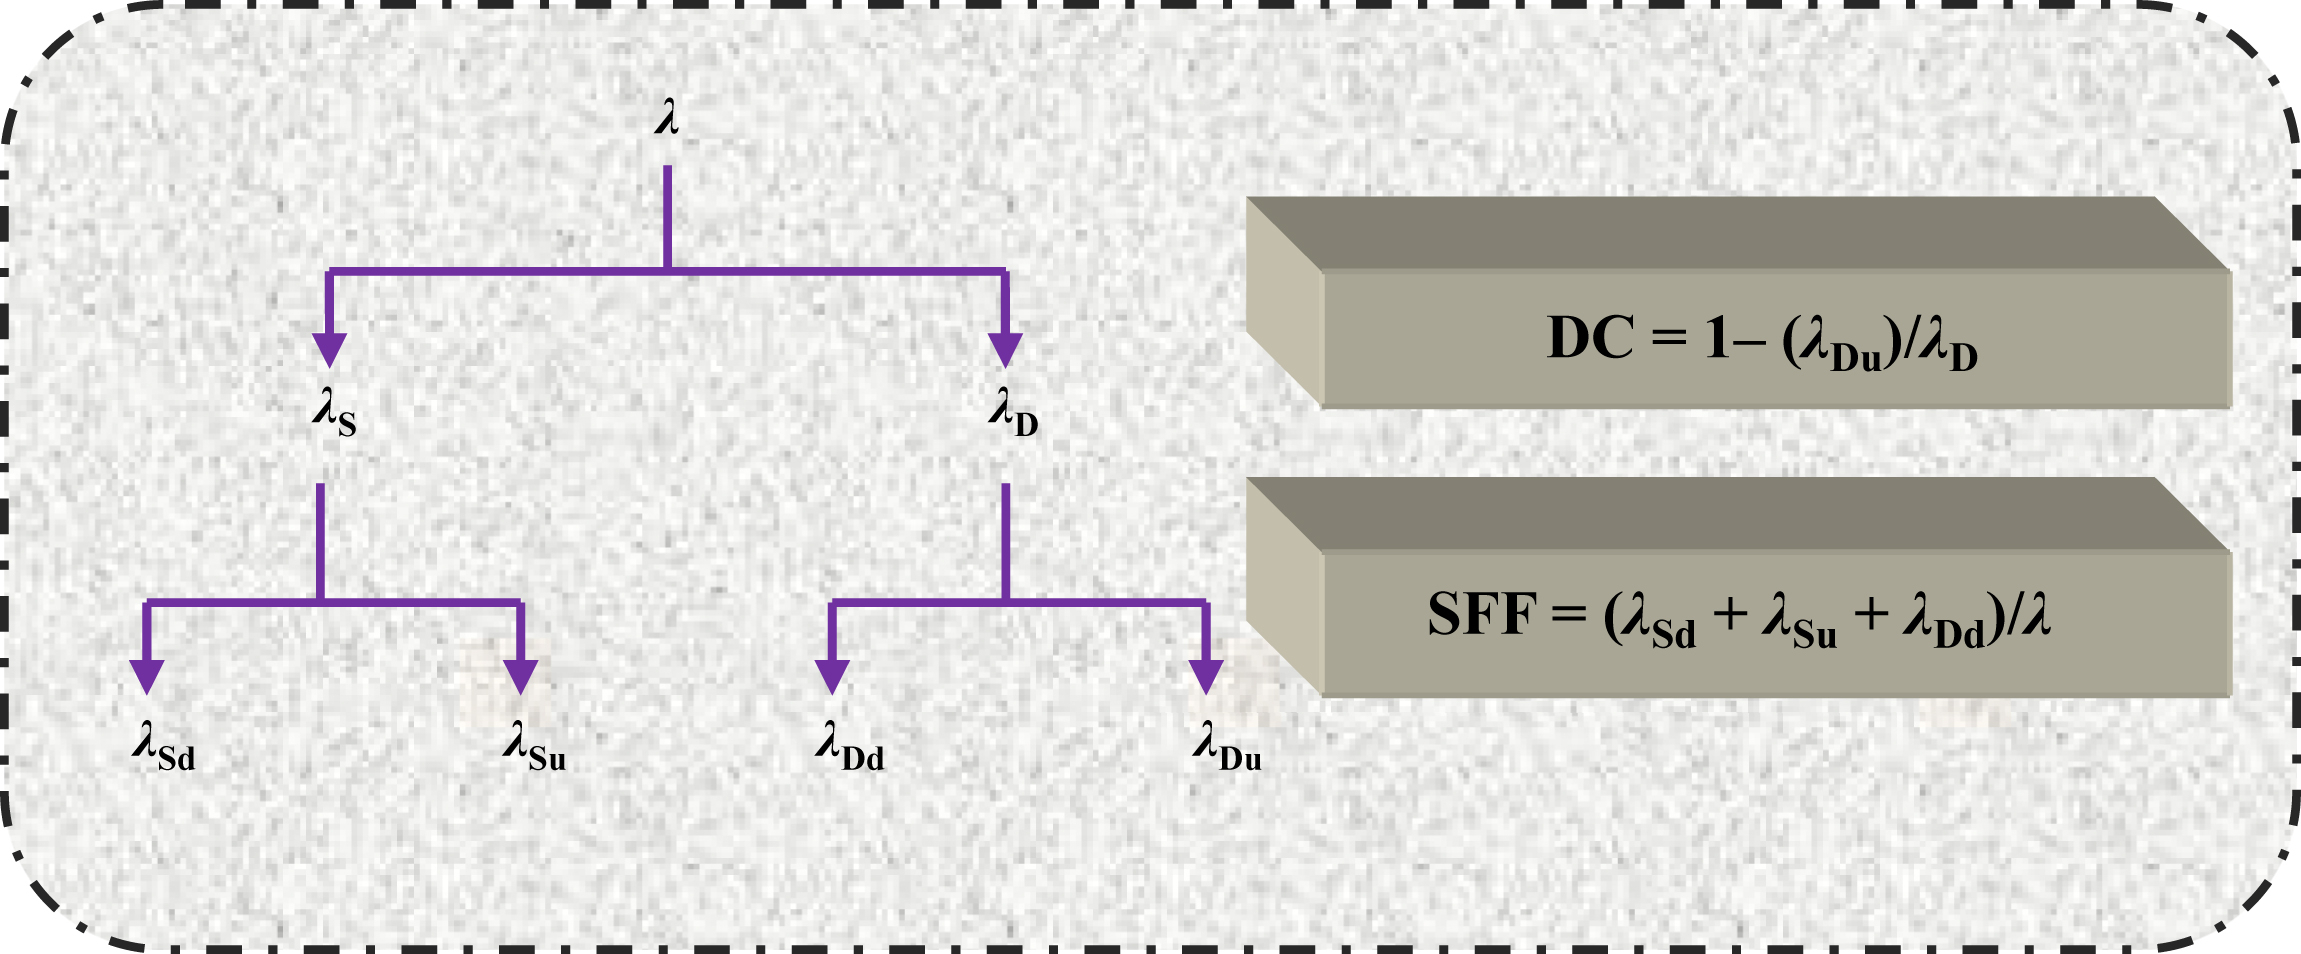
Figure VII/1.3.1-2 Failure rate safe failure fraction and diagnostic coverage with their relationship. For symbol legend refer to Table VII/1.3.1-1. Standard followed: IEC 61508:2010.
Table VII/1.3.1-1
Lists of Symbols for Failure Rate and Related Terms
| Various Terms | Symbols Used to Represent | ||
| Detected | Undetected | Others | |
| Safe failure (λS) | λSd | λSu | NA |
| Dangerous failure (λD) | λDd | λDu | NA |
| Safe failure fraction | NA | NA | SFF |
| Diagnostic coverage | NA | NA | DC |

Failure rate is represented by λ. There are two categories, viz. dangerous failure, where probability of safety action decreases and EUC (Appendix I) may not in safe state (λD), and safe failure, where EUC will be in safe state represented by (λS). Again each of these failure rate types has two subdivisions, viz. detected (d) and undetected (u). Various symbols used have been detailed out in Table VII/1.3.1-1.
• Reliability–utility: Uncertainty may have a very adverse impact. It is therefore necessary to have studied the reliability of product and services. Poor quality product or service may have serious impact to include but not limited to:
• Safety
• Property, environment, and personnel
• Profit margin
• Cost of repair and maintenance
• Delay in deliverables
• Customer confidence
• Competitiveness
• Reputation
The following are the major take off from reliability studies, which is very pertinent and important for SIS studies as both are coupled with each other.
• Reliability is a study and measure of uncertainty. So, one needs to take the help of probability theory and some knowledge on the same will be helpful.
• Reliability is a type of quality over time and necessity to be attached to products and services for better results and arriving at safe situation.
• Reliability helps to identify the cause of failure and during design stage; the same needs to be addressed so that EUC is in safe state at different failure conditions.
• Cost of unreliable design has serious impact on business as discussed previously.
1.3.2. Reliability Theory and Measurements
In Chapter I, basics of probability density function or PDF, cumulative distribution function (CDF), etc. have been discussed; with this knowledge it is better to explore some mathematical treatment. So these are not repeated, if necessary the reader may recapitulate.
• Short mathematical treatment: Since reliability is a time base function, let cumulative distribution be represented in terms of time hence, F(t), where:
![]() (VII/1.3.2-1)
(VII/1.3.2-1)
whereas by definition survival function:
![]() (VII/1.3.2-2)
(VII/1.3.2-2)
Hazard function h(t) is other important function in reliability; it is the conditional probability of failure in the interval t to (t + dt), given that no failure has occurred in between 0,t:
![]() (VII/1.3.2-3)
(VII/1.3.2-3)
There are a number of distributions such as normal, exponential, etc. that could be applied. Several types have been listed in brief in Table VII/1.3.2-1.
There could be other distributions also. However, in order to limit the size of the book discussions shall be restricted to only one type, so exponential distribution is chosen (in the table) for discussions, and also Weibull modeling can be done by exponential distribution.
• Reliability block diagram and Laws of Reliability: Another important issue is reliability block diagram. What is reliability block diagram (RBD)? An RBD is a graphical representation of the components or subsystems of the system and their relation from a reliability point of view. The diagram represents the functioning state (i.e., success (S) or failure (F)) of the system in terms of the functioning states of its components/subsystems. RBDs are mostly used for analysis. Necessary software packages are available to handle these. Here, both independent modes and dependent modes can be analyzed in the similar fashion. In practice of instrumentation and control engineering, there are several components and the measuring system is complex, and there may be serial or parallel components. With the following example, these shall be examined.
Table VII/1.3.2-1
Major Distribution in Reliability
| Distribution | Formula | Remarks |
| Exponential | Failures occur in random intervals and the expected number of failures is the same for long periods. h(t) is constant λ, 1/λ is MTBF (θ). So, 63.2% of items will have failed by time t = θ. | |
| Weibull | The survival function: | To compare with Eq. (VII/1.2.3-1) in Clause 1.2.3, where influencing factors have been elaborated (γ = 0). Also refer to Fig. VII/1.2-1, bathtub curve, for the following: When β = 1, the hazard function is constant can be modeled by η = 1/λ. When β < 1, decreasing hazard function when β > 1, increasing hazard function. |

• Series system: In series system, several subsystems may be in series, viz. sensor, conversion unit, signal processing unit, etc. The reliability of components in series needs to take into account the probability of individual failures in a given period as shown in Fig. VII/1.3.2-1.
From the figure, one gets that if:
![]() (VII/1.3.2-4)
(VII/1.3.2-4)
when generalized:
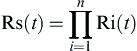 (VII/1.3.2-5)
where Rs(t) is the reliability of the system and Rn(t) is the reliability of nth subsystem at a given time t. Let for a system, with three subsystems having reliabilities as 0.9, each then Rs(t) = 0.9 ∗ 0.9 ∗ 0.9 = 0.729 = 0.73. Whereas if they are parallel, then:
• Parallel system: In a parallel system, subsystems are in parallel as shown in Fig. VII/1.3.2-2. There would have been serious improvement in reliability as shown in the figure.


• MooN system: In this system, there are N devices from which M numbers of devices need to be used. In thermal power plants of say 500 MW, there are eight pulverizers and six numbers to be made available for full load operation.
 (VII/1.3.2-6)
Further details will be available in SIL discussions (Chapter VIII) for calculation for PFDs.
• General guide for reliability design shall include but is not limited to the following:
• Component selection.
• Load–strength relationship with safety margin.
• Least possible complexity.
• Design optimization.
• Analysis of failures.
• Single-point failure treatment.
• Lessons learned.
• Avoidance of systematic fault.
• Diversity (CCF issue).
• I&C manufacturing quality, etc.
1.3.3. Reliability of Safety Instrumentation Systems
It is important to understand the relationship between the failure types or causes, and failure rates or effect of failures. Failure types discussed in Clauses 1.2.4–1.2.6 are failure causes for a hazardous event, which would create two types of failures, viz. safe failure and dangerous failures shown in Fig. VII/1.3.1-2. Dangerous failures call for SIS so that system will be safe state. This relationship has been depicted in Fig. VII/1.3.3-1.
From the preceding, it is clear that SIS and reliability go hand-in-hand. A functional safety assessor (FSA) assesses the safety assessment/analysis report (SAR) after SIS is developed to check the system reliability and SIL. In order to achieve a tolerable risk level, the end-user, who needs to install SISs in the plant, initiates SIS projects. Detailed process outline for the same has been elaborated as follows:
• Based on management decisions, a risk analysis is performed to determine the risk level of the plant (or EUC).
• Decisions are undertaken to install SIS as required, based on risk analysis report.
• It is important to decide how reliable the SIS and each subsystem should be.
• Assessments of the reliability of the design are carried out to ensure that the reliability requirements are achieved. It is neither expected nor possible to finalize the whole thing in one go; naturally it may be made final by iterative method. At this point, suppliers play great roles for supplying the failure data, or suggesting optimum solution from suppliers' experience.

• SIL allocation comes next and is usually carried out jointly by end-user, consultants (if any), and analysts.
• Subsequent to SIL allocations, an SRS is prepared. The SRS serves as the governing document in the SIS development, and specifies the detailed requirements for the SIS reliability.
• Based on the SRS, an SIS design is developed which is the basis subsequent steps.
• Based on finalized SIS design, SRSs are developed and floated for suppliers to respond.
• When as per SRS materials are supplied, these are installed.
• In order to demonstrate that the reliability requirements in the SRS are fulfilled, SAR with all the evidence and arguments including reliability calculation are prepared.
• For final reliability demonstration, the end-user, system integrator, component supplier, and FSA will be involved to assess the SAR independently and verify the arguments.
• FSA decides to approve or reject the SAR based on joint assessment.
• When a SAR is rejected, SIS revisit and modification is necessary for a better system.
Often SIL is considered as the overall measure for SIS reliability (safety integrity). From the standard, it is clear that there are three important issues in system integrity, and these are hardware, software, and systematic integrity. SIS reliability quantification is influenced by many factors, for example, selection of RBD, etc. On account of dependence on environmental conditions and human interaction, it is not always easy to keep independence between SIS and rest of the system. Naturally, it is important to be aware of some side effects introduced by SIS, that is, additional problems introduced by SIS. In modern times for floating oil installations people go for a dynamic positioning (DP) system, in place of conventional mooring system. DP systems are independent systems, but needs to interact with integrated control systems for exchange of many data. Therefore, it is needless to tell assessment of reliability of the system is extremely important. Now, if there is some interface problem between the two systems, then additional complications will arise are they not? Also at times, spurious actions from SIS make operators very much disturbed. In addition to the possible safety hazards, the SIS may also spuriously operate to disturb production and lead to losses and costs. Therefore, importance for assessment of reliability of SIS cannot be overestimated. There are several methods to assess reliability of SIS such as RBD, FTA, LOPA, and risk graph. RBD, FTA, and LOPA have already been discussed, so let’s concentrate on risk graph now.
1.3.4. Risk Graph
In Chapter I, risk matrix has been discussed. Risk graph is similarly used to categorize risks; additionally it can be used to determine SIL in process industries (especially when there many hazards to analyze). The discussions are presented naturally in a generalized way, however for each application one needs to calibrate the same. In this approach, there are four sets of parameters, viz. “C,” “F,” “P,” and “W” (see Fig. VII/1.3.4-1), each arranged as a column. All of these parameters “describe the nature of the hazardous situation when safety instrumented systems fail or are not available. One parameter is chosen from each of four sets and the selected parameters are then combined to decide the safety integrity level allocated to the safety instrumented functions” (Annex D1of IS/IEC 61511-3:2003). Let an example with exposure to radioactive radiation case be analyzed.
Based on consequence, the first the hazard is divided; these are Ca through Cd. Such categorization is based on injury /fatality as shown in the figure. Then exposure time is under consideration, that is, how much time a person is exposed to the hazard (e.g., radiation) represented by F as shown. These are rare exposure or frequent exposure. The hazard event is tested for probability (represented by P as shown) of avoidance. Both the exposure rate and probability of avoidance are combined with all four consequences as shown. Now based on frequency (represented by W as shown) of occurrence, SIL are decided. Compare the same with risk matrix, where consequence and frequency of occurrence were main considerations only, but SIL were not really assigned from there. The reader’s attention is drawn to top right side SIL box to the bottom left SIL box. The bottom left box is “b,” meaning not recommended operation, that is, no single SIF is sufficient (should be avoided). On the other hand, the top right side says no safety requirement. The preceding description is based on a generalized case, and for specific case one needs to calibrate the same. This is a semi-quantitative approach. The reader may refer to Annex D of (IS)/IEC 61511-3:2003 for further details. In this connection, D3 of IEC 61511-3:2003 the stated standard may be referenced for calibration. Also, Tables D1 and D2 of the stated standard may be referenced for explanation of C, F, P, etc. SIL determination by risk graph has been detailed in Clause 1.2.4 in Chapter VIII also. With these discussions on reliability concluded, now it is time to move on to see how instrument components need to be considered for SIS requirements.

1.4. Component Functional Safety (Safety Instrumented System Components)
Control and managing of industrial plants with the right I & C components and subsystems for optimal operational efficiency and safety is not an easy task. It is a quite complex job, especially when system availability and avoidance of spurious tripping is important simultaneously with plant safety. Conventionally, there are two parts in the plant control and safety. These are BPCS and SIS as already discussed in previous chapters. Basically each of these systems consists of:
• Sensors as signal input
• Input signal interfacing (signal processing and interface)
• Logic solver and associated communications
• Output signal interfacing (signal processing and interface)
• Final control elements as recipient of output command
The scope of an SIS encompasses all instrumentation and controls that are responsible for bringing a process to a safe state in the event of an unacceptable deviation or failure. For better understanding see Fig. VII/1.4-1. In this figure, only (two layers) BPCS and SIS components have been taken into consideration (and not mechanical device like safety valve, etc). This is the same previous example (Fig. VII/1.1.2-2), so no further explanation is necessary.
Here, high pressure petroleum product is transferred to a tank, and incoming control valve is regulated based on the level in the tank. If there is a high level, the tank will be pressurized so at high pressure, the shutoff valve is closed. Usually there are alarms before operation of shutoff valve (not shown here), which also acts as a layer of protection. One thing interesting here to note, is that there is a communication channel between SIS and BPCS. This has been kept intentionally to show that in the modern era it is possible to integrate the two different systems and/or sharing data between the two systems which otherwise are kept separate for safety and safety integrity. From Fig. VII/1.0.3-2, it is seen that there is interrelation among SIF, SIS, and SIL. This is made clearer in Fig. VII/1.4-2.
Another important aspect of SIS is to determine SIL so as to make sure that safety is available when demanded. According to IEC 61508-4:2010, there are three modes of demands. Empirically it can be considered as: frequency of demand; <1/year – low demand, >1/year – high demand, and where the safety function retains the EUC in safe state as a part of normal operation. So, SIL is a statistical representation of the safety availability of an SIS at the time of process demand and is a major constituent of SIS with a number of factors to influence with:
• Device design feature
• Device integrity
• Diagnostics feature
• Systematic failure
• CCFs


• Installation
• Operation
• Maintenance
The proportion of time that the system is operational depends on component or subsystem:
• Failure rates
• Failure modes
• Hardware architecture
• Voting scheme
• Testing frequency
Brief procedure for risk reduction, SIL assignment, etc. has already been discussed. Now the focus of discussions will be turned onto the type of instruments better suited for SIS.
1.4.1. Sensor and Final Element (non PE) Electronic Device Details
Initially, IEC 61508 was developed as a safety and life cycle standard, which was not industry-specific. Later, there have been three separate divisions, viz. IEC 61511 for process industries, IEC 61513 for nuclear plants, and IEC 62061 for machinery sector. IEC 61511 has clearly put forward some guidelines for hardware to be used in SIS. In this standard, there are clearly two divisions, for example, PEs and non-PEs (in loose sense to distinguish from logic solver, because nowadays sensors and final elements also have programming features) like sensors and final control elements. In this part, sensors and final control elements are considered, while PEs will be discussed separately in next clause.
On account of advancement in technology, people go on adding feature after feature to the systems. It has been found many times these cause additional problems to the system, viz. in the form of spurious trips. It will not be prudent to consider that the existing standards are obsolete, instead people need to introspect whether the reliability of SIS has been properly evaluated! A well-designed system would increase the availability of plant safety by reducing spurious trips which occur on account of failure of SIS in correctly judge the safety situation. This depends largely on hardware architecture considered. Plant data suggest that majority of SIS problems are due to field devices such as sensors and final elements yet people put more attention on logic solver than field devices. This is also another issue. Modern smart field devices provide lot of information to the operator as well as to logic solver to address these issues. In modern generation, transmitter intelligence is built-in with sensors as well, in addition to the same in electronics of the transmitter. This enables characterization of the sensor, and it is possible for early detection and prediction of fault in the sensor. In this connection, Fig. VII/1.4.1-1 may be referenced. This is just an example to show that now it is possible to diagnose low supply pressure to final element, degraded voting of transmitter, impulse line plugging, etc. quickly. On account of this, field diagnostics and use of field bus systems make it possible for system integration of SIS with BPCS also.

Figure VII/1.4.1-1 Smart instruments with diagnostics. Inspired by and courtesy. D. Walker, Using Smart Safety Instrumentation System (SIS) to Make Better Operational Decisions, Emerson Process Management, March 2009.
• Non-PE general requirements: Now coming back to the specifics, one needs to note that when a device is designed and developed as per IEC 61508, for safety purposes, it is the responsibility of the manufacturer to specify safety level, capability, and limitation of the device including wetted parts. When these devices interface with process, it is the responsibility of the end-user to ensure that the interface is proper; there are no untoward incidents coming from the process such hammering, corrosions, H2 embrittlement, etc. The end-user also needs to prove that there is no undetectable failure in the process.
• Sensors: Third party validated supplier data reflects laboratory results, and not real-world failure causes. Even failure rate data specifying “x years” does not specify failure causes. After finalization of requirements of SIL, subsystem selection process is undertaken. During that time, it is better to look into the following as a thumb rule [12]:
• Replace discrete switches with transmitters
• Improve common cause strength
• Use diversity
• Use diagnostics
• Add redundancy
As there has been modern improved technology already in use for transmitters with a few improved effect discussed previously, naturally, much greater improved performance is expected of a transmitter compared to a switch. Not all common causes can be addressed, yet some common causes like high temperature failure can be addressed by selecting a robust transmitter, transmitters with built in ambient compensation capability, high temperature failure prediction capability (diagnostics), installing transmitter away from hot spot, etc. These are a few things which could be looked into to avoid common causes, and the same shall be considered during selection process. Depending on applicability and cost consideration, redundancy could be afforded. While selecting redundancy, due consideration needs to be put towards architecture for hardware redundancy and diversity in technology (e.g., 1oo2, etc. and say, for level measurement DP transmitter and capacitance probe – just for example to elaborate architecture and diversity points in redundancy). For further details on sensor redundancy, refer to [13]. The main idea behind all of these is to improve return on investment in terms of safety. Major issues involved for sensor performance shall include but are not limited to the following:
• Overall transmitter performance
• Process interface (discussed previously)
• Sensor (robustness and characterization)
• Transmitter electronic performance
• Quality control process
• Selection criteria and process
• Installation practices
Computing power in modern microprocessors make diagnostic features more and more powerful so that they go beyond detecting component failures to evaluate the performance of the complete measurement system, including common process interface problems. Some examples of these diagnostic features shall include but are not limited to:
• Pressure: Plugged impulse line detection and prediction
• Pressure-level: Leaking diaphragm seal detection
• Temperature: Fast, predictable detection of failed resistance temperature detector (RTD) or thermocouple (T/C); sensor drift
• Vortex flow: Detection of application changes (viscosity, density, etc.)
• Magnetic flow: Detection of faulty ground or electrodes or high process noise
• Coriolis flow: Detection of slug flow or tube coating
• pH: Detection and prediction of faulty electrodes
• Final elements: From the Offshore Reliability Equipment Database Association (OREDA), one can get that SIS failure due to sensor and logic solvers are 42% and 8%, respectively. So, a balance of about 50% of SIS failure occurs on account of final control elements making it to top the list (followed by sensor issues). Therefore, final elements generally are least reliable in the chain. Hazardous conditions of a plant are sensed by process sensors, and are reported to the logic solver, which, based on its wisdom set by the control logic, triggers (say) shutdown response. It is the duty of the final control elements to carry out the command through decisive and swift action. Normally, chopper-type final elements are chosen for such shutdown actions. For example, main fuel flow control for steam generators is done by a control valve, and there is separate shut off valve for trip action, that is, control and trip actions have separate valves. Similarly, in case of turbine control, there is a separate emergency shutoff valve (ESV) and control valve. However, there are situations in process plants where the same valve is deployed for both purposes. It is possible to take care of both the actions through single valve as shown in Fig. VII/1.4.1-2A.
In this connection, only one possibility (air to open fail close) has been shown for all the valves shown in Fig. VII/1.4.1-2. Here, valve types chosen are air to open/fail close valve and air connection is from the top. However, similar things are possible for air to close/fail open type valves or stay put type valves also. Interested reader may go through Chapter VI of “Power Plant Instrumentation and Control Handbook” (Elsevier) for further details. During system design, all elements of each of the SIF loops need to be addressed. Referring to Fig. VII/1.4.1-2A, it may be noted that based on control demand, the control valve is throttled and pneumatic signal is sent to the control valve via solenoid valve, which when is energized gives the path “E” for pneumatic signal to reach control valve (positioner). In case of requirement for shutdown, the electrical signal to the solenoid valve may be withdrawn (zero signal), which will cause path shown by “DE” to be opened so that air pressure from the control valve is vented and control valve closes. So, single valve is used for both purposes.
Since final element is the weakest link, so proper selection of the same is extremely important. The following three configurations are very popular. In all cases, control valves are equipped with intelligent valve positioner (IVP). These are:
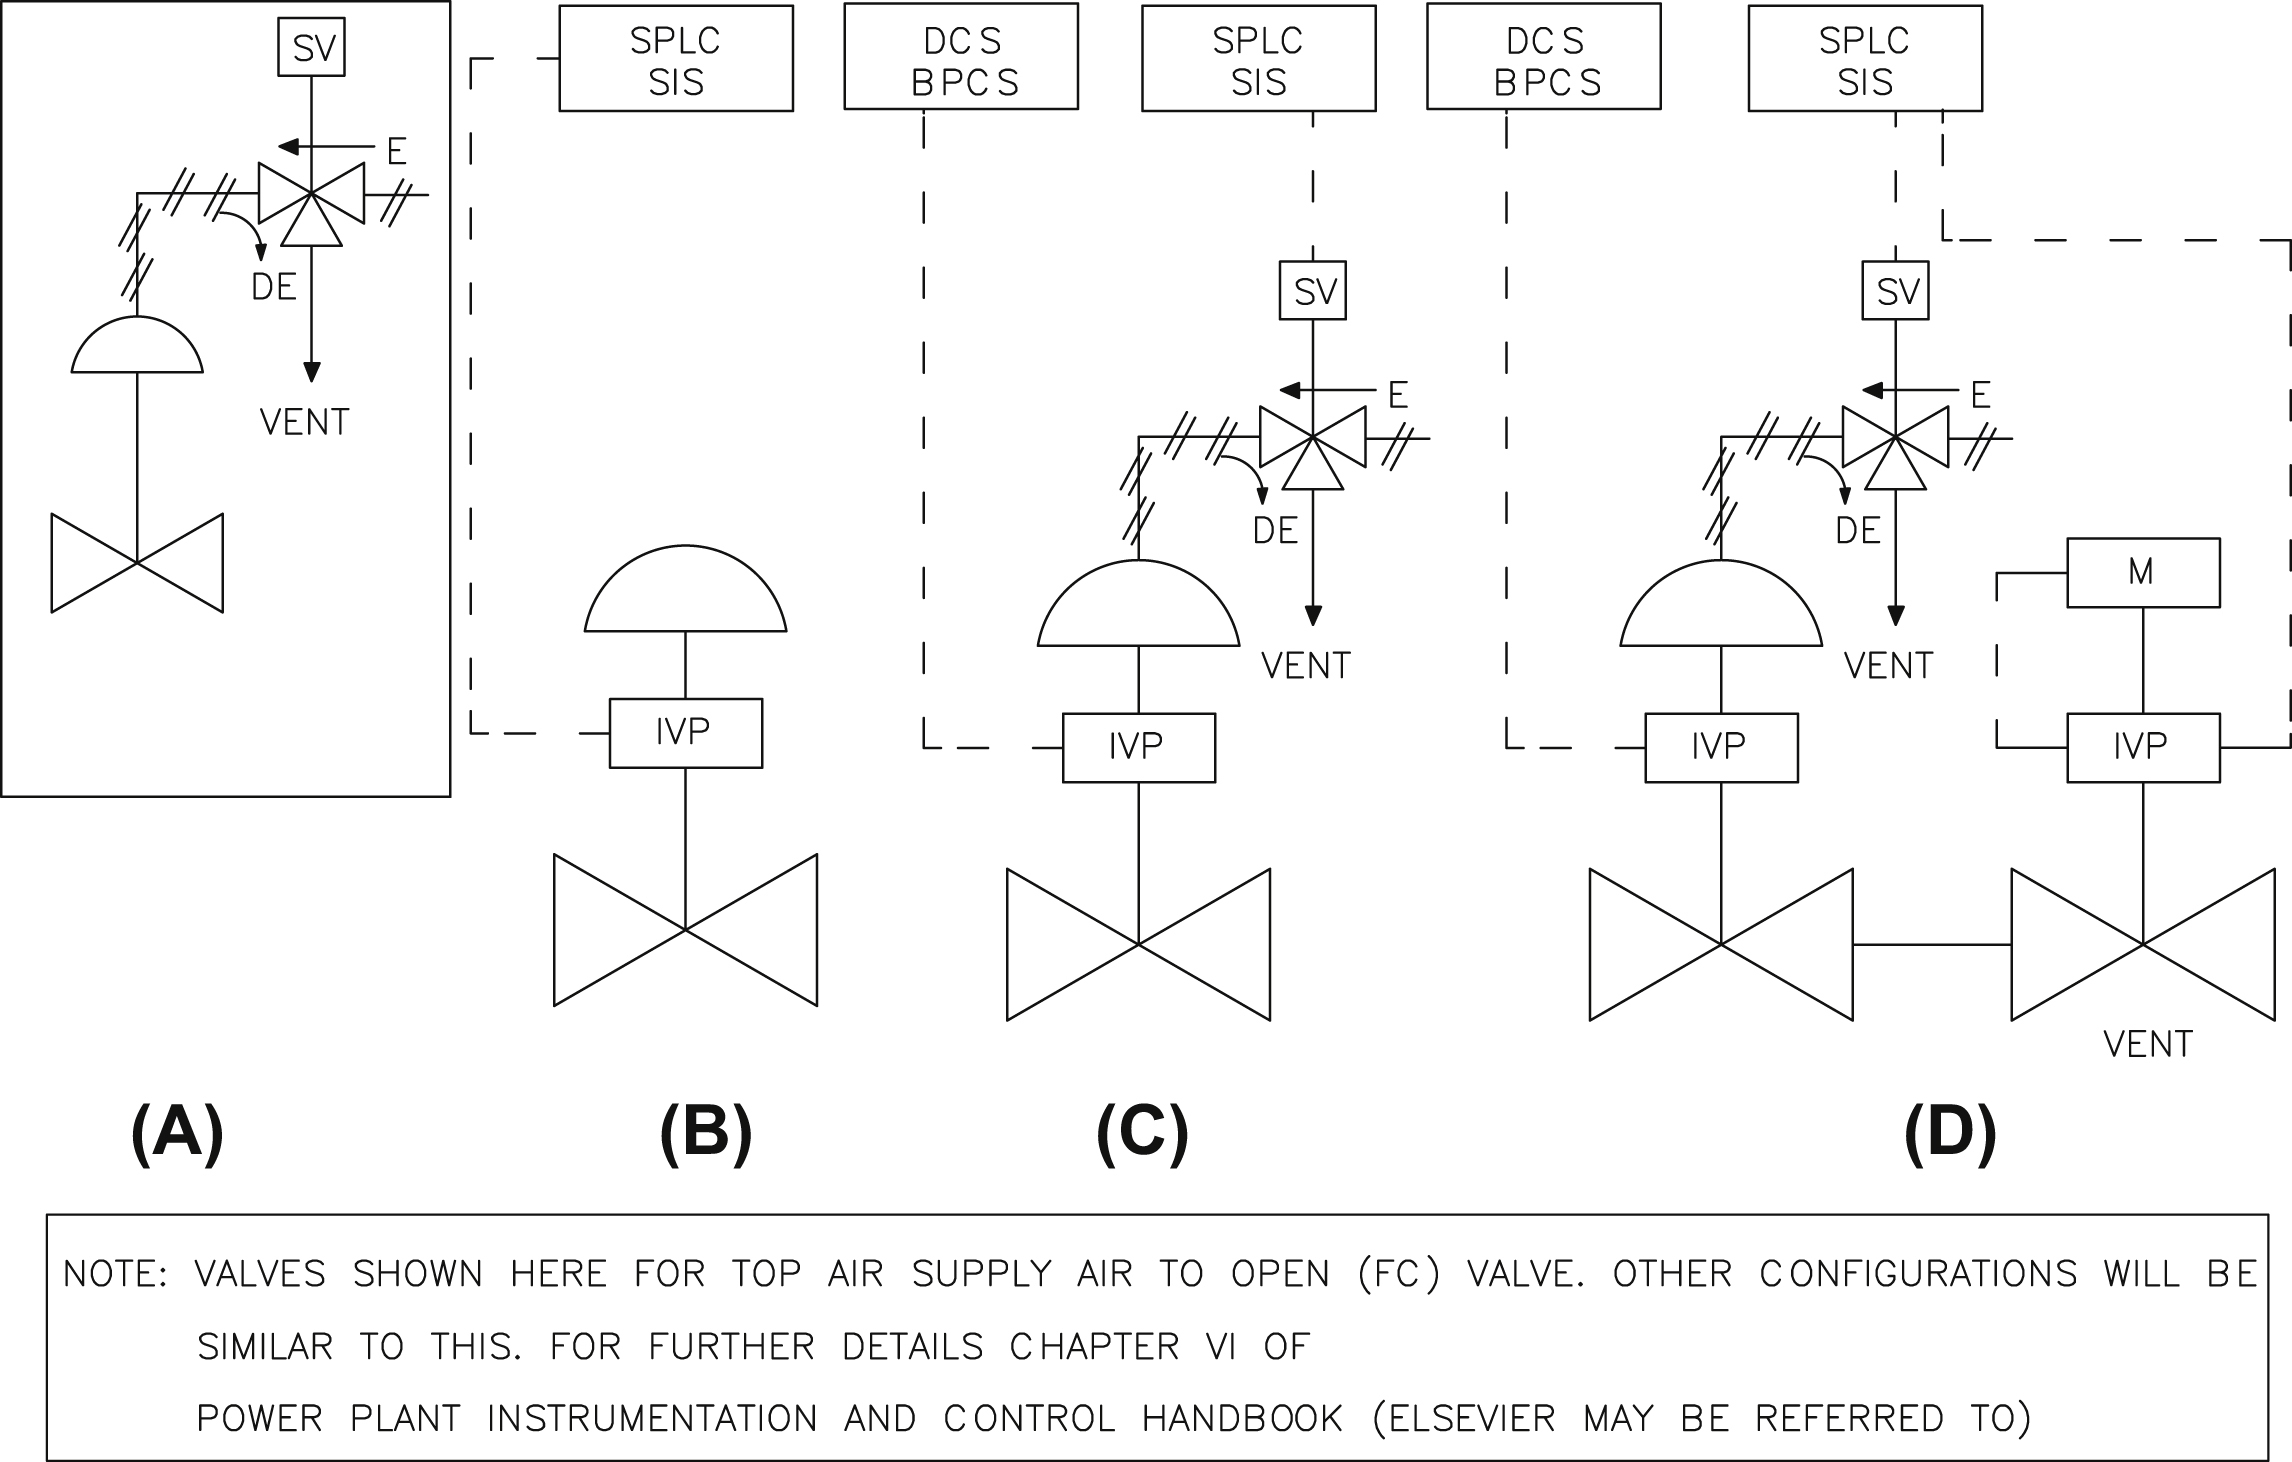
• Single valve used as safety function: Referring to Fig. VII/1.4.1-2B, one may note that the control valve is in ON/OFF duty, and in case of emergency, shutdown command will be sent to IVP from safe PLC (SPLC).
• Single valve used for both control and safety purposes: Refer to Fig. VII/1.4.1-2C. In this case, the control valve is required to do its normal duty based on signal from DCS, where from signal is sent to the control valve via solenoid valve similar to what has been described for Fig. VII/1.4.1-2A. So based on command from SPLC, control valve is closed.
• Control valve as redundant SIS final element with one ESV: Here, DCS sends signal to the control valve for normal operation. In case of emergency, the control valve solenoid valve as well as ESV gets the signal for closure. So, based on SPLC command, both the control valve as well as ESV will close as shown in Fig. VII/1.4.1-2D.
1.4.2. Programmable Electronic Device Details
“Safe PLC,” “fail safe controller;” there are so many names by which PEs in SIS are known. Frankly, these are various names given by the vendor to bring distinction to their products. However, in these controllers or PLCs, there will be choices for redundancies, high-end designs (taking care of safety requirements), and advanced diagnostic features. Mostly these are third party certified logic solvers for use in SIS. The fail safe PLC/controllers are used for the functional safety of machines or plants. They try to ensure fail safe operation and comply with the relevant standards: EN 954-1 up to category 4, IEC 62061 up to SIL 3 (fail safe and fault tolerant), and EN ISO 13849-1 up to PL e (discussed in subsequent sub-clause). Usually there would be two independent systems for control and safety functions in line with the standard. Simatic S7 of Siemens, Pluto or Independent Hi safety system of ABB, Guard Logix, AAdvance/Plant Pax of Rockwell Automation, and Quantum Safe PLC of Schneider Electric are examples of safe PLCs. Now systems such as Simatic S7 of Siemens are available where it is possible to simultaneously process both the standard and the safety programs using single set of CPU. Major features include but are not limited to the following:
• High productivity with less injury
• Machine architecture reduces system footprint
• Machine safety functions with speed and analog monitoring
• Advanced programming possibilities
• Better system integration
• Reduction of components: Coexistence of standard and safety programs in one controller
• Single PROFIBUS or PROFINET standard
• Safety communication Conform to SIL 3/Category 4
• Fast system configuration and commissioning
• Flexible, modifiable, and implementable software-based safety functions
• Faster reproducibility
Application areas may include both processes as well as machinery automation. In machinery area, application shall include mainly:
• Automobile industry
• General mechanical engineering
• Building of special machines
• Series mechanical engineering, OEM
• Plastics processing
• Packaging industry
• Food and beverage industry
A short discussion on safe PLC has been presented in Clause 2.4 of Chapter VIII also.
1.4.3. Machinery Automation (IEC 62061 and EN ISO13849)
IEC 62061 is a generalized standard for machinery applications. In case of factory/machinery automation in place of SIL, other symbols are more pertinent, discussed here, under major issues related to machinery safety, shall include but are not limited to:
• To avoid people injury, property, and business loss for unintended energy of the machine.
IEC covers the safety of any assembly where there is at least one moving component for safety-related electrical control systems. New EU Standards for Machine and Device Manufacturers covers functional safety with through IEC 62061 and EN ISO 13849, with both having some root with IEC 61508. European standards (viz EN/ISO 12100, IEC 62061 each have one or the other type A/B/C) for safety of machinery have typically has following structure: type A standards for basic safety; type B specific standard comprising: B1 for particular safety such as distance, temperature; B2 for safeguarding such as interlock, two hand control; type C machine safety. This directive also specifies when a product can use “CE” markings. Risk assessment and risk reduction for machines are available in EN/ISO 12100. IEC 62061:2005 is derived from IEC 61508 for safety of machines– functional safety of safety-related E/E/PEs. On the other hand, EN ISO 13849–1:2006 is also for machine safety – safety-related parts of PEs, control systems, and all types of machinery, regardless of the technology or energy type employed (electric, hydraulic, pneumatic, mechanical, etc.). One of the major distinction points between IEC 62061 and ISO 13849 is that reliability measure. In the case of IEC, it is SIL, and in case of ISO 13849, standard is represented by performance level (PL). In PL, with suffix “r,” it indicates the required performance level (PLr). What is PL? PL is a measure of the reliability of a safety function, having distinct five levels (a–e). PL e gives the best reliability required at the highest level of risk. PL is a technology-neutral concept applicable for electrical, mechanical, pneumatic, and hydraulic safety solutions. The structure for the components in the block is assessed to determine category B, 1 to 4 for diagnostic coverage (DC). The typical relationship between diagnostic coverage and categories are as listed as follows:
• For Category B DC: none
• For Category 1 DC: none
• For Category 2 DC: Low, medium
• For Category 3 DC: Low, medium
• For Category 4 DC: High
For calculation of PL of the system, details on the system's structure, that is, category, MTTFd (suffix “d” stands for dangerous failure), and DC, are necessary. (In case of ISO 13489 PL level is assessed mainly based on principles similar to risk graph and in ISO 62061 risk matrix style are normally followed.)
There is possibility of confusion regarding use of two standards viz ISO 13489 & IEC 62061. Normally when medium other than electrical system, ISO 13489 may be more appropriate. Whereas for customer demand for demonstrating safety IEC 62061 may appropriate. For safety-related control systems, standard components can be used as it is allowed as per standard also. However, safety components offer the advantage of reducing workload as the safety-oriented assessment, and analysis of the components used, is carried out by the producer of the safety components. For functional safety, the systematic integrity of components is taken into account, in addition to the use of a suitable category, the implementation of necessary fault detection and the consideration of failure rates/probabilities. When machinery manufacturers use standard components for safety functions, it is definite duty to assess compliance with safety-related requirements as per standard. This will call for considerable effort, if not practically impossible, especially when detailed producer’s information is not always available. For systematic failures, it is important that the components to be used operate correctly under all the operating and environmental conditions (temperature, humidity, vibrations, electromagnetic interference, etc.) including operating limit of the components (that can be expected). There are no general rules for using standard components in safety related applications. With standard components, it may be difficult to ascertain DC. SPLCs often offer the advantage of supporting necessary tools for safety-oriented programs. Finally, while using standard components and complying standards one should never ignore the influences of systematic approach and environmental effects.
1.4.4. Systems for Nuclear Power
The potential hazards to the public from nuclear power plants (NPPs) – especially in terms of the risk of having to evacuate significant areas of land for many years – are in general greater than those for any other potential industrial hazards (Exception! Bhopal disaster where impact is still going on through generations). Major safety cases are embedded with C&I architecture and it leads to space requirements and system separation requirements. Therefore C&I architecture must be addressed at early stage of the design. The typical order for C&I systems shall mainly cover:
• Definition of the overall C&I architecture, including space and separation requirements
• Functional specifications for C&I systems
• Detailed technical specifications for C&I systems
• Procurement action
• Detail design and manufacture
• Works testing
• Site acceptance test
• Installation and commissioning.
Some details regarding safety classification in NPP has been described in Chapter XII. There are two major systems of NPPs related to safety aspects of the plants; these are:
• Reactor protection system (RPS)
• Engineering safety feature actuation systems (ESFAS)
Normally, a dedicated sensor, logic solver, final elements, and human–machine interface (HMI) are assigned for checking the abnormality of the system. There shall be separate control and protection systems, and such separation shall include both space, physical separations, as well as electrical isolation. For RPS, in addition to separation discussed there shall be diversity applied to take care of CCFs. Also, separate route diverse logic solvers are dedicated. Even different shutdown systems are planned, for example, boron versus controlling rod. There shall be both physical as well as electrical separation between different systems indicated as follows. Typical SIL ratings are as follows (with redundancy for RPS):
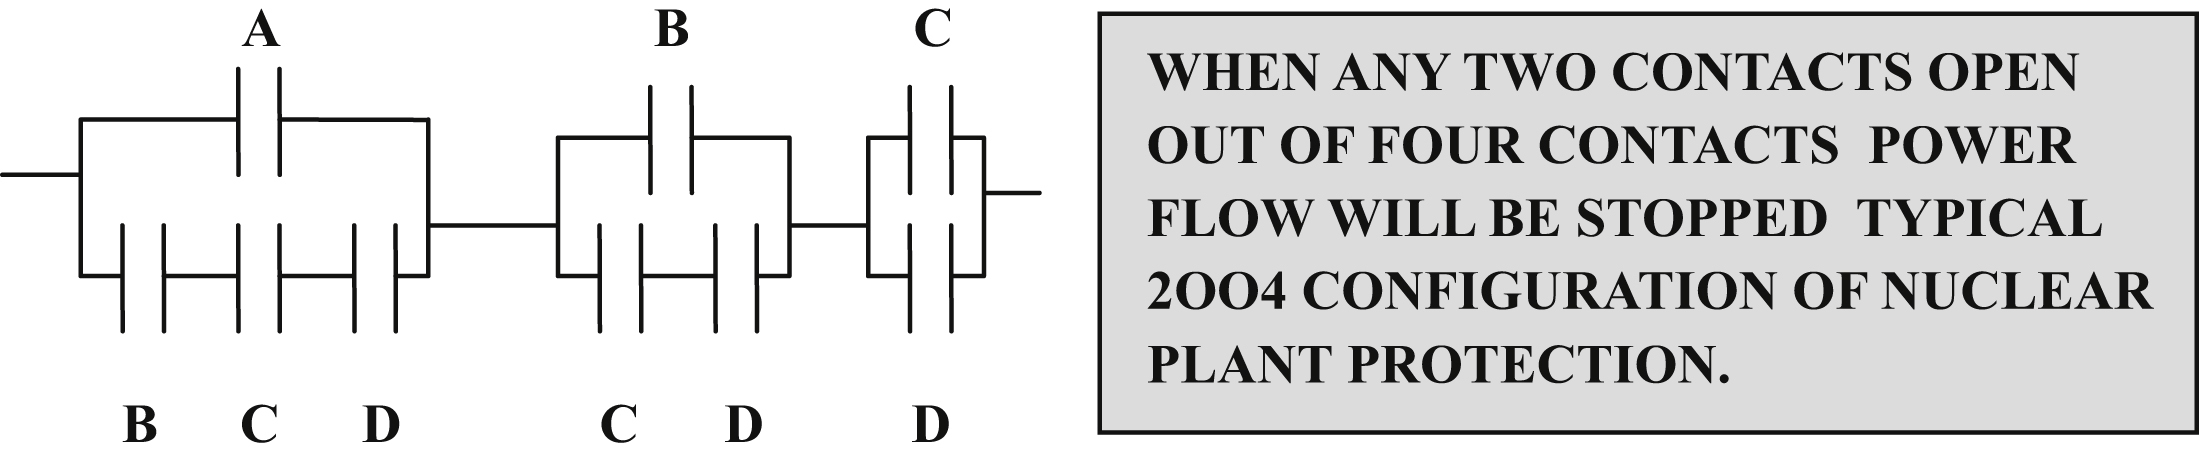
• Control systems: SIL 2/3
• Primary RPS: SIL 3 or 4 redundancy 2oo4
• Primary RPS: SIL 3 or 4 redundancy 2oo4
• ESFAS: SIL 3 or 4 redundancy 2oo4
Typical 2oo4 protection in nuclear power plant has been shown in Fig. VII/1.4.4-1.
Now concentration will be put on redundancy architecture and associated PFDs.
1.4.5. Hardware Redundancy Architectures
It is better to start the discussions with Fig. VII/1.4.5-1 from where it is clear that just by adding devices in redundant mode, the safety availability does not always increase, as there are pros and cons in each of the applications as shown; in the first case, chances are more for spurious trip, in the second case, it is the other way round. So, a detailed study of various redundancy modes will be necessary. Dual configuration shown appears to be safe, but could also be the root cause of spurious trips due to random failures. Now the aim is to find advantages and disadvantages of implementation of various hardware redundancy architectures (industry specific and international standards). It is very useful to understand a few terms such as redundancy, multiplicity, and diversity. From United States Particle Accelerator School (USPAS) one can get:
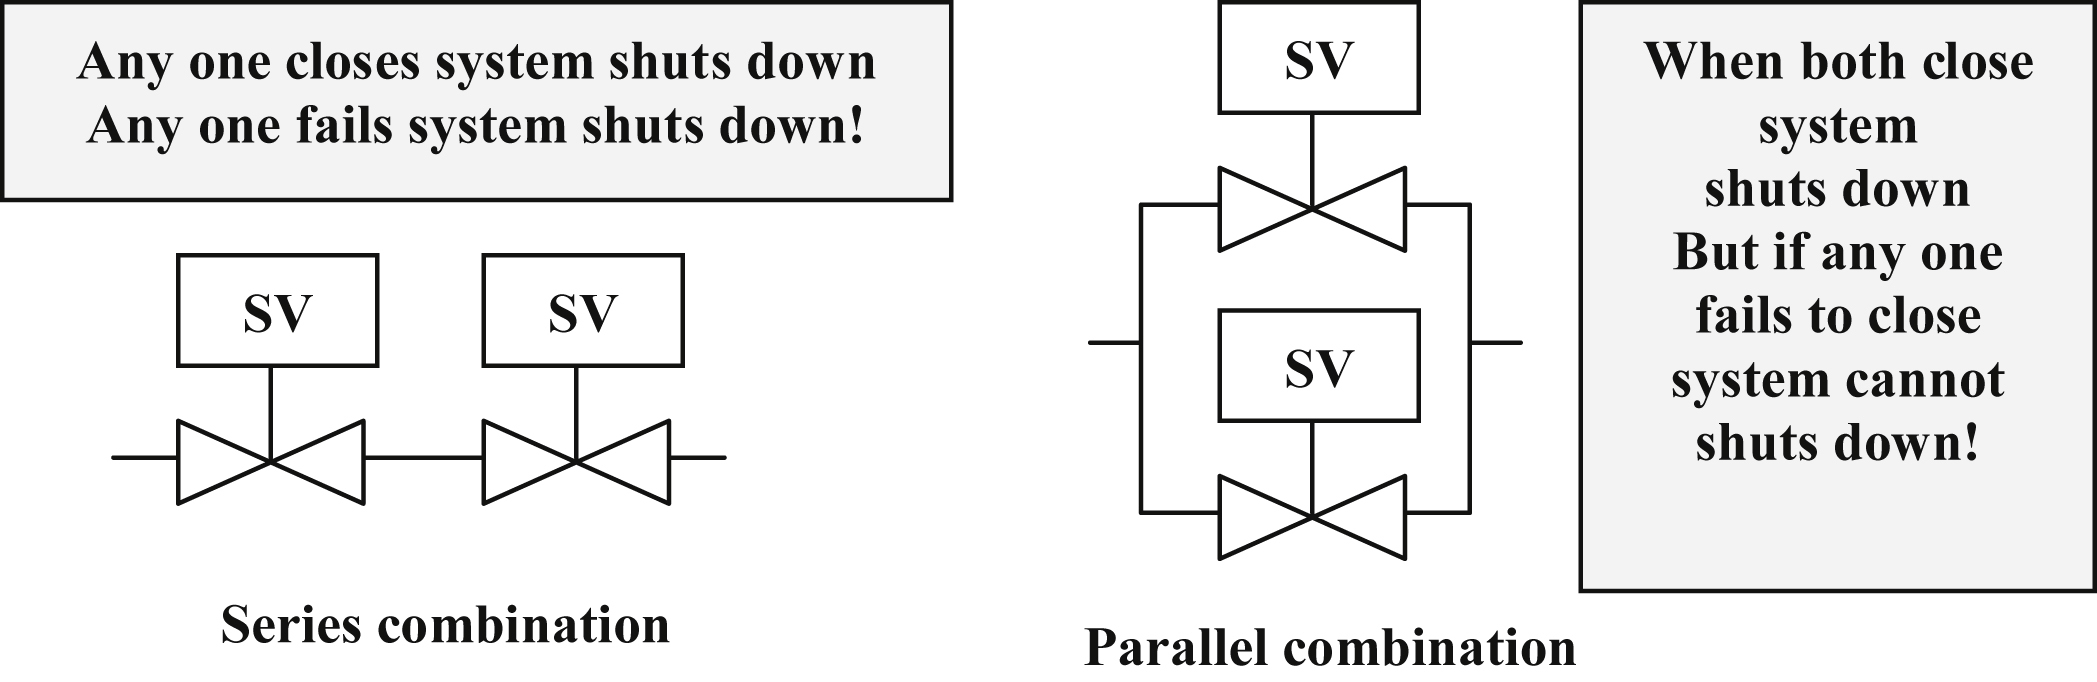
• Redundancy: Calls for use of identical SIFs to achieve higher safety reliability.
• Multiplicity: Use of multiple shutdown paths or protection devices.
• Diversity: Different types of devices used to reduce the probability that multiple or redundant devices can be affected by common failure modes.
Also, the architecture needs to take care of:
• Implementation of system at high level
• Fault tolerance
• Physical environment
• Physical constraints
• Redundancy, multiplicity, and diversity
• Final elements
In the case of de-energize type logic set of contacts, opens to trip or shutdown the system (in case of energize to trip logic, contact closure will be considered for trip; also series, parallel configuration types will be reversed). When trip is associated with proper cause it is safe failure. When this is NOT, then it is spurious/nuisance trip or shutdown. As per IEC 61508: Demand or failing element commands output to a safe state.
Now a few configurations will be discussed. Note that only empirical formulas are given here detailed calculation basis as in line with IEC 61508-6 AnnexB:2010 has been presented in Clause 1.3.7 of Chapter VIII.
Following symbols and their meanings will be helpful in studying various configurations discussed in Figs. VII/1.4.5-2 to 1.4.5-4.
λ for failure rate with suffices DU/DD, etc. for dangerous failure detectable or undetectable as discussed earlier. MRT, mean repair time, TI, test interval, PFDAvg with usual meaning already discussed. Also “S”, Sensor, I/P, input LS, Logic solver, O/P, output, AC, Actuator, P, Power, etc.
• 1oo1: This stands for one out of one configuration. This is simplex device. Analysis details are available in the accompanying Fig. VII/1.4.5-2.
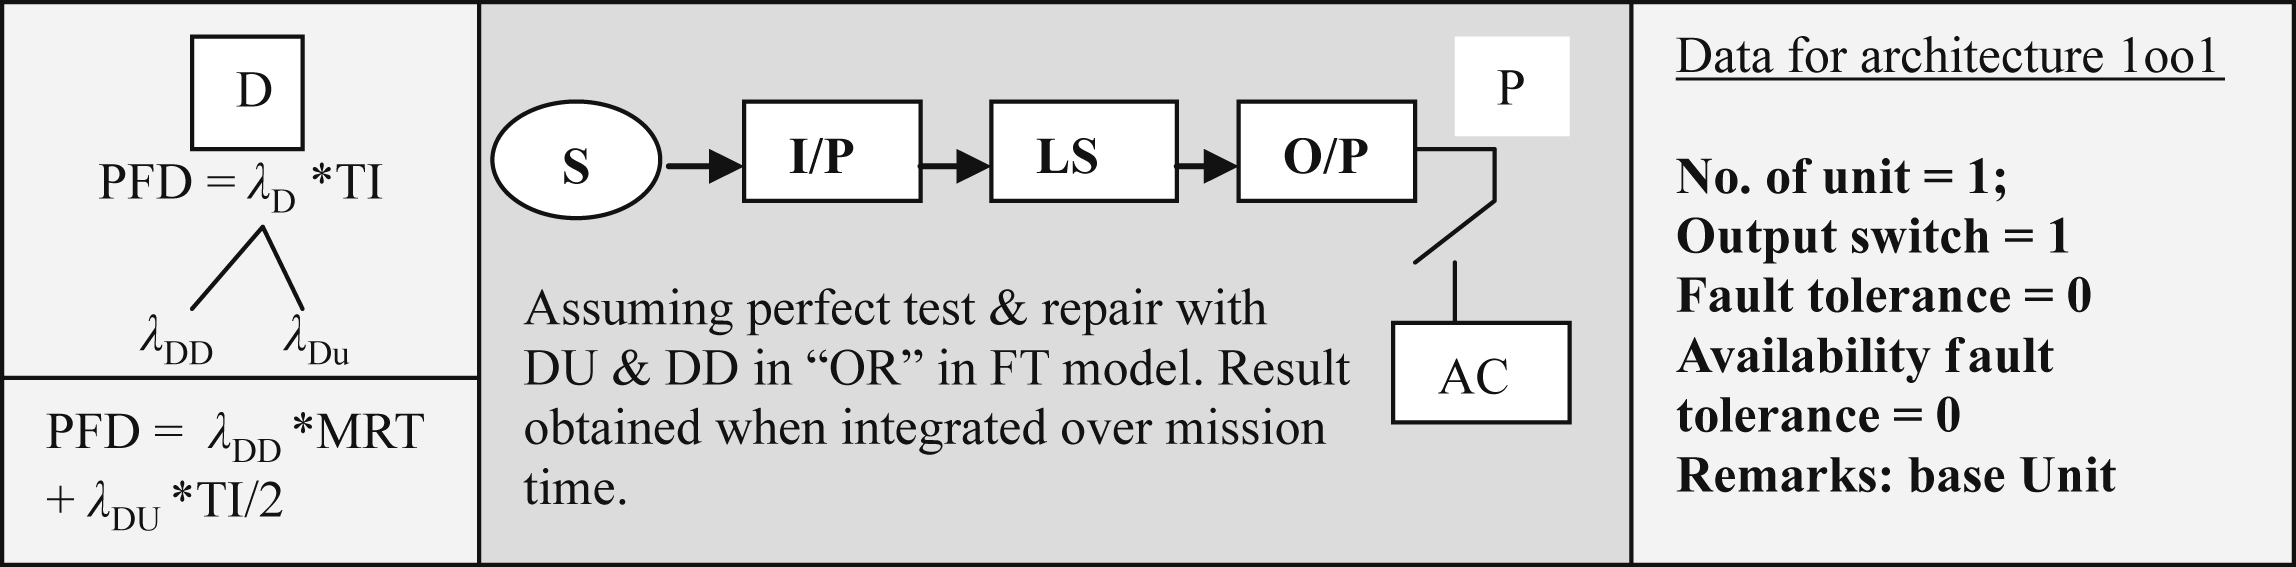

• Basic block diagram of 1oo2 has also been shown in Fig. VII/1.4.5-3 with an explanation given in the RHS box. Basic symbolic representation of 1oo2 has been shown in the (top) box (in Fig. VII/1.4.5-3). Empirical formula of PFDavg is also shown. In the preceding figure, perfect test is considered. CCF factor β and proof test coverage, etc. have not been considered in arriving at the PFD value. There is another version of the same, that is, 1oo2 with diagnostic represented by 1oo2D. From data available through IEC, it shows that the highest diagnostics 1oo2D systems can achieve is 90%.
• 2oo2: This dual controller configuration is used in energize-to-trip protection systems. The outputs of two controllers are wired in parallel. If one controller fails with its output de-energized, the other is still capable of energizing the load. A disadvantage of the configuration is in failures of controller where the output is energized (discussed at the beginning), when controller fails (short circuiting). This configuration is not suitable for de-energize to trip protection systems unless each unit is of an inherently fail safe design. Since the controllers are wired in parallel, any short circuit (dangerous) failure of the components results in a dangerous (outputs energized) failure of the system [14]. IEC requirements: two demands or simultaneous failing elements command output to a safe state. Empirically the PFDavg will be: λDU ∗ TI.
• 2oo3: This is very commonly used configuration. There is another special version of the same and popularly known as triple modular redundancy (TMR). Typical configuration of both of them has been depicted in Fig. VII/1.4.5-4.

In Fig. VII/1.4.5-4A, configuration of contacts both NO type and NC type have been shown. In the former case, a combination of two of them are in parallel with three such probable combinations are in series. In case of NC contacts, de-energize to trip the configuration is just reverse. A typical block diagram of 2oo3 architecture has been shown in Fig. VII/1.4.5-4. Here the architectural data are as follows:
• Number of units: 3
• Output switches: 6
• Safety fault tolerant: 1
• Empirically PFDavg: (λDU ∗ TI)2
• Available fault tolerant: 1
• Remarks: Safe as well as available
TMR is a specialized version of 2oo3 with much more stringency implemented. TMR logic is quite popular in power and other industrial plants (e.g., TMR logic is used in many governor controls of turbine, GE gas turbine, or overpressure protection of KWU turbine). In case of sensors, both 2oo3 and TMR are also applicable. TMR voting logic principles have been shown in Fig XI/1.1-2. For details, Chapter 3 of “Power Plant Instrumentation and Control Handbook” [13] by Elsevier may be referenced.
In case of complete TMR system, there are three main processors (MPs) as well as I/O processors. Each MP operates in parallel with the other two. I/O control processors manage the data exchange. Triple I/O bus systems connect the trident systems. The MPs use I/O data in the memory for the voting process. Feature and advantages of TMR are as follows:
• No single point of failure
• Comprehensive diagnostics
• Very high safety integrity
• High availability
• Low maintenance cost
• Online repair
• Simple programming
• 2oo4: This is a typical configuration used in nuclear power plants. A typical configuration of the same has been shown in Fig. VII/1.4.4-1.
..................Content has been hidden....................
You can't read the all page of ebook, please click here login for view all page.