Heavy Metals and Recycling of Bottom Ash
Abstract
Determination methods and contents of total heavy metals, speciation analysis, heavy metals contents in different particle sizes, leaching toxicity, acid neutralizing capacity (ANC), leaching behavior with different sizes and leaching time, environmental safety evaluation system are fully provided. Treatment of livestock wastewater using a bottom ash (BA) bioreactor is described, and the different separation pretreatment technologies of BA are presented. Fe, Al, Zn, Cu, Ba, Pb, Cr, As, Ni, Co, Be, and Hg, together with precious metals and nonferrous metals, are present in the BA. However, both HVEP and TCLP tests demonstrate that the BAs have no toxicity at different leaching conditions. Moreover, the BAs have an ANC of 1.8–2.0 mol/kg and thus can resist the pH change and decrease the leachability. BAs possess a stable property and long-term safety when exposes to the environment. On the other hand, BA performs well for phosphorus removal in organic wastewater via adsorption and chemical reactions with a bioreactor which shows excellent capacity of phosphorous and COD removal. Meanwhile, nitrification for wastewater is also reliable with appropriate hydraulic load and wet–dry ratio. Moreover, different separation pretreatment technologies, such as mechanical separation, magnetic separation, crushing, wet treatment process etc. must be adopted prior to the resource recovery of BA with different intentions.
Keywords
Bottom ash; heavy metals; leaching toxicity; bottom ash bioreactor; livestock wastewater; separation pretreatment technologies
3.1 Source Trace of Heavy Metals
Nearly all the components in municipal solid wastes contain heavy metals, more or less, as given in Table 3.1.
Table 3.1
Source Trace of Heavy Metals in Municipal Solid Wastes
| Number | Heavy Metal | Main Sources |
| 1 | Pb | Paint, plastic (stabilizer), newspaper, wood, fabric, rubber, batteries, and alloys |
| 2 | Cr | Stainless steel, paper, plastic, weeds, wood, fabric, heel |
| 3 | Cd | Paint, batteries, stabilizers/softener, newspapers, plastic, weeds |
| 4 | Hg | Batteries, thermometers, electronic components, and newspapers and magazines |
| 5 | Cu | Paper, fabric, wood, plastic |
| 6 | Zn | Galvanized material, biological yeast |
| 7 | Ni | Stainless steel and nickel–cadmium batteries |
Municipal solid wastes can be classified as flammable and nonflammable components. The heavy metals in flammable components have two forms: A mineral mixed with organic matters and organic compound that metals act as the core. However, no matter which form, the containing heavy metals would be released when organic matters burned in the incinerator, and chemical reaction occurred. One of the chemical reactions is the chlorine release from the burning process of organic compounds, and another one is the reduction reaction incurred in reducing atmosphere at high temperatures. Although the incinerator is running with excess air, the reducing atmosphere exists in almost all incinerators, and metal compounds generated in such an atmosphere are more volatile. Different heavy metals in incineration bottom ash (BA), fly ash (FA), and flue gas have different concentration distribution. For the heavy metals in the nonflammable fractions, most of them enter into the BA. Hence, the heavy metals present in the wastes would experience the stages of the evaporation of volatile compounds, chemical reaction, entrainment, and elutriation of particles, condensation of metallic vapor, coagulation of particles, sedimentation of metallic vapor and particles, and particles trapping. Finally, they would be discharged in the form of BA, FA, and flue gas.
Taking the BA and FA generated in municipal solid waste incineration plant A (as shown in chapter: Characterization and Recycling of Bottom Ash) as a case, the heavy metals distribution in the BA and FA are presented in Table 3.2. The heavy metals could be divided into three categories according to their volatility in the incineration conditions. (1) Highly volatile metals such as Cd and Hg. Most of them (80%) were volatile into the incineration gas and trapped by FA, and only about 20% staying in BA. (2) Moderately volatile metals such as Zn and Pb. In general, they can achieve an even distribution between FA and BA. (3) Nonvolatile metals such as Fe, Al, Cu, Cr, and Ni. Most of them (90%) stayed in the BA due to their low volatility.
Table 3.2
Estimated Calculation Results of Heavy Metal Distribution in Bottom Ash and Fly Ash
| Elements | Bottom Ash | Fly Ash | ||
| Content (mg/kg) | Estimated Distribution (%) | Content (mg/kg) | Estimated Distribution (%) | |
| Fe | 42,243 | 90.2 | 18,356 | 9.8 |
| Al | 35,282 | 84.2 | 26,492 | 15.8 |
| Zn | 3250 | 60.6 | 8455 | 39.4 |
| Cu | 1350 | 90.1 | 596 | 9.9 |
| Ba | 1309 | 81.9 | 1157 | 18.1 |
| Pb | 568 | 45.6 | 2705 | 54.4 |
| Cr | 476 | 86.3 | 302 | 13.7 |
| Ni | 226 | 93.1 | 66.8 | 6.9 |
| Co | 69 | 92.6 | 22.2 | 7.4 |
| Cd | 4 | 21.8 | 57.3 | 78.2 |
| Hg | 1.58 | 19.4 | 26.29 | 80.6 |
| Be | 1.94 | 79.8 | 1.97 | 20.2 |

3.2 Determination of Total Heavy Metals Contents in Bottom Ash
The crystal lattice must be destroyed completely during quantifying heavy metals in solid samples, so that all the elements can be totally digested into the solutions for the determinations by Inductively Coupled Plasma Optical Emission Spectrometry (ICP-OES). The digestion can be classified into acid digestion and alkali digestion. The hydrofluoric acid must be used in the acid digestion for its unique capacity of dissolving silica dioxide and silicate. Generally, the digestion system of HNO3–HClO4–HF, HCl–HClO4–HF, (aqua regia) –HClO4–HF or (athwart aqua fortis) –HClO4–HF is applied. While the alkali fusion can destroy the crystal lattice in the solid samples with a quick operation and no vapor production, alkaline fusion methods such as Na2O2–NaOH, Na2O2–Na2CO3, KHSO4–K2S2O7 may be used.
The operation of conventional acid digestion is very complicated. The Teflon crucibles are heated on the heating plate for digestion and various concentrated acid are added in proper order. Furthermore, the digestion would take so many times and produce plenty of acid vapor. Microwave digestion is a common technique used by researchers to dissolve heavy metals in the presence of organic molecules. The technique is usually accomplished by exposing a sample to a strong acid in a closed Teflon vessel and raising the pressure and temperature through microwave irradiation.
Several acids combinations were used for the acid digestion to dissolve the elements in BA. Weigh 0.2500 g BA, add to the Teflon vessels. Drop a little water to wet the sample, then add acids as required, shake the vessels and mix thoroughly, and then heat using microwave. Best digestion must have a capacity to destroy the crystal lattice completely, so that the elements can be all dissolved in the solution. In general, as for the majority of heavy metals, Method (HCl/HNO3/HF/H2O2), Method (HCl/HNO3/HF), and Method (HNO3/HF/H2O2) are suitable for the best digestions of BA. The hydrofluoric acid, with unique capacity of dissolving silicon dioxide and silicate, can be used. The metallic elements exist mainly in form of metal, oxide, sulfate, chromate, aluminate, and silicate in the BA and may be dissolved with strong acid digestion.
The optimum digestion method of BA from municipal solid waste incinerator was determined as HCl/HNO3/HF/H2O2 for Pb, Cd, Cr, Ni, Cu, and Co, and HCl/HNO3/HF for As, Zn, Fe, and Al.
3.3 Contents of Heavy Metals in Bottom Ash
The samples, from bottom ash A (BA-A) (2 mm sieve), bottom ash B (BA-B) (2 mm sieve), fly ash A (FA-A), and fly ash B (FA-B), were digested with the optimum methods. The contents of heavy metals, except mercury, were measured by ICP-OES. Since mercury can volatilize very easily, its content was quantified by Chinese Standard: Soil Quality-Determination of Total Mercury-Cold Atomic Absorption Spectrophotometry (GB/T 17136-1997). The results are presented in Table 3.3.
Table 3.3
Contents of Heavy Metals in the Bottom Ash (BA) and Fly Ash (FA) (mg/kg)
| Elements | BA-A | BA-B | FA-A | FA-B | Volcanic Rock |
| Fe | 42,243 | 27,429 | 18,356 | 7478 | |
| Al | 35,282 | 36,237 | 26,492 | 8527 | |
| Zn | 3250 | 2906 | 8455 | 6928 | 70 |
| Cu | 1350 | 739 | 596 | 464 | 30 |
| Ba | 1309 | 1238 | 1157 | 1248 | |
| Pb | 568 | 1070 | 2705 | 1820 | 15 |
| Cr | 476 | 257 | 302 | 172 | |
| As | 241 | 389 | 9.47 | 31.37 | |
| Ni | 226 | 91 | 66.8 | 34.5 | |
| Co | 69 | 27 | 22.2 | 18.8 | |
| Cd | 4 | 17 | 57.3 | 61.6 | 0.2 |
| Hg | 1.58 | 1.30 | 26.29 | 23.33 | 0.08 |
| Be | 1.94 | 1.19 | 1.97 | 1.60 |

It can be seen that Fe, Al, Zn, Cu, Ba, Pb, Cr, As, Ni, Co, Be, and Hg were present in the BA, with the highest Fe of 42,243 mg/kg and the lowest Hg of 1.58 mg/kg. The contents of Al, Fe, Cu, Ni, and Cr in the BA were obviously higher than those in the FA, while the contents of Cd, Hg were in reverse. Moreover, the contents of heavy metals in the BA were much higher than those in the volcanic rock so that some countries regulated that the BA should be treated as hazardous wastes and be landfilled without recycling.
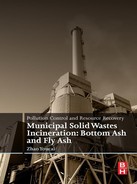
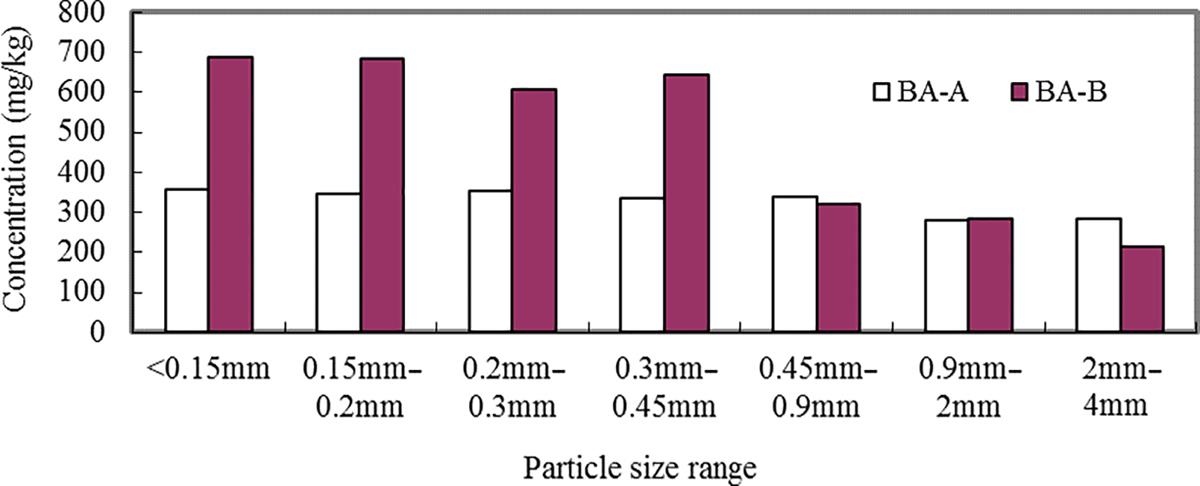
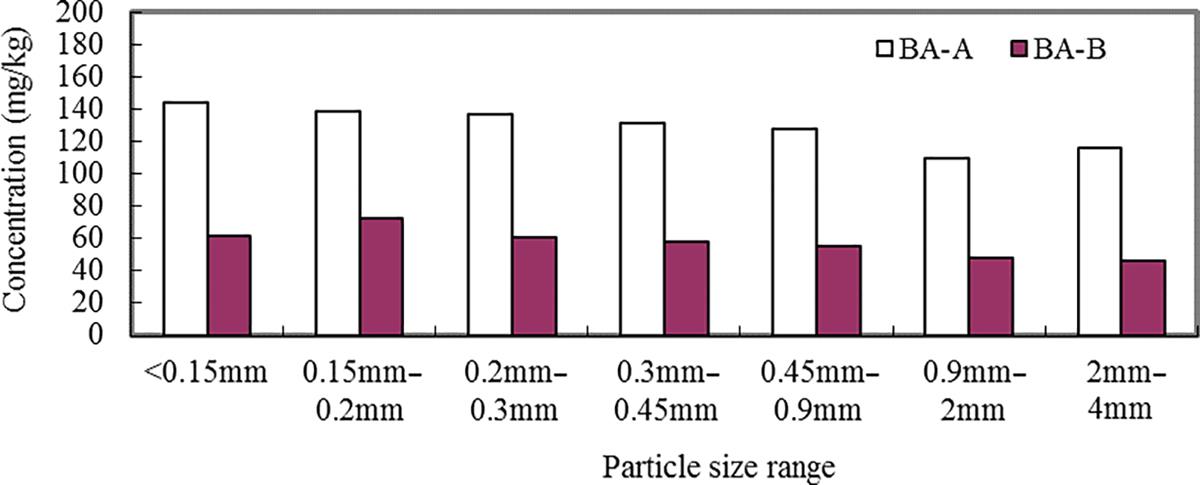
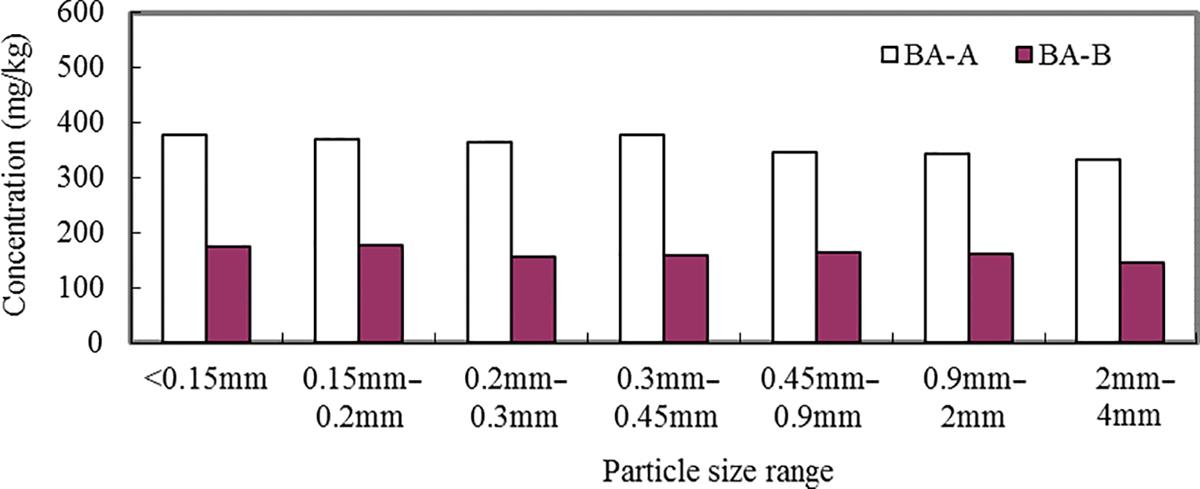
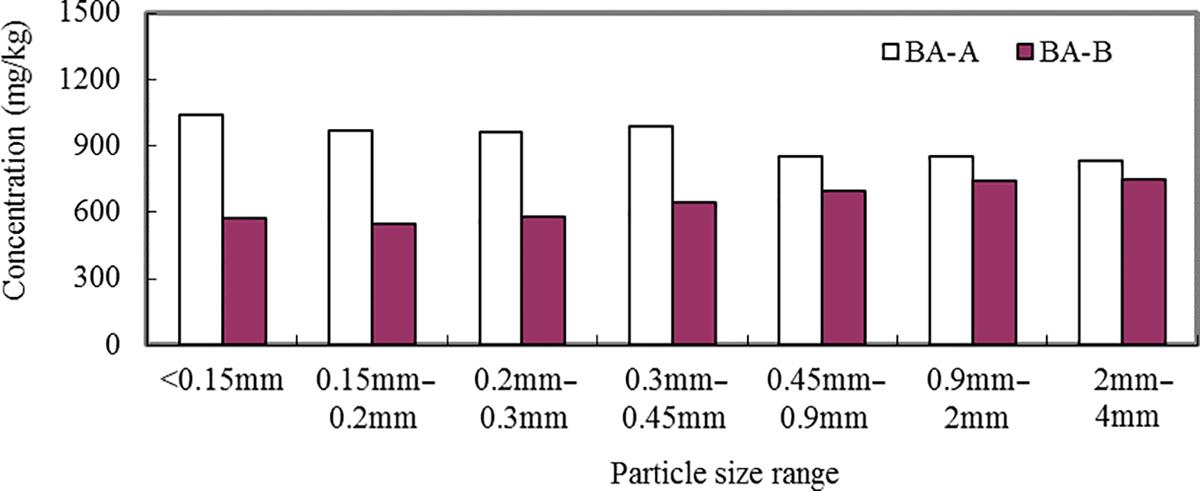
3.4 Heavy Metals Contents and Speciation Analysis in Different Particle Sizes of Bottom Ash
Different particle sizes of the BA-A and BA-B were digested by HCl/HNO3/HF/H2O2 method and Zn, Pb, Cu, As, Cd, Ni, Ba, Cr, and be were analyzed using ICP-OES. The results are presented in Figs. 3.1–3.9. It can be seen that the contents of Zn, Cu, As, Pb, Cd, Ni, Ba, Cr, and be in two BAs increased with the decrease of the particle sizes.


The chemical forms of heavy metal in the BAs were determined and the results are given in Table 3.4 and Fig. 3.10. It can be seen that the ion exchange state content of Cd in FA was 12.7% while the ion exchange state contents of Zn, Pb, Ni, Ba, Cr, and Cu were all below 5%, indicating that the BA was very stable in electrolyte or weak acid medium. When they are disposed of in a landfill, the leaching of heavy metals leached may be fairly low.
Table 3.4
Chemical Forms of Heavy Metals in Bottom Ash
| Heavy Metal | Bottom Ash | Fly Ash | ||
| A | B | A | B | |
| (1) Exchange Phase (mg/kg) | ||||
| Zn | 7.65 | 4.67 | 11.9 | 0 |
| Pb | 0 | 0.99 | 9.11 | 16.8 |
| Cd | 0 | 0.10 | 4.46 | 0.20 |
| Ni | 0 | 0 | 0 | 0 |
| Ba | 57.4 | 72.6 | 26.9 | 73.3 |
| Cr | 9.20 | 4.38 | 6.24 | 3.68 |
| Cu | 5.40 | 25.0 | 0.59 | 0 |
| (2) Carbonate Phase (mg/kg) | ||||
| Zn | 992 | 1138 | 2191 | 1221 |
| Pb | 123 | 274 | 1256 | 830 |
| Cd | 1.80 | 3.98 | 30.1 | 33.6 |
| Ni | 6.80 | 5.57 | 6.74 | 2.39 |
| Ba | 25.6 | 37.2 | 16.4 | 39.0 |
| Cr | 24.9 | 18.3 | 29.5 | 19.3 |
| Cu | 192 | 134 | 295 | 196 |
| (3) Iron–Manganese Oxide Phase (mg/kg) | ||||
| Zn | 363 | 250 | 274 | 405 |
| Pb | 44.5 | 57.7 | 61.9 | 65.1 |
| Cd | 0.25 | 0.50 | 0.50 | 2.49 |
| Ni | 20.3 | 7.96 | 1.49 | 0.50 |
| Ba | 18.5 | 21.38 | 1.98 | 6.96 |
| Cr | 16.3 | 9.45 | 6.44 | 3.98 |
| Cu | 20.3 | 7.96 | 8.92 | 5.97 |
| (4) Organic Phase (mg/kg) | ||||
| Zn | 34.5 | 57.7 | 33.7 | 25.9 |
| Pb | 0 | 0 | 8.92 | 6.96 |
| Cd | 0 | 0 | 0 | 0 |
| Ni | 15.0 | 5.97 | 2.97 | 1.99 |
| Ba | 66.0 | 67.6 | 59.4 | 63.6 |
| Cr | 5.50 | 3.98 | 2.97 | 1.99 |
| Cu | 210 | 99.4 | 25.8 | 36.8 |
| (5) Residual Phase (mg/kg) | ||||
| Zn | 1700 | 1317 | 1179 | 2125 |
| Pb | 328 | 76.2 | 364 | 622 |
| Cd | 8.75 | 4.73 | 0 | 0 |
| Ni | 169 | 110 | 60.7 | 129 |
| Ba | 2168 | 2285 | 1729 | 3233 |
| Cr | 569 | 316 | 358 | 661 |
| Cu | 476 | 559 | 228 | 386 |
| Amount of Heavy Metals by Tessier Sequential Extraction Procedure (mg/kg) | ||||
| Zn | 3096 | 2768 | 3690 | 3777 |
| Pb | 496 | 409 | 1700 | 1541 |
| Cd | 10.8 | 9.3 | 35.1 | 36.3 |
| Ni | 211 | 130 | 77.9 | 134 |
| Ba | 2335 | 2484 | 1833 | 3416 |
| Cr | 625 | 352 | 403 | 690 |
| Cu | 904 | 926 | 558 | 625 |
| Percentage of Active State (%) | ||||
| Zn | 44.0 | 50.3 | 67.1 | 43.1 |
| Pb | 33.8 | 81.3 | 78.1 | 59.2 |
| Cd | 19.0 | 49.2 | 99.9 | 99.9 |
| Ni | 12.8 | 10.4 | 11.4 | 2.2 |
| Ba | 4.3 | 5.3 | 2.5 | 3.5 |
| Cr | 8.1 | 9.1 | 10.5 | 3.9 |
| Cu | 24.1 | 18.0 | 54.5 | 32.4 |

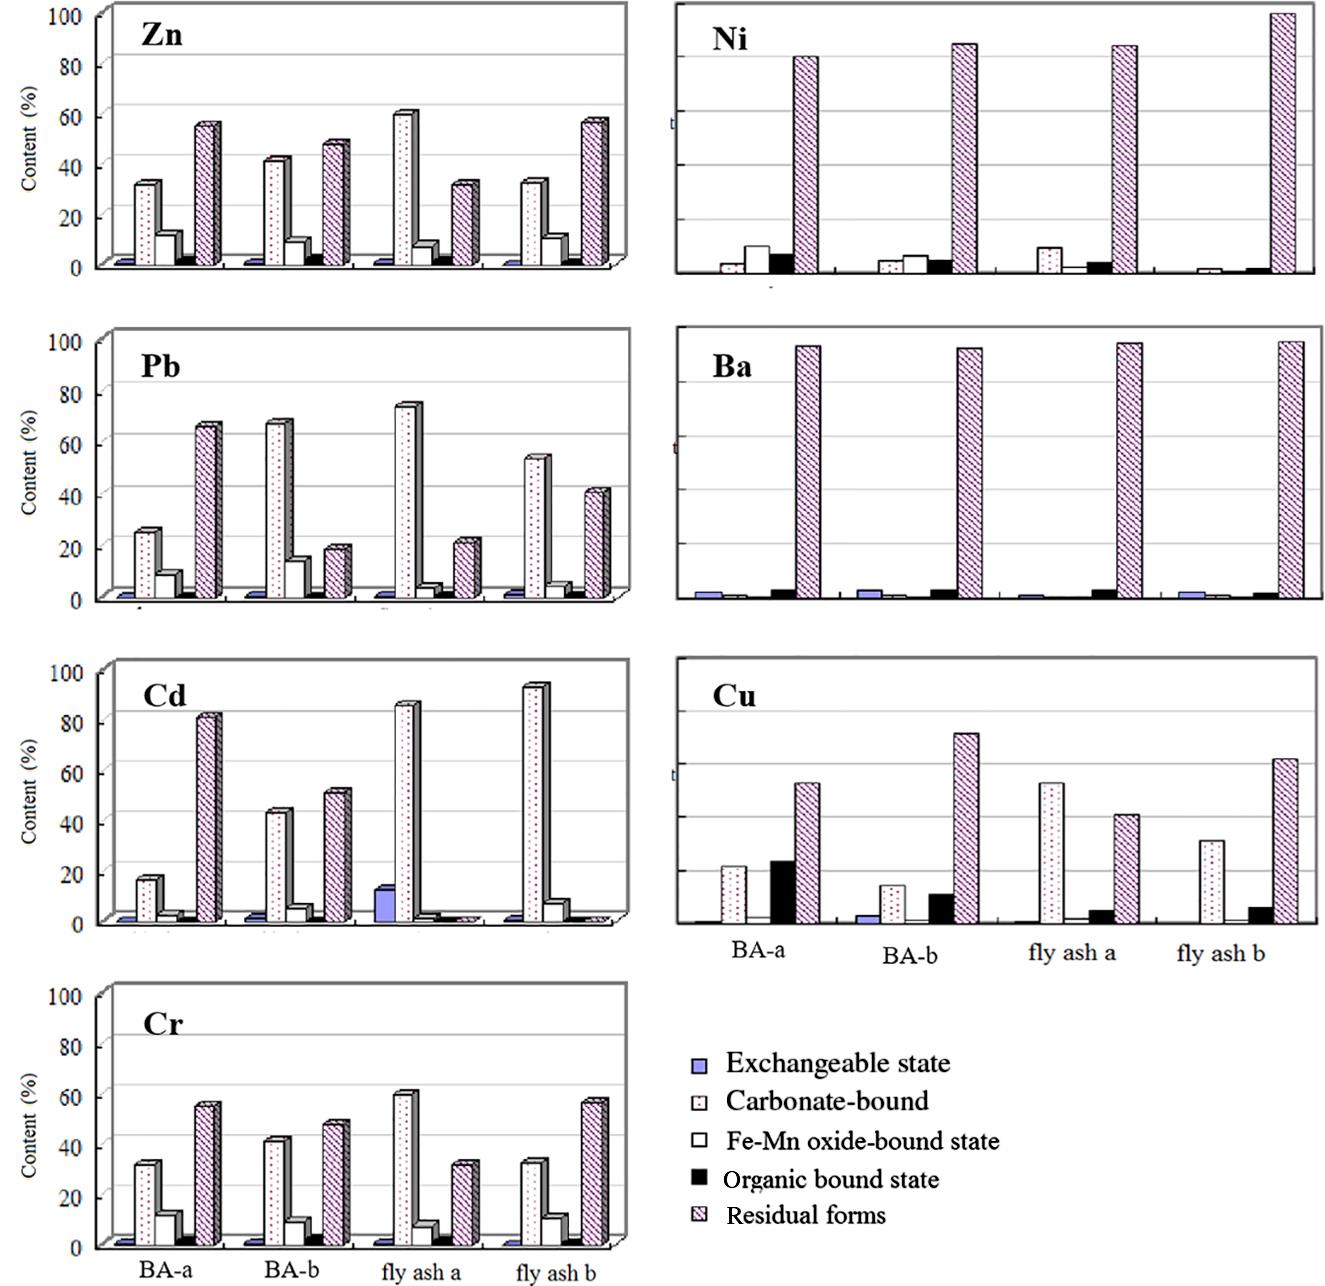
The heavy metals in BA exist mainly in carbonate bound form, especially Zn, Pb, Cd, and Cu, occupied around 32.0–41.1, 24.9–67.0, 16.7–42.8, and 21.3–14.4%, for BAs A and B, respectively.
The carbonate bound state content of Zn existed in FA A of 59.4% and in FA B of 32.3%, and Pb in FA A of 73.9% and in FA B of 53.9%, with that of Cd of 85.9 and 92.6%, respectively. The heavy metals in carbonate bound state are sensitive to environmental conditions, especially pH values. When the pH drops, they are easily rereleased into the environment. On the other hand, the increase of pH value facilitated the co-precipitation of heavy metal elements on carbonate minerals.
Iron and manganese oxides commonly existed as wrapped mineral and fine loose particles. High activity of Fe–Mn oxides possess a high specific surface and are easy to adsorb or coprecipitate anions and cations. The changes of environmental pH and redox conditions have significant impact on Fe–Mn oxide bound state.
Zn is mainly in residual form and carbonate bound form in BA and FA, with few in Fe–Mn oxides. Pb mainly exists in residual form and carbonate bound form, with few in Fe–Mn oxides. However, Pb mainly exists in carbonate bound form in FA, with over 50–70% followed by residual form. Cd is mainly in residual form and carbonate bound form in BA, but mainly in carbonate bound form in FA, with over 85.9–92.6%. Ni, Ba, Cu, and Cr mainly exist in residual form in both bottom and FAs.
3.5 Leaching Toxicity of Heavy Metals in Bottom Ash
Currently, a variety of leaching toxicity test methods has been developed for detecting the leaching toxicity of solid wastes, which is summarized in Table 3.5. In this work, the leaching toxicity with toxicity characteristic leaching procedure (TCLP) and horizontal vibration extraction procedure (HVEP) was performed, respectively, in order to confirm the results.
Table 3.5
Summary of Toxicity Leaching Methods Used in the World
| Experiment | Sample Requirements | Lixiviant | L/S (mL/g) | Mixing Tools | Leaching Time and Temperature | Filtration Method |
USA TCLP |
<9.5 mm100 g | pH = 4.93 Acetic acid buffer solution pH = 2.88 Acetic acid buffer solution |
20:1 | Rolling-over (30 r/min) | 18 h20–40°C | 0.6–0.8 μm Borosilicate glass fiber membrane filter |
| Germany DEV-S4 | <4 mm100 g | Ion exchange water | 10:1 | Oscillator | 24 h18–25°C | 0.45 μm filter membrane |
| Netherlands NEN7341 | <4 mm100 g | pH = 7 ion exchange water, and then the pH adjustment with HNO3 to 4 | 100:1 | Stirring | 6 h20°C | 0.45 μm filter membrane |
| France X31-210 | <4 mm100 g | Softened water | 10:1 | Scroll or vibration | 16 h18–25°C | 0.45 μm filter membrane |
| Japan | <5 mm>50 g | pH adjustment with HCl or NaCl to 5.8–6.3 | 10:1 | Horizontal Vibration (200 r/min, amplitude 40–50 mm) | 6 h20°C | 1 μm FR-PPR |
| Switzerland TVA | No specific requirement 100–200 g | The CO2 saturated water | 10:1 | With 100 mL/min for | 24 h20°C | 0.45 μm filter membrane |
| China HVEP | <5 mm100 g | Deionized water or equivalent purity of distilled water | 10:1 | Horizontal reciprocating vibration (110/min, amplitude 40 mm) | 8 h20°C | Speed filter paper |

The metal leaching concentrations of BA-A and BA-B were lower than the limit of GB “Identification standards for hazardous wastes-Identification for extraction toxicity” (Tables 3.6 and 3.7). What’s more, the contents of Zn, Pb, Cd can’t be detected out. Hence, the BA can be classified as a general waste, other than a hazardous waste, though the leaching concentrations of Cr (0.103 mg/L), As (0.047 mg/L) and Hg (0.00128 mg/L) may be present.
Table 3.6
HVEP Heavy Metal Leaching Toxicity of Bottom Ash and Fly Ash of Waste Incineration
| Sample | As | Zn | Pb | Cd | Ni | Cr | Cu | Hg |
| BA-A | 0.019 | n.d. | n.d. | n.d. | 0.002 | 0.103 | 0.151 | 0.00062 |
| BA-B | 0.047 | n.d. | n.d. | n.d. | 0.021 | 0.063 | 1.451 | 0.00128 |
| FA-A | 0.006 | 0.691 | 5.110 | 0.001 | 0.001 | 0.246 | n.d. | 0.00921 |
| FA-B | 0.027 | 3.057 | 7.469 | 0.001 | 0.001 | 0.398 | n.d. | 0.01254 |
| Standard limit | 1.5 | 50 | 3 | 0.3 | 10 | 10 | 50 | 0.05 |

Table 3.7
TCLP Heavy Metal Leaching Toxicity of Bottom Ash and Fly Ash of Waste Incineration
| Sample | As | Zn | Pb | Cd | Ni | Cr | Cu | Hg |
| BA-A | 0.003 | 9.022 | 0.021 | 0.003 | 0.034 | 0.039 | 0.346 | n.d. |
| BA-B | 0.012 | 3.901 | 0.005 | 0.114 | 0.031 | 0.038 | 0.787 | n.d. |
| FA-A | 0.026 | 43.145 | 5.192 | 1.004 | 0.080 | 0.057 | 1.589 | 0.00383 |
| FA-B | 0.020 | 51.007 | 7.462 | 1.152 | n.d. | 0.130 | 0.368 | 0.00045 |
| Standard limit | 5 | / | 5 | 1 | / | 5 | / | 0.2 |

The leaching concentrations of Pb of 5.110 and 7.469 mg/L in two FAs exceed the permissible standard of 3 mg/L, and the FA is thus classified as a hazardous waste and should be solidified or stabilized before being disposed of at security landfills.
3.6 Acid Neutralizing Capacity of Bottom Ash
Acid neutralization capacity (ANC) derived from the concept of soil acidification, often represents the acidity of soil solution. ANC leaching test is a process that can reflect the leaching behavior of harmful components under different pH conditions, and ascertain the ability of acidic waste material erosion resistance, the conditions, and the impact of solid phase stability on pH values. The ANC of ashes is very meaningful to evaluate the resistant ability to the acidic environment in the disposal and resource utilization processes.
A total of 5 g BA-A and BA-B (2 mm) were weighed and then added into 100 mL conical flask. Followed by adding 50 mL of nitric acid solutions with different concentrations [liquid to solid (L/S) ratio of 10:1] up to 2 mol/L. The reaction stops after shaking 48 h and the pH values were determined after centrifugation.
The relationship between the final leachate pH of BAs and the amount of acid is shown in Fig. 3.11. When the addition of acid is 0, the pH of BA-A and B were 9.6 and 11.06, respectively. The pH variation of leaching solution can be divided into four stages. (1) pH of the leaching solutions substantially unchanged when the amount of acid was less than 1 mol/kg; (2) pH of the leaching solution decreased sharply when the amount of acid was between 1 mol/kg and 4 mol/kg; (3) pH decreased slowly when the amount of acid was between 4 mol/kg and 5 mol/kg; and (4) pH decreased sharply when the amount of acid was greater than 5 mol/kg. The main reactions occur in first stage is as follows:

With the addition of acid, OH− is ionized from Ca(OH)2 continually and the pH maintains constant. With the dissolution of Ca(OH)2, MgO, and CaO in BAs begin to dissolve, but not for Al2O3. pH of leaching solutions decrease sharply when Ca(OH)2, MgO, and CaO reduce significantly. With the amount of acid continue to increase, Al2O3 begins to dissolve, which leads to a change in pH, while the leachate shows a buffering capacity. Finally, the pH decreases significantly when Al2O3 dissolves completely. Thus the pH of leachate is mainly decided by the dissolution of the calcium and aluminum substances in the BAs.
As can be seen from Fig. 3.11, the ANC7.5 were 2 mol/kg of BA-A and 1.8 mol/kg of BA-B, respectively, which showed a strong acid buffering capacity and the increasing resistance to change of pH.
The concentrations of heavy metals of leachate collected from the ANC experiments were measured. The leaching experiments of BA-A and BA-B (sample, 5 g and the particle size 2 mm) were operated under the same conditions with ANC test (L/S ratio of 10:1, leaching time 48 h), with leachate pH of 11.07, 12.10, 12.99 and 13.90, respectively. The results are shown in Fig. 3.12.
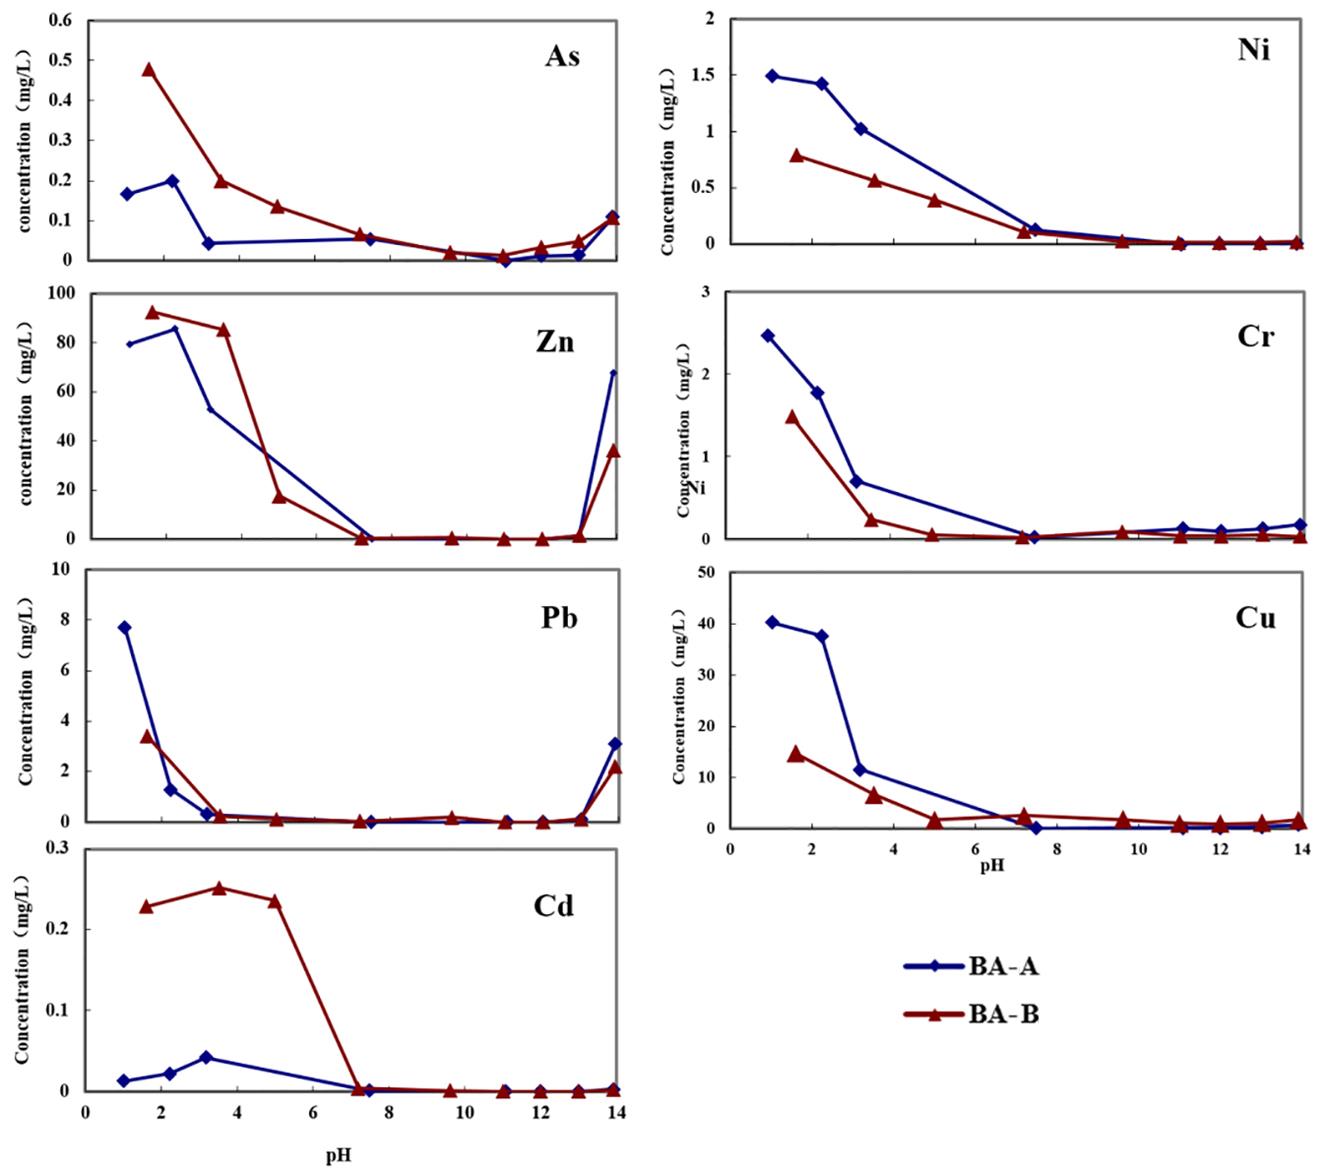
The pH value is an important factor affecting the leaching behavior of heavy metals. In alkaline and neutral conditions, hardly few were leached and acidic conditions were obviously the favorable leaching condition as the leaching concentrations increased considerably with the decrease of pH values.
The differences of leaching behavior were determined by the nature of heavy metals. The water-soluble chlorides were first leached and metal oxide dissolved gradually with the increasing of the acidity which resulted in increased concentrations of metals in the solution. Take Pb and Cd as examples.
When the pH value of the solution turned alkaline, leaching concentrations were downward due to the precipitation reaction between metal ions and OH−. With the increase of OH−, the precipitation dissolved due to the amphoteric properties of both Pb and Zn.
3.7 Leaching Behavior of Bottom Ash with Different Sizes and Leaching Time
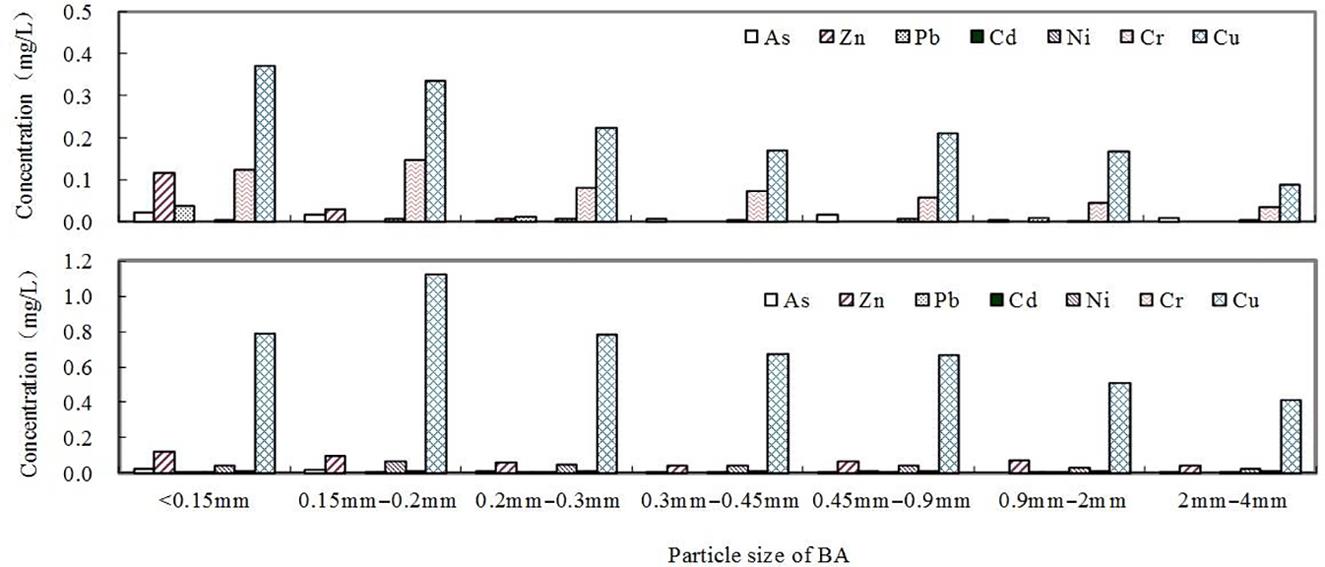
TCLP tests were conducted for the BAs with various sizes and the results are given in Fig. 3.13. The leaching concentrations were inversely proportional to ash sizes, especially Cu and Zn.
Another experiment was performed to research the effect of leaching time. The results are shown in Fig. 3.14. Zn, Pb, and Cd were not marked in figure as they were below the detectable limits. As, Ni, Cr, and Cu were detected in the leaching solutions, and their concentrations increased with leaching time. Although the concentrations increased rapidly and much more slowly after 8 h, it is worth noting that the concentrations of heavy metals were still far below the leaching toxicity identification standards.

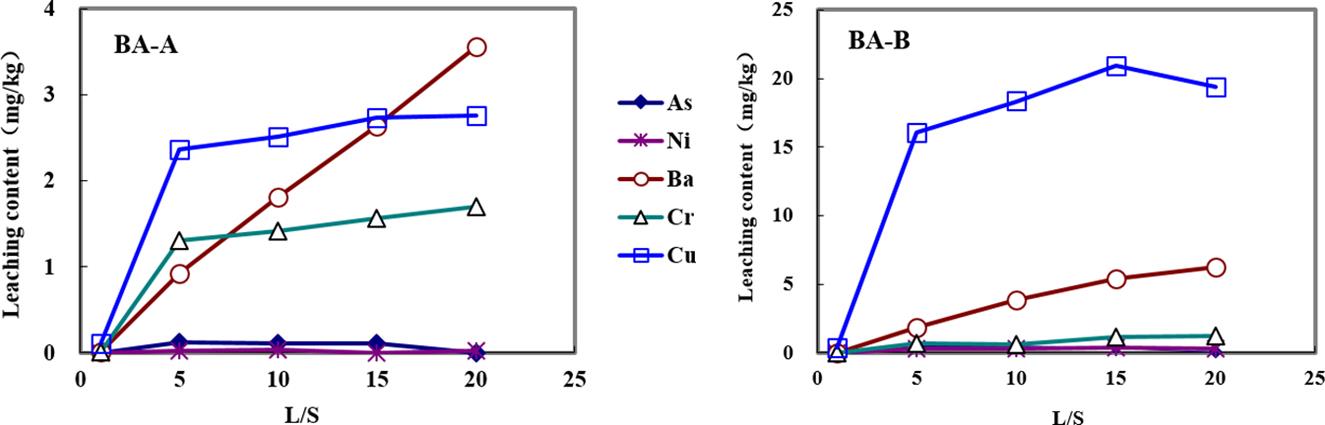
Effect of L/S ratio using Standard Method for Solid Waste Leaching Toxicity is shown in Fig. 3.15. Some HMs like Zn, Pb, and Cd still did not detect but the leaching amount of As, Ni, Ba, Cr, and Cu increased with the increase of L/S. A large concentration gradient could promote the effect of diffusive mass transfer which finally had a better leaching rate. Meanwhile, high alkalinity of BA-B inhibited the effect because high alkalinity reduced the dissolution of HMs.
A similar experiment was performed to study the effect of temperature (Fig. 3.16). As temperatures increased, the leaching amount of As, Zn, Ba, Cr, and Cu increased as a result of the facilitation of Brownian motion. Many factors affect the leaching of heavy metals in BA, mainly including the natural properties of solid particles (like size, specific surface area and mineral constituent), the chemical types, concentrations and pH of leaching agent, leaching time, L/S and mixing ways.

3.8 Environmental Safety Evaluation System of Bottom Ash
As summarized in Fig. 3.17, an environmental safety evaluation system of BA may be described. BA had a high content of Zn, Cu, Pb, As, and Cr, while exchangeable fractions were quite low with lower release risks. At the same time, Zn, Pb, and Cd showed instability to some extent as they mainly existed with the carbonate bound and residual forms which may be dangerous exposed to the acid rain environment.

Both HVEP and TCLP tests demonstrated that the BAs had no toxicity at different leaching conditions. Moreover, the BAs had an ANC of 1.8–2.0 mol/kg and thus can resist the pH change and decrease the leachability. It can be concluded that the BAs possess a stable property and long-term safety when exposes to the environment.
3.9 Treatment of Livestock Wastewater Using a Bottom Ash Bioreactor
The BA from incineration has a large specific surface, high porosity and a large amount of aluminosilicate salts, making this material potential as biological filler for bioreactor. Moreover, the BA performs well for phosphorus removal in wastewater via adsorption and chemical reactions. However, when BA applied to treat the organic wastewater, the role of microorganism could not be neglected due to the biological uptake. In this work, a fixed-bed bioreactor consisted of porous BA for livestock wastewater treatment was conducted.
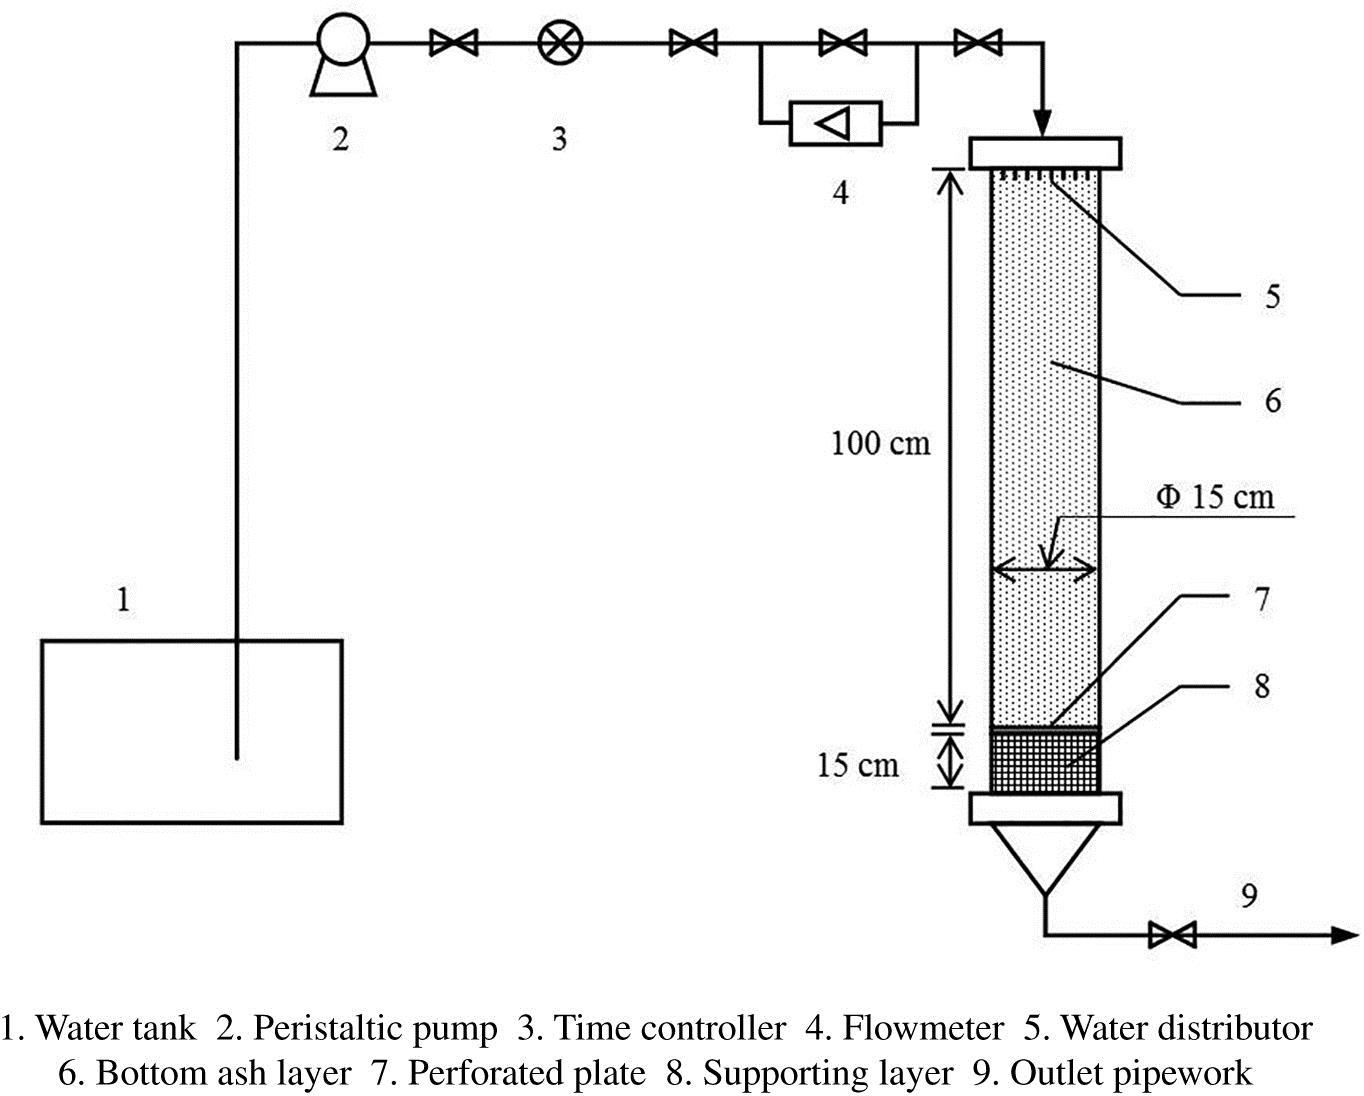
A cylinder filled by BA and gravel consisted of packing layer, supporting layer, distribution system, and drainage system was made (Fig. 3.18). The sample outlets were set on different height as well as gravel was situated below the BA as a supporting layer. The perforated plate was applied to ensure the uniformity of water-distribution. The livestock wastewater was pumped into the reactor from the top and flowed through the BA with a low speed.
BA with a size below 4 mm was chosen for this study. Before the experiment started, distilled water washing for the whole system was performed, and the outflow of leached solutions had a high content of chemical oxygen demand (COD) and reached stabilized in almost 5 d.
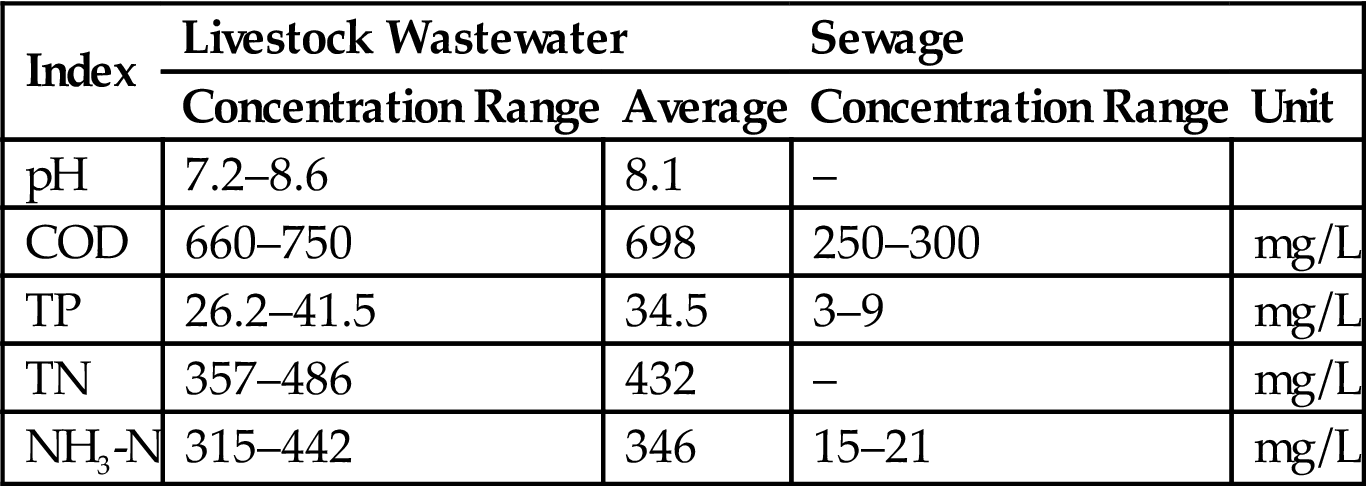
The livestock wastewater was flushing water from a dairy farm in Shanghai, China. The sewage and activated sludge were from Quyang sewage treatment plant in Shanghai. The quality of wastewater is shown in Table 3.8.
Table 3.8
The Quality of Livestock Wastewater Used
| Index | Livestock Wastewater | Sewage | ||
| Concentration Range | Average | Concentration Range | Unit | |
| pH | 7.2–8.6 | 8.1 | – | |
| COD | 660–750 | 698 | 250–300 | mg/L |
| TP | 26.2–41.5 | 34.5 | 3–9 | mg/L |
| TN | 357–486 | 432 | – | mg/L |
| NH3-N | 315–442 | 346 | 15–21 | mg/L |
3.9.1 Microbial Cultivation and Acclimation in Bioreactor
All microorganisms was vanished since the BA was generated in incinerator with high temperature of 800–1200°C. For a biodegradation of livestock wastewater by BA, the proportion of livestock at the influent gradually increased to cultivate the microbes in bioreactor and facilitated microbes to adapt to the final organics’ load (Table 3.9 and Fig. 3.19). Finally, over 75% COD removal were achieved. It was noted that the duration of cultivation and acclimation processes was longer than general methods because the microbes were totally destroyed in incinerator and more time for microbes to acclimate within the ‘clean’ carriers were required.


3.9.2 Operation of Bottom Ash Bioreactor
The shapes of BA from municipal solid waste incinerator presented as honeycomb with irregular shape, and those particles with various-sized holes were composed of several inorganic mineral substrates. Once the reactor started to accept wastewater, the particles in reactor bed would have some position shift, then redistributed in reactor bed. The bed would have higher bulk density, and lower porosity. Finally, the bioreactor would reach to a relative balance phase. Meanwhile, the organics removal in BA bioreactor was composed of adsorption and decomposition processes, and most of organics were just remained in BA fillings instead of being totally decomposed.
Based on the two facts described above, the bioreactor should suspend the influent of livestock wastewater after a certain period of time to dry and wet the bioreactor bed. At the same time, microbes had more time to decompose the accumulated organics in reactor bed. Obviously, there existed a balance between the organics’ accumulation and decomposing, thus a period of idle time of reactor bed would truly benefit to the organics’ decomposition ability of microbes.
Hence, this BA bioreactor belongs to one kind of nature purification system with honeycombed particles. The slag bioreactor has the same operation mode with general purification systems, i.e., artificial soil filter bed, biological sand filter bed, natural soil quickly infiltration treatment system, which is the alternate operation of influent and dry and wet in the bioreactor beds.
The ratio of the time of influent introduction and dry bed was marked as the ratio of wet and dry (W/D), named as R. The operation cycle depended on the duration time of influent and dry bed, and the function relation is showed as Eq. (3.1). Obviously, under the premise of the constant R, the operation cycle was in proportion to the influent introduction time.
(3.1)
With stable operation under different conditions, the influent time, the ratio of W/D will be evaluated for the effects on organics removal efficiency and nitrogen and phosphorus removal in livestock wastewater.
The experiments were operated under nine groups of trials with different influent time as well as the ratio of W/D in bioreactors. In order to ensure reliable data, each set of operating conditions at least steady running more than 2 weeks, and the results obtained in the steady state were used for calculation for the average value. The influent rate of each group was maintained as 0.094 cm/min, i.e., 1 L/h.
3.9.3 Removal of COD from Wastewater Under Different Conditions
The removal rate of COD of livestock wastewater in bioreactor under different operation conditions is shown in Table 3.10. Removal of COD decreased with an increase of W/D ratio and influent duration at a W/D ratio, with a COD removal from 76.3 to 92.5%. Under the conditions of 8 h influent duration and 1:5 W/D ratio, 8 h influent duration and 1:8 W/D ratio, and 6 h influent duration and 1:5 W/D ratio, the COD concentration of effluents were lower than 100 mg/L. The optimum effluent quality can be obtained at 4 h influent duration and the 1:11 W/D ratio.
Table 3.10
COD Removals at Different Running Conditions at Bottom Ash Bioreactor
| Water Supply Time (h) | Wet-To-Dry Ratio | Water Inflow (L) | Influent Concentration (mg/L) | Effluent Concentration (mg/L) | Removal Rate (%) |
| 4 | 1:11 | 4 | 712 | 53 | 92.5 |
| 1:8 | 4 | 687 | 66 | 90.4 | |
| 1:5 | 4 | 692 | 86 | 87.5 | |
| 6 | 1:11 | 6 | 734 | 72 | 90.2 |
| 1:8 | 6 | 703 | 95 | 86.5 | |
| 1:5 | 6 | 721 | 131 | 81.8 | |
| 8 | 1:11 | 8 | 702 | 74 | 89.4 |
| 1:8 | 8 | 694 | 119 | 82.9 | |
| 1:5 | 8 | 741 | 176 | 76.3 |

This system showed a poor performance in TN removal, at only 16.7–26.7% (Tables 3.11 and 3.12). However, the BA Bioreactor system had a good removal effect on the NH3-N by transforming it into nitrate-N and nitrite-N, making the removal rate range from 68.8 to 98.5%.
Table 3.11
TN Removals at Different Running Conditions in Bottom Ash Bioreactor
| Water Supply Time (h) | L/S | Water Inflow (L) | Influent Concentration (mg/L) | Effluent Concentration (mg/L) | Removal Rate (%) |
| 4 | 1:11 | 4 | 412 | 343 | 16.7 |
| 1:8 | 4 | 415 | 318 | 23.4 | |
| 1:5 | 4 | 393 | 293 | 25.5 | |
| 6 | 1:11 | 6 | 374 | 309 | 17.5 |
| 1:8 | 6 | 398 | 303 | 23.8 | |
| 1:5 | 6 | 406 | 299 | 26.4 | |
| 8 | 1:11 | 8 | 387 | 322 | 18.7 |
| 1:8 | 8 | 406 | 307 | 24.4 | |
| 1:5 | 8 | 381 | 279 | 26.8 |
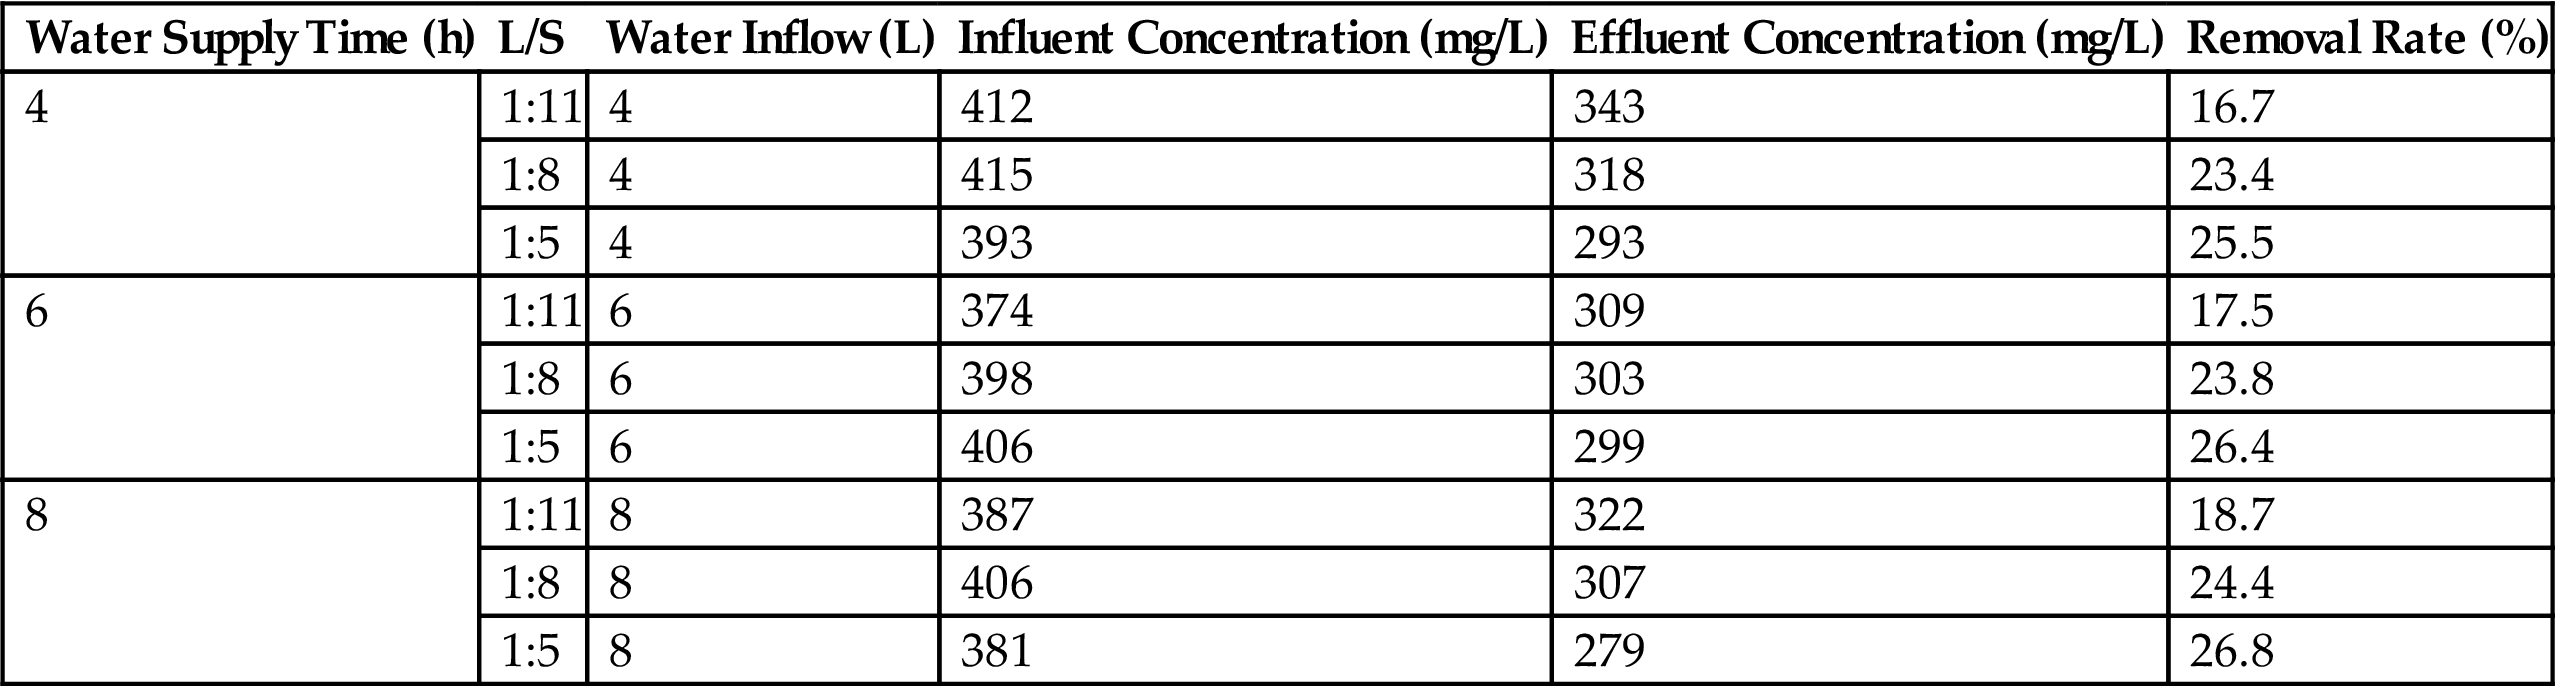
Table 3.12
NH3-N Removal at Different Running Conditions at Bottom Ash Bioreactor
| Wastewater Supply Time (h) | L/S | Wastewater Inflow (L) | Influent Concentration (mg/L) | Effluent Concentration (mg/L) | Removal Rate (%) |
| 4 | 1:11 | 4 | 341 | 5.1 | 98.5 |
| 1:8 | 4 | 335 | 14.1 | 95.8 | |
| 1:5 | 4 | 308 | 22.2 | 92.8 | |
| 6 | 1:11 | 6 | 336 | 16.5 | 95.1 |
| 1:8 | 6 | 327 | 27.1 | 91.7 | |
| 1:5 | 6 | 321 | 34.7 | 89.2 | |
| 8 | 1:11 | 8 | 328 | 47.2 | 85.6 |
| 1:8 | 8 | 319 | 69.2 | 78.3 | |
| 1:5 | 8 | 304 | 94.8 | 68.8 |
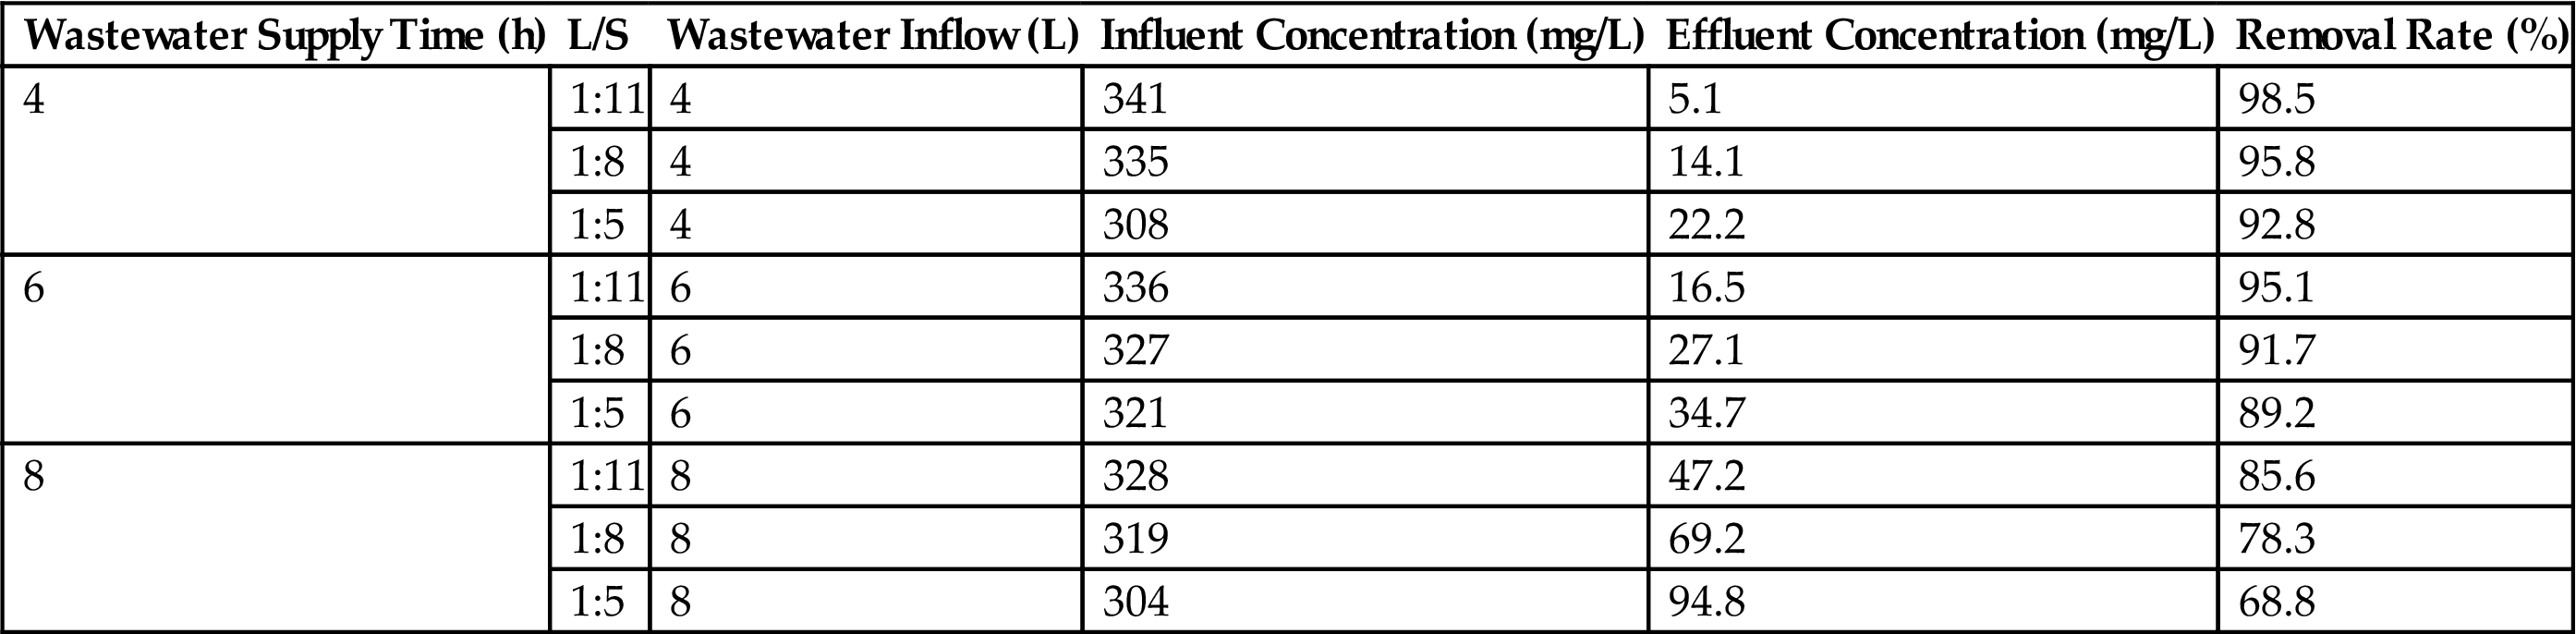
Conventional biological removal of nitrogen involves two processes, nitrification and denitrification. During the wastewater supply for the system, NH3-N was transferred to solid phase from liquid phase through ionic-exchange and physical adsorption. Once the wastewater supply was stopped, the nitrification reaction occurred in the presence of nitrobacteria and dissolved oxygen. Sequentially, the denitrification reactions happened on the next circle of wastewater supply with the anoxic environments, making NO3−-N and NO2−-N from nitrification reaction utilized by denitrifying bacteria. The best performance can be got for TN removal under the condition of the 8-h wastewater supply interval and 1:5 W/D ratio, while the optimum condition was 4-h wastewater supply intervals and 1:11 W/D for NH3-N removal.
3.9.4 TP Removal from Wastewater Under Different Conditions
Total Phosphorus (TP) removal under a variety of operating conditions is shown in Table 3.13. It can be seen that the bioreactor had a distinctive ability to remove TP, depending on the functions of BA fillers such as adsorption, chemical conversion, and microbe assimilation. The phosphorus accumulated in the reactor by adsorption and chemical conversion can be used to synthesize cellular materials by microbe under aerobic conditions while being released under anaerobic conditions. A shorter wastewater supply interval and lower W/D ratio can help maintain the aerobic environment and phosphorus absorption, and the best performance could be got for TP removal under the condition of 4-h wastewater supply and 1:5 W/D ratio, and an effluent concentrations below 1 mg P/L can be obtained.
Table 3.13
TP Removal at Different Running Conditions at Bottom Ash Bioreactor
| Water Supply Time (h) | L/S | Wastewater Inflow (L) | Influent Concentration (mg/L) | Effluent Concentration (mg/L) | Removal Rate (%) |
| 4 | 1:11 | 4 | 34.8 | 0.07 | 99.8 |
| 1:8 | 4 | 35.1 | 0.32 | 99.1 | |
| 1:5 | 4 | 32.8 | 0.46 | 98.6 | |
| 6 | 1:11 | 6 | 36.7 | 0.37 | 99.0 |
| 1:8 | 6 | 34.1 | 0.44 | 98.7 | |
| 1:5 | 6 | 32.2 | 0.55 | 98.3 | |
| 8 | 1:11 | 8 | 35.1 | 0.28 | 99.2 |
| 1:8 | 8 | 36.9 | 0.44 | 98.8 | |
| 1:5 | 8 | 30.8 | 0.74 | 97.6 |

3.9.5 Hydraulic Loading Rate of Bioreactor
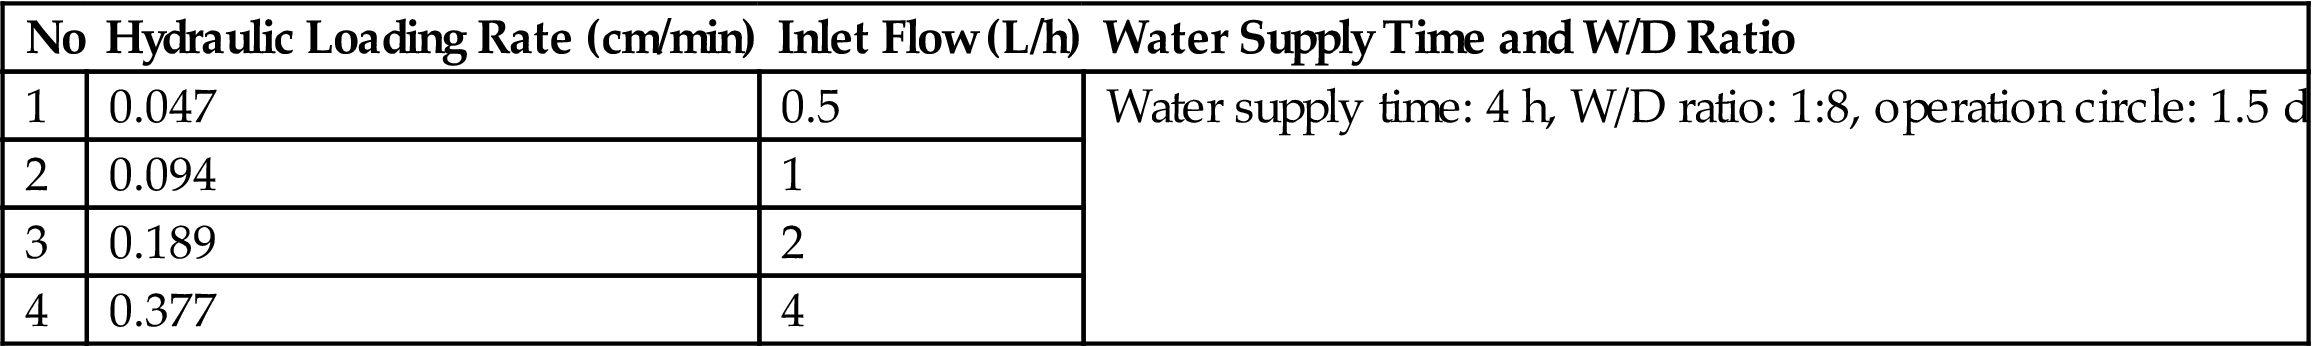
The hydraulic loading (or hydraulic loading rate) means the amount of wastewater that can be treated by the reaction bed per unit area per day in units of m3/m2 d. The hydraulic loading rate is an important indicator for system design. The test was carried out with optimum wastewater allocation 4 h wastewater supply interval and 1:8 W/D ratio. The BA bioreactor was run at different hydraulic loads so as to obtain the appropriate results, as listed in Table 3.14.
Table 3.14
Test Scheme for Choosing the Hydraulic Loading Rate of Bottom Ash Bioreactor
| No | Hydraulic Loading Rate (cm/min) | Inlet Flow (L/h) | Water Supply Time and W/D Ratio |
| 1 | 0.047 | 0.5 | Water supply time: 4 h, W/D ratio: 1:8, operation circle: 1.5 d |
| 2 | 0.094 | 1 | |
| 3 | 0.189 | 2 | |
| 4 | 0.377 | 4 |
The results are presented at Tables 3.15–3.17. The removal rates of COD, NH3-N were gradually decreased with increasing hydraulic load. In order to control the water quality reaching II-class criteria specified in Integrated Wastewater Discharge Standard, the maximum hydraulic load was set at 0.254 cm/min (2 L/h of influent). Consequently, the removal efficiency of COD, NH3-N, and TP were 85.2, 94.2, and 98.6%, respectively.
Table 3.15
Impact of Hydraulic Loading Rate on COD Removals in Bottom Ash Bioreactor
| No | Hydraulic Loading Rate (cm/min) | Influent Concentration (mg/L) | Effluent Concentration (mg/L) | Removal Rate (%) |
| 1 | 0.047 | 706 | 25 | 96.5 |
| 2 | 0.094 | 687 | 66 | 90.4 |
| 3 | 0.189 | 733 | 86 | 85.2 |
| 4 | 0.377 | 692 | 176 | 62.5 |

Table 3.16
Impact of Hydraulic Loading Rate on NH3-N Removal in Bottom Ash Bioreactor
| No | Hydraulic Loading Rate (cm/min) | Influent Concentration (mg/L) | Effluent Concentration (mg/L) | Removal Rate (%) |
| 1 | 0.047 | 374 | 6.4 | 98.3 |
| 2 | 0.094 | 335 | 14.1 | 95.8 |
| 3 | 0.189 | 358 | 20.8 | 94.2 |
| 4 | 0.377 | 361 | 41.9 | 88.4 |
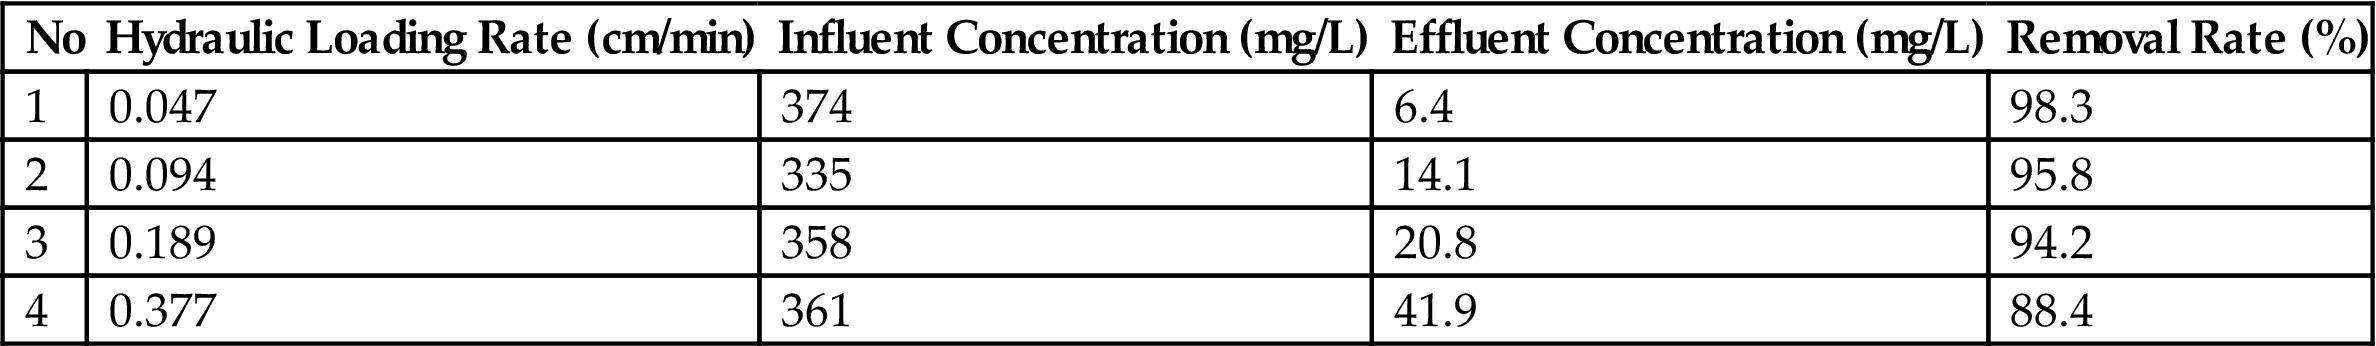
Table 3.17
Impact of Hydraulic Loading Rate for TP Removal in Bottom Ash Bioreactor
| No | Hydraulic Loading Rate (cm/min) | Influent Concentration (mg/L) | Effluent Concentration (mg/L) | Removal Rate (%) |
| 1 | 0.047 | 33.4 | 0.27 | 99.2 |
| 2 | 0.094 | 35.1 | 0.32 | 99.1 |
| 3 | 0.189 | 29.6 | 0.41 | 98.6 |
| 4 | 0.377 | 30.7 | 0.46 | 98.5 |

Adsorption and biodegradation are the main mechanism for contaminants removal, and the biodegradation process predominates. The BA bioreactor is of excellent capacity of phosphorous removal, and COD removal is pretty effective. Meanwhile, nitrification for wastewater is also reliable with appropriate hydraulic load and W/D ratio. Basically, contaminant removal of the bioreactor can be simplified to two stages: Rapid physical and chemical adsorption, slow biodegradation, corresponding to wastewater introduction and drying, respectively.
3.10 Different Separation Pretreatment Technologies of Bottom Ash from Municipal Solid Waste Incineration
As an important kind of resource with the potential of environmental pollution, the BA has been widely concerned. Researches and engineering practices have proved that it is feasible to reuse the resource of BA. However, technical requirements still exist, since there are many impurities in BA. Therefore, different separation pretreatment technologies, such as mechanical separation, magnetic separation, crushing, wet treatment process etc. must be adopted prior to the resource recovery of BA with different intentions.
3.10.1 Mechanical Separation of Bottom Ash
One of the main purposes of mechanical separation of BA is to separate and collect the recyclable wastes or those against recycling for utilization and disposal, respectively. For example, those scrap metals including steel, iron, aluminum, and copper can be recycled, while those incombustible wastes such as ceramic pieces and glasses can be transported to the landfills for disposal.
The introduction of technological process is based on a waste incineration power plant in Foshan city, Guangdong province, China. The designed municipal solid waste (MSW) disposal capacity is 700 t/day, with the BA production of 140–210 t/day. A series of technologies including crushing, sieving, and sorting are applied and good results are obtained. The amount of separated wastes for scrap metal and MSW residue is 4–5 and 40–50 t, respectively, and the rest are BA. The BA has a stable characteristic and uniform size distribution, which can meet the standard for utilization. The process flow diagram of mechanical separation of BA of municipal solid waste incinerator is shown in Fig. 3.20.
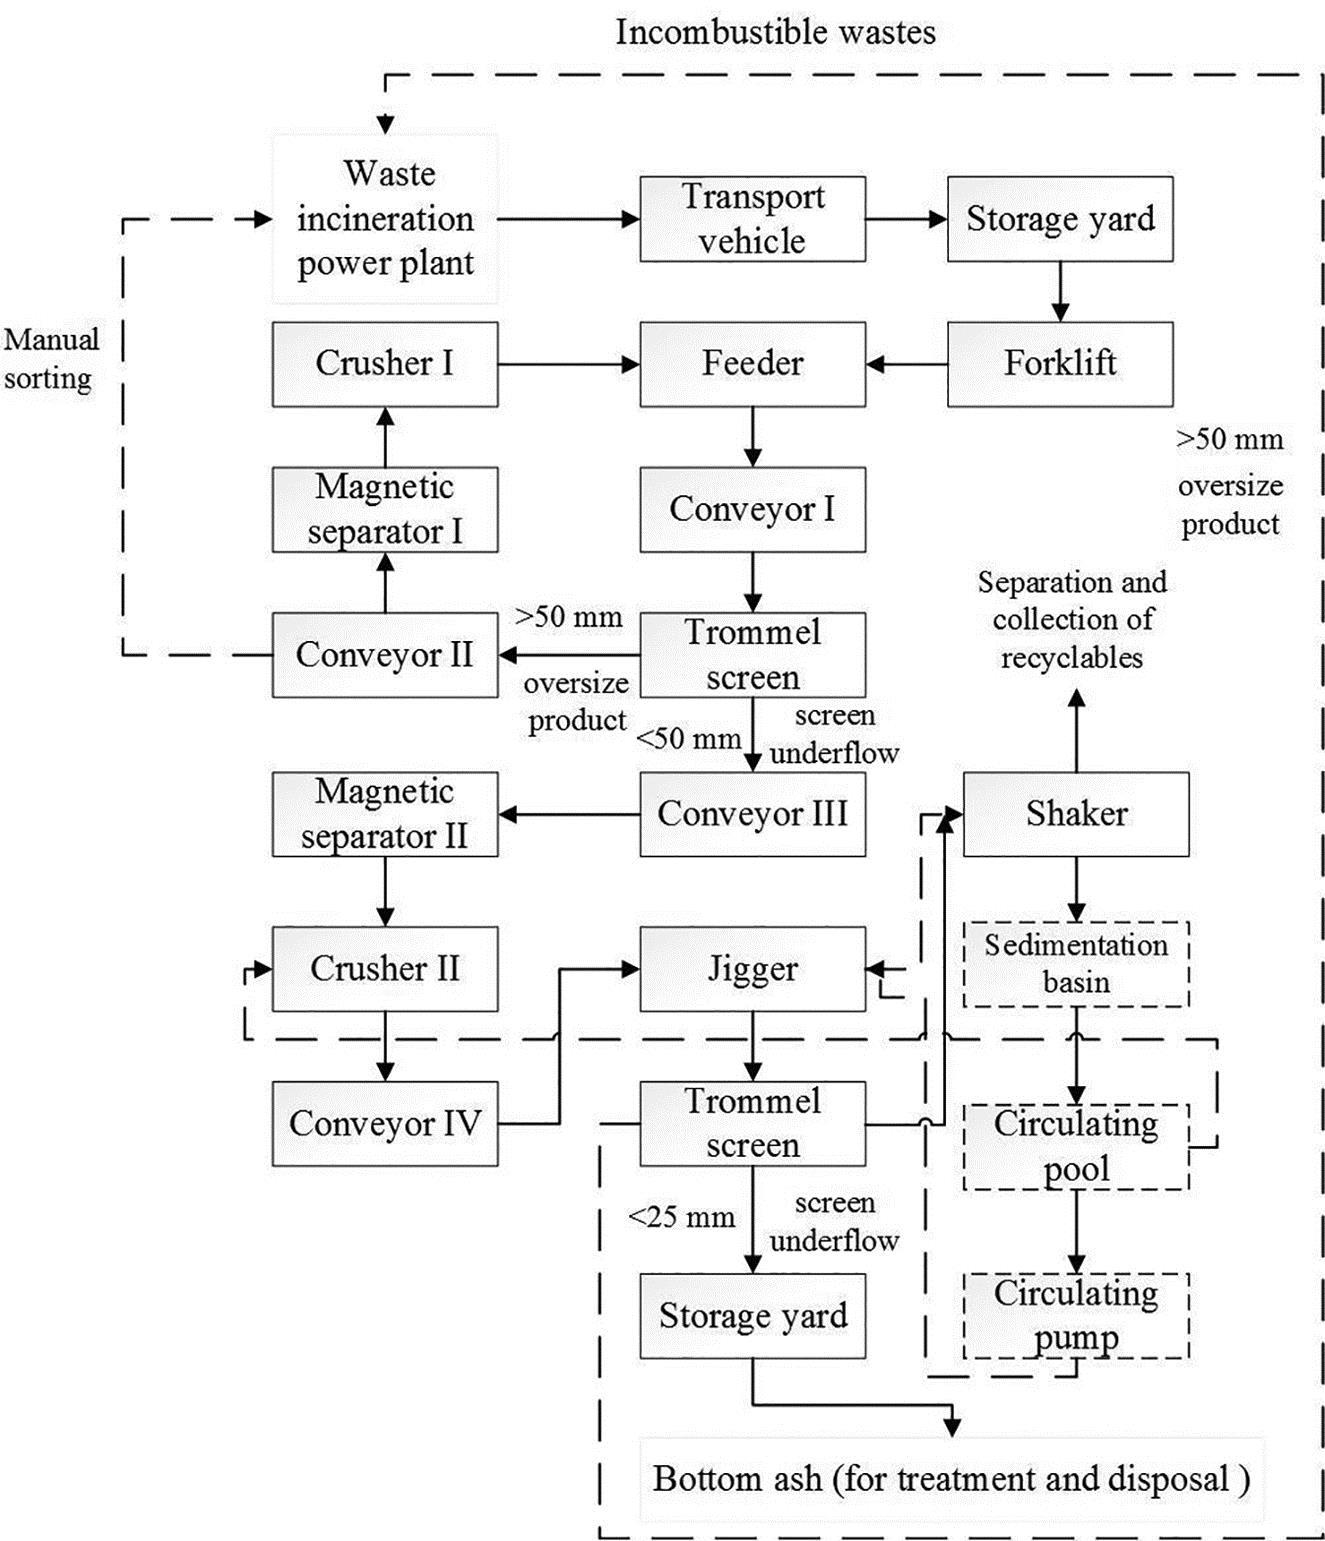
BA generated from municipal solid waste incinerator is transported by transport vehicles to the storage yard before mechanical separation. The BA will be deposited in the yard for 2–3 d, where the moisture content can be removed and the BA can be dried primarily. With the size of 150×150 mm, the coarse mesh in feeder machine can entrap the bulky waste from the BA. Then the BA drops into trommel screen with the size of 50 mm. For those residue size more than 50 mm, which mainly are stone, slag, and iron, etc., are treated separately. For example, stones, and slags are conveyed to crusher machine. Meanwhile, the textiles and plastics can be sorted manually during the conveying process, and irons can be separated by magnetic separator for the first time. For residue size less than 50 mm, before flowing into the jigger machine under the action of water, the waste are separated and crushed by magnetic separator and crusher machine, respectively. In the jigger machine, with the action of aqueous medium, nonferrous metal particle groups and BA particle groups are separated due to the difference of density. Then the shaker machine can separate the heavy recyclables such as aluminum and copper. Meanwhile, the light products flow into the trommel screen with the size of 25 mm, then the oversize products including textiles and plastics and the uniform-sized BA are separated.
The equipment in mechanical separation process of BA mainly consist of trommel screens with different size, belt conveyors, crushing machines, magnetic machine, jigger machine, shakers, circulating water pumps, cleaning agitators, and different vehicles.
3.10.2 Magnetic Separation and Reselection of Iron Resources from Recycling Bottom Ash
The major components of BA are FeO, Fe2O3, Fe3O4, etc. The iron materials can be recycled through sorting or magnetic separation, and the high grade iron ore can be used as the raw materials for steel production. Therefore, it is of great significance to recycle iron resources form in BA in order to reduce pollution and maximize the utilization of resources. Magnetic separation of iron from BA is significantly influenced by the crushing particle size. It is showed that the recovery rate of metal iron is increased with the decrease of crushing particle size, when the machine crushing process is applied to treat BA. For instance, the recovery rate of metal iron were 6.4, 7.6, and 15% when the crushing particle size were 300–100, 100–80, and 70–25 mm, respectively.
In China, amount of BA is presented with waste incineration, of which the iron compound should be separated and recycled in view of sustainable development and environmental protection. Currently, the magnetic separation process, which has the advantages of high efficiency and low cost, is applied widely to the recovery of iron compound in BA. The process flow diagram of magnetic separation of iron compound is shown in Fig. 3.21.
1. Magnetization roasting
In magnetic separation process, the BA should be magnetized reduction roasting firstly. The magnetized reduction roasting process can change the magnetism of iron material from weak to strong at a certain temperature in reducing atmosphere, which will bring weak magnet separator to a broader field. The reductant mainly includes carbon, coal, CO, and other reducing gas. The reactions are shown as follows:
Many parameters such as reductant dosage, temperature, time particle size of iron ore and the cooling methods may affect the separation efficiency by influencing the magnetism of product. The hematite will fail to transform to magnetite fully in the cases of lower temperature, bigger granularity of iron ore or short of reductant. However, too much reductant, excessive temperature or longer reaction time would lead to an over reduction.
2. Magnetic separation
The magnetic separation is a method which separates the magnetic materials on the basis of the magnitude of the different magnetism compounds. The magnetic separation efficiency is affected by magnetic field intensity. Generally, the stronger magnetic field intensity is, the higher efficiency it will be. However, the iron recovery will go down with the magnetic field intensity increase further. The reason for that phenomenon is that higher magnetic field intensity can bring some weak magnetic materials into products, which is detrimental to the performance of iron recovery.
Although the concentrate grade can improve to 40–50% through magnetic separation process, it still needs a further treatment to ensure a much higher grade of refined iron mine. For example, the high gradient magnetic separation machine with the performance of the high field strength (1.8–1.9 T) and high gradient, has been applied to the separation of hematite, limonite, and manganese ore, and the treatment capacity was 8–10 t/h.
3. Flotation separation
The purity of refined iron mine is still low after magnetized reduction roasting process so that a combined process technology is needed to improve the iron recovery. Flotation, also known as foam flotation, can separate materials on the basis of different surface physical chemical properties among materials. The floatability of materials depends on their affinity for water rather than their density.
Flotation reagents play an imperative role in the modern flotation process. The floatability of materials can be changed by flotation reagents so that materials can attach to bubbles selectively to meet the target of separation. Dodecylamine is used as capture reagent in inverse flotation process, and the operating rate can reach up to 60% or more through this process.
4. Gravity separation
The combination of gravity separation and magnetic separation becomes a popular technology in iron recycling from BA. Gravity separation, based on the density or particle size difference among various minerals, classifies minerals according to their density (or particle size) under mechanical force. The mixed concentrate from magnetic separation is ground finely and then enter into centrifugal concentrator with the reselection of 400 r/min and washing water of 2400 mL/min. Through above processes, the operating rate can reach up to 60%.
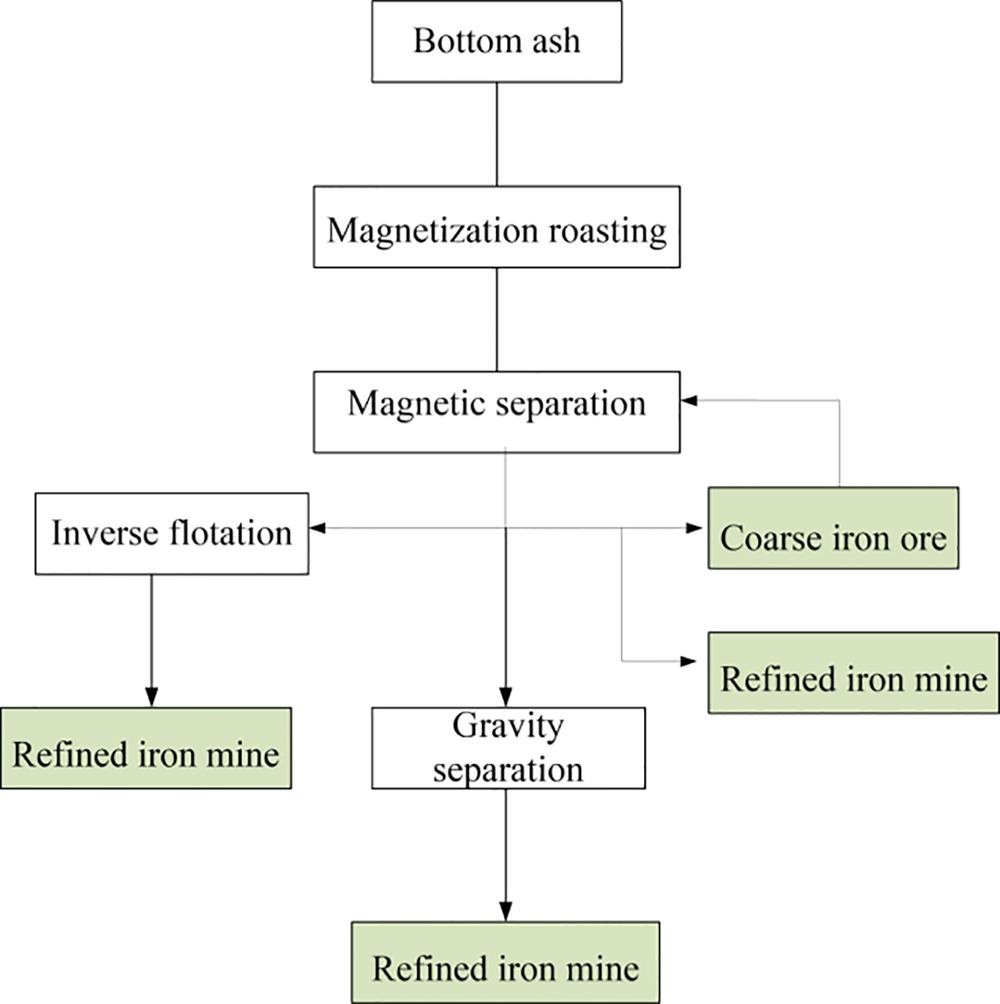
Generally, the BA should be classified into narrower ranges first in order to make sure that materials are separated strictly according to their density and to improve the recovery of iron.
3.10.3 Pretreatment and Procedure of Unburned Brick Production
Approximately 80% of the ash and slag are attributed to BA of MSW incineration process, and the main physical components of which are hard and of a certain strength. Because of the low content of organic matter and the good firmness of the BA, it meets the requirements of raw material for silicate brick production. Even though the BA contains some heavy metals, but according to the codes of China, it is still classified as a kind of general waste, and can be utilized as the main raw material for the production of unburned brick. For the lack of volcano activity, the cement, lime, gypsum, and chemical activator should be used as addition materials for producing bricks.
The equipment for producing unburned bricks can be classified into four categories of pretreatment equipment, mixing equipment, molding equipment, and curing equipment, including multilayer roller screen, square hole screen, crusher, magnetic separator, eddy current separator, ball mill, twin-shaft mixer, hydraulic brick-pressing machine, and sprayer.
Silicon–aluminum materials, mainly consisting of silica and alumina, are the raw material of the production of unburned and nonautoclaved brick. The main reaction in the producing process of unburned brick is as followed:
Calcium silicate crystallization is formed for the reaction between the silicon–aluminum materials and hydroxide calcium produced from cement hydration.
Manufacturing technology of unburned brick with BA of MSW incineration include different processes such as pretreatment, screening and crushing, metals separation, preparation of powder, pressing molding, first quality test, natural curing, second quality test, and degraded products reuse. The whole process is presented in Fig. 3.22.
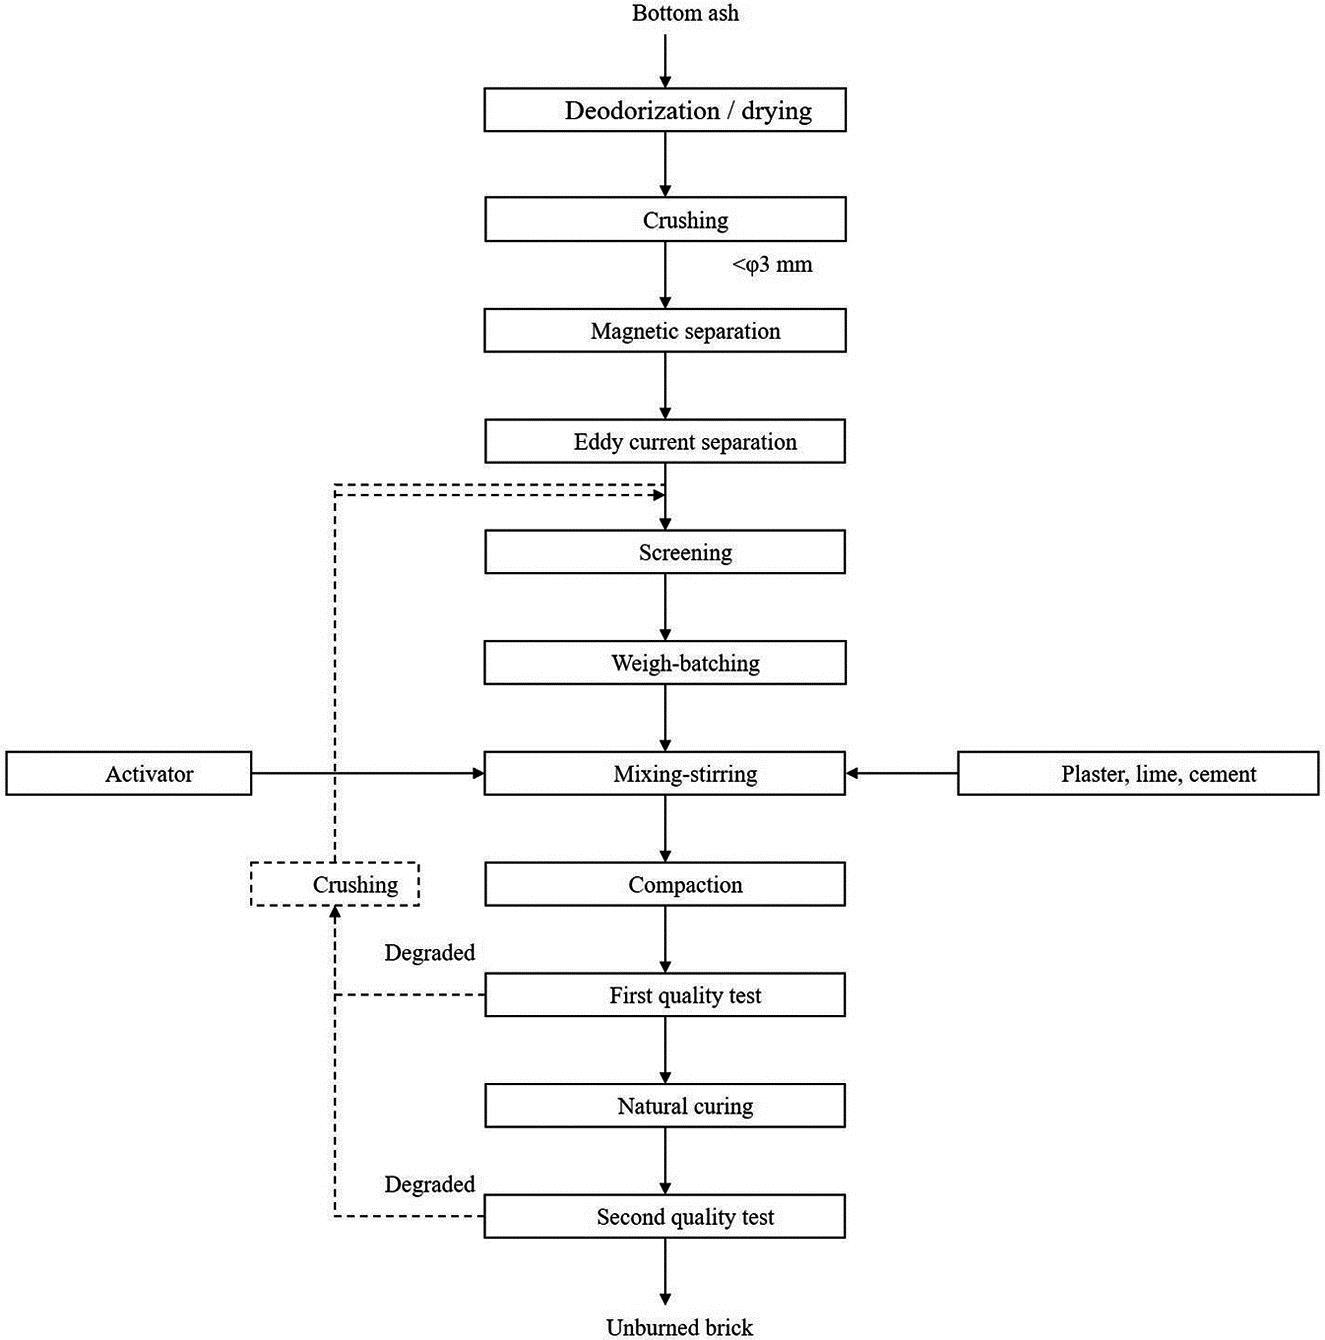
Due to water quenching, the moisture of BA is relative high and difficult to be broken. Furthermore, the wet BA stinks and must be dried and deodorized. Drying and deodorization are performed at the same time, and the foul smell of BA can be greatly reduced during the tile drying process. Then, the BA will be sifted through 3 mm sieve after the pretreatment, and the product with particle less than 3 mm will be reserved. After that, the BA is crushed by the crusher and ball mill, and magnetic separator and eddy current separator are used to separate the iron magnetic material and nonferrous metals from broken BA, respectively.
Next, the BA is screened to adjust the distribution of different particle sizes. The BA would be sifted over 0.15, 0.3, 0.6, and 1.18 cm sieves, respectively, and be mixed in a certain quality proportion, for instance, 0–0.15 cm accounts for 40%, 0.15–0.3 cm accounts for 30%, and 0.6–1.18 cm accounts for 30%. The BA, lime, and gypsum are added into the twin-shaft mixer according to a certain proportion, and then evenly mixed the mixture with the activator solution and cement together. During the mixing period, the water content should be controlled to be about 8–12%.
The power is prepared for compaction, and pressed by double-sides pressure using hydraulic machine. The process is completed through four stages and the pressure is about 17–23 MPa. In first stage, the preloading pressure is relative light and a portion of air is discharged. A heavy pressure is applied in the second stage, and discharging another portion of air. A final pressing is carried out in the third stage, and finally holding the pressure before the BA is molded.
The molded bricks would be tested to eliminate the degraded products and made a timely adjustment of the formula or the renovation of mold in order to reduce the consumption of raw materials and the wear and tear of machine. A sprinkling water natural curing process is needed when the molding products have a certain strength. Finally, the second quality test is carried out, graded products after curing would be on sale. While the degraded products, from first and second quality test, are crushed again to reproduce bricks.
3.10.4 Wet Treatment Process for the Recovery of Nonferrous Metals from Bottom Ash of MSW Incineration
In general, BA of MSW incineration contains economically significant levels of silver, gold, and other nonferrous metals (Table 3.18). Currently, the mineral fraction of BA can be reused as the secondary building and road material, and the nonferrous metals can be recycled by dry or wet treatment technologies. Conventional BA treatment is a dry separation process, which is always applied to recover the particles larger than 10–15 mm from the ash. The wet process can treat fine particles (down to 100 μm) to recover the nonferrous content from the BA using quantities of water.
Table 3.18
Content of Nonferrous Metals and Precious Metals Per Ton of Dry Bottom Ash
| Metal | Content (g/t Dry Bottom Ash) |
| Ag | 2.1–3.2 |
| Au | 0.1–0.2 |
| Cu | 800–950 |
| Pb | 250–480 |
| Zn | 5–15 |
As shown in Figure 3.23, the equipment in washing process of BA consists of control system, pretreatment system, water washing system, and separation system. Mostly, the BAs have large pieces of debris as well as some combustible contents. Those fractions of waste are useless for the recycle process and should be removed first by sending to the landfill or burning again. After a preliminary magnetic density separation (MDS), ferrous scrap can be obtained with some regular equipment. The residue from MDS continues to be crushed and the bulky parts are further removed through the wet screen where water dissolves some metal salts so that the recovery will be easily processed subsequently.

The heavy nonferrous metals are conveyed to jigging machine from the BA. The heavy particles, including metals and other fractions, are collected through pipeline. A shaking table equipped with a grit chamber is performed to separate the rest of heavy nonferrous metals. With these, almost all the metals get separated from the BA, as the aggregates can be utilized after dewatering.
Apart from water, the BA can also mixed with acid solution. Some metals like Cu and Zn are dissolved into the solution and separated from nonsoluble Pb by filtration. Then, Cu and Zn can precipitate by alkali or sulfide. By this treatment, lead and zinc cakes can be obtained. This process is similar with the hydrometallurgical method whereas the products rarely meet the high cost quality (Fig 3.23).
Both the dry and wet processes almost have the same recovery rate of ferrous metals. In China, little BA is recycled and treated by the wet process because the eddy current separation result is not good, especially for 0–5 mm copper, which has a high value in market. Therefore, the wet treatment process have a better profit if considering the product price and treatment cost (Table 3.19). Moreover, the wet process generates a great deal of wastewater and sludge, leading to the increase of operation cost for pollution control. To date, there still need some improvements and innovations for the implementation of recycling precious metals from BA.
Table 3.19
Economic Comparison Between the Dry and Wet Treatment Process
| Wet Process (%) | Dry Process (%) | Product Profit (RMB/t)a | |
| Metal content | 2.5–3.0 | 2.5–3.0 | |
| Recovering iron | 1.5–1.8 | 1.5–1.8 | 500 |
| Recovering copper | 0–0.01 | 0.2 | 12,500 |
| Recovering aluminum | 0.06–0.08 | 0–0.01 | 5500 |
| Residues | 80.0 | 60.0 | 15 |
| Profit (RMB/t) | 24.1 | 42.25 |
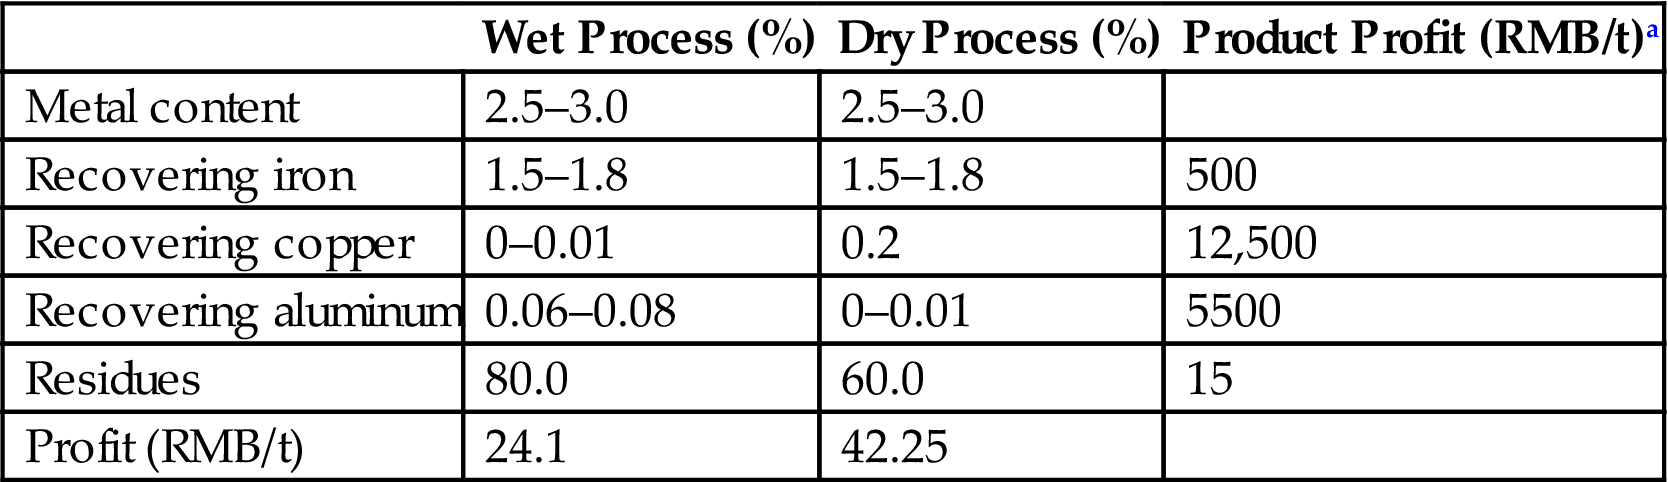
aThe prices of the metals are based on the grade and the market price.