Utilization of Fly Ash in Ceramic Brickmaking
Abstract
The effects of the use of red ceramic clay, gang sand, and feldspar on the utilization of MSWI fly ash in ceramic brickmaking are tested. An orthogonal test, analysis of ceramic brick performance based on R20 and R32 and analysis of performance variation of bricks based on R20 as a function of temperature, ceramic brick microstructure variation and transformation of phases, and a leaching toxicity analysis of bricks based on R20, are described. Different raw materials including red ceramic clay, gang sand and feldspar are utilized separately to make ceramic brick in order to cover the treatment cost of fly ash. The major chemical constituents of red ceramic clay, such as SiO2 and Al2O3, can react at high temperature to form a large quantity of mullite and silicates, and improve the plasticity of the ceramic body. Gang sand had a high SiO2 content level, and this was a major component of the ceramic body. It can react with Al2O3, forming mullite and thus improving the physical performance of the product. Feldspar is conducive to the reduction of the sintering temperature for ceramic brick. Based on intuition and variance analysis, MSWI fly ash is the decisive factor in terms of the appearance of ceramic brick, while the influence of feldspar and the sintering temperature are similarly important for red ceramic clay. So, bricks based on R20 are chosen to analyze performance variation, microstructure, and phase altering as functions of temperature.
Keywords
Fly ash; ceramic brick; ceramic clay; gang sand; feldspar; leaching toxicity
7.1 Ceramic Brickmaking Technique
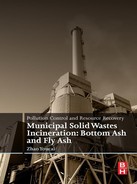
In this work, the use of untreated fly ash to make ceramic brick, aiming to reduce the treatment cost of fly ash and the production cost of ceramic brick, was studied in detail. Table 7.1 shows the ratios of raw materials for making ceramic brick. Six samples of varied ratios without the addition of ceramic flux were tested, and the sintering temperature exceeded 1050°C, which had an adverse effect on the stabilization of heavy metals on the one hand, and required more energy on the other. To reduce the sintering temperature, feldspar was added as a ceramic flux. To determine the optimum ratio of materials, a four-level five-factor orthogonal test was performed. The factors and levels of the orthogonal test are shown in Table 7.2. Finally, appearance quality, compressive strength, water absorption, and shrinkage, as well as microstructure and phase transformation, were analyzed in terms of ceramic bricks made using the optimum ratio of materials.
Table 7.1
Ratios of Raw Materials for Making Ceramic Bricks Without Ceramic Flux (%)
| No. | R1 | R2 | R3 | R4 | R5 | R6 | R7 | R8 | R9 | R10 | R11 | R12 | R13 | R14 | R15 |
| Red ceramic clay | 55 | 50 | 45 | 40 | 35 | 30 | 25 | 20 | 40 | 40 | 40 | 40 | 40 | 40 | 40 |
| Gang sand | 40 | 40 | 40 | 40 | 40 | 40 | 40 | 40 | 55 | 50 | 45 | 35 | 30 | 25 | 20 |
| Fly ash | 5 | 10 | 15 | 20 | 25 | 30 | 35 | 40 | 5 | 10 | 15 | 25 | 30 | 35 | 40 |
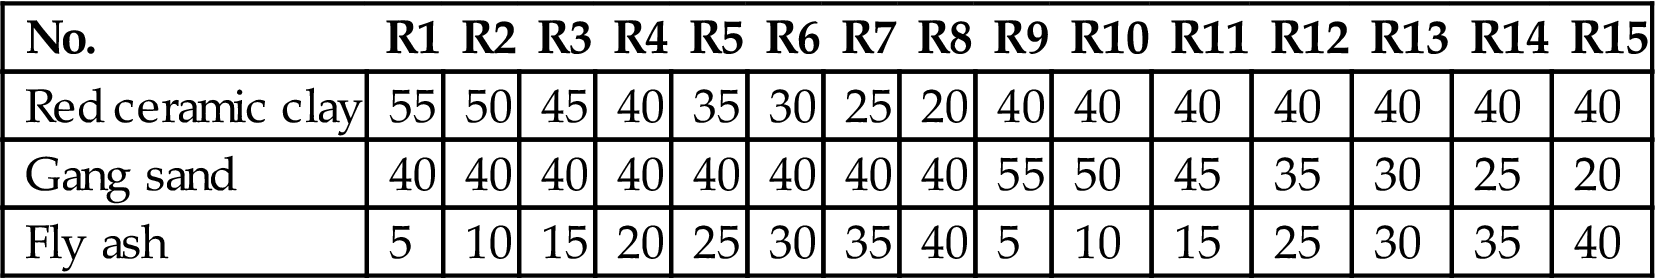
Table 7.2
Factors and Levels of the Orthogonal Test for Making Ceramic Bricks in the Presence of Fly Ash
| Factor | Fly ash (%) | Red Ceramic Clay (%) | Feldspar (%) | Sintering Temperature (°C) | |
| Level | 1 | 15 | 65 | 0 | 900 |
| 2 | 20 | 60 | 5 | 950 | |
| 3 | 25 | 55 | 10 | 1000 | |
| 4 | 30 | 50 | 15 | 1050 | |

A method of making ceramic brick is shown as in Fig. 7.1. First, raw materials should be ground and then mixed with water. The mixed material should be left to stand for 18 h before screening, and then molded using a machine. Prior to the sintering process, the molded body should be dried at around 60°C.

Microstructure and phase transformation of the bricks, sintered at 900°C, 950°C, 1000°C, and 1050°C and made using the optimum ratio of materials, were analyzed using SEM and XRD. The major chemical components of fly ash were CaO, SiO2, and Al2O3, registering a CaO–SiO2–Al2O3 system, as shown in Table 7.3. Hence the fly ash can be used as a blending of ceramic brick whose raw materials feature a SiO2–CaO–Al2O3 system.
Table 7.3
Major Chemical Components of Sampled Fly Ash (%)
| Chemical Components | CaO | SiO2 | Al2O3 | K2O | Na2O | Fe2O3 | MgO | |
| Content | No. 1 | 31.4 | 40.1 | 15.6 | 3.9 | 3.5 | 3.6 | 1.9 |
| No. 2 | 29.4 | 39.7 | 15.9 | 4.3 | 3.7 | 4.1 | 2.9 | |
| No. 3 | 29.8 | 37.8 | 16.8 | 4.4 | 4.2 | 4.9 | 2.1 | |
| Average | 30.2 | 39.2 | 16.1 | 4.2 | 3.8 | 4.2 | 2.3 | |

The plasticity index of sampled fly ash was 3.7 (Table 7.4), smaller than seven, and thus it was a low-plastic material. Hence, other material of high plasticity should be added to improve the plasticity of the ceramic body.
Table 7.4
Plasticity Index of Sampled Fly Ash
| Serial Number | G0 (g) | G1 (g) | G2 (g) | WL (%) | Wp (%) | Ip (%) |
| 1 | 12.60 | 20.51 | 18.91 | 25.3 | – | 3.7 |
| 2 | 11.86 | 37.01 | 32.54 | – | 21.6 |

Note: G0, G1, G2 represent the weight of the bottle, the sum weight of the bottle and the wet sample, and the sum weight of the bottle and the dry sample respectively. Ip, WL, Wp represent the plasticity index, the liquid limit and the plasticity limit, respectively, of the ash, and Ip=WL, Wp.
7.2 Use of Red Ceramic Clay
Red ceramic clay is a kind of natural ceramic clay generated mainly in Dingjiaqiao, Zhejiang Province of China. Table 7.5 shows its major chemical constituents, such as SiO2 and Al2O3, which can react at high temperature to form a large amount of mullite and silicates, the backbone of ceramic brick. Compared with cream-colored ceramic clay, it had a relatively high content of Fe2O3, which gave the product a red color.
Table 7.5
Chemical Composition of Red Ceramic Clay
| Chemical Composition | SiO2 | Al2O3 | Fe2O3 | K2O | Na2O | CaO | MgO | TiO2 | MnO | |
| Content (%) | No. 1 | 70.60 | 15.10 | 4.90 | 3.20 | 0.70 | 2.40 | 1.80 | 0.90 | 0.40 |
| No. 2 | 69.80 | 15.30 | 4.50 | 3.10 | 0.40 | 2.10 | 2.30 | 1.10 | 1.40 | |
| No. 3 | 71.30 | 14.10 | 4.10 | 2.90 | 0.50 | 2.90 | 2.50 | 0.90 | 0.80 | |
| Average | 70.57 | 14.83 | 4.50 | 3.07 | 0.53 | 2.47 | 2.20 | 0.97 | 0.87 | |

Fig. 7.2 indicates the major mineral constitutions of red ceramic clay, including quartz, muscovite, and kaolinite, which can be transformed into mullite at temperatures over 900°C, thus facilitating the formation of the framework of ceramic brick.
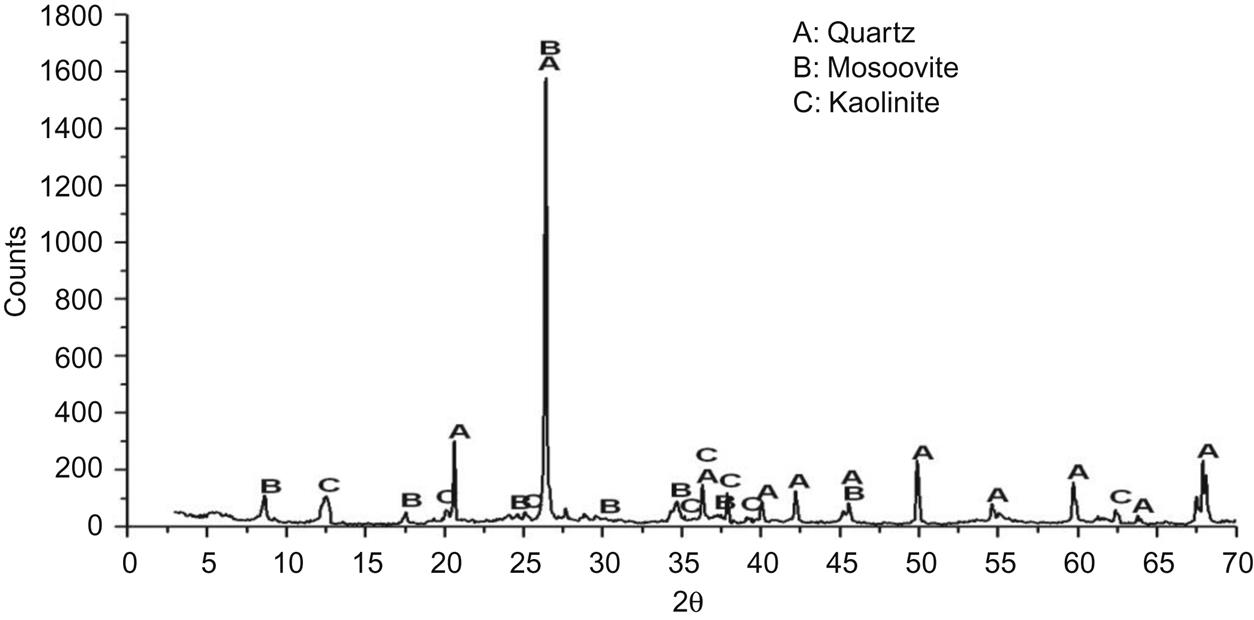
The plasticity index of red ceramic clay was 7.2 (Table 7.6), larger than seven, and thus it was a plastic material of medium level, which was attributed to its composition of kaolinite and moscovite. It can improve the plasticity of the ceramic body.
Table 7.6
Plasticity Index of Red Ceramic Clay
| Serial Number | G0 (g) | G1 (g) | G2 (g) | WL (%) | Wp (%) | Ip (%) |
| 1 | 15.01 | 25.97 | 23.51 | 28.9 | – | 7.2 |
| 2 | 12.12 | 37.91 | 33.32 | – | 21.7 |
Note: G0, G1, G2, Ip, WL, Wp have the same meaning as those in Table 7.4.
7.3 Use of Gang Sand
Gang sand is a kind of fired material produced by grinding waste encaustic tile. Table 7.7 shows that it has a high content of SiO2, which is a major component of ceramic body. It can react with Al2O3, forming mullite and thus improving the physical performance of the product. It also has a relatively high Fe2O3 content, which gives ceramic brick a red color. In addition, mullite was found in the sand (Fig. 7.3), which was conducive to the sintering of the brick.
Table 7.7
Chemical Composition of Gang Sand Used
| Chemical Composition | SiO2 | Al2O3 | Fe2O3 | K2O | Na2O | CaO | MgO | TiO2 | MnO | |
| Content (%) | No. 1 | 71.50 | 17.70 | 5.90 | 1.80 | 0.10 | 0.70 | 0.50 | 0.90 | 0.90 |
| No. 2 | 70.20 | 18.40 | 5.80 | 1.60 | 0.20 | 0.90 | 0.70 | 0.80 | 1.40 | |
| No. 3 | 71.90 | 17.20 | 5.70 | 1.70 | 0.30 | 0.80 | 0.60 | 0.70 | 1.10 | |
| Average | 71.20 | 17.77 | 5.80 | 1.70 | 0.20 | 0.80 | 0.60 | 0.80 | 1.13 | |

The plasticity index of gang sand was 5.6 (Table 7.8), smaller than 7 and larger that of MSWI fly ash, and thus it was a low-plastic material. It can improve the plasticity of the ceramic body.
Table 7.8
Plasticity Index of Gang Sand Used
| Serial Number | G0 (g) | G1 (g) | G2 (g) | WL (%) | Wp (%) | Ip (%) |
| 1 | 13.45 | 26.12 | 23.41 | 27.2 | – | 5.6 |
| 2 | 13.31 | 35.34 | 31.42 | – | 21.6 |

Note: G0, G1, G2, Ip, WL, Wp have the same meaning as they do in Tables 7.4 and 7.6.
7.4 Use of Feldspar
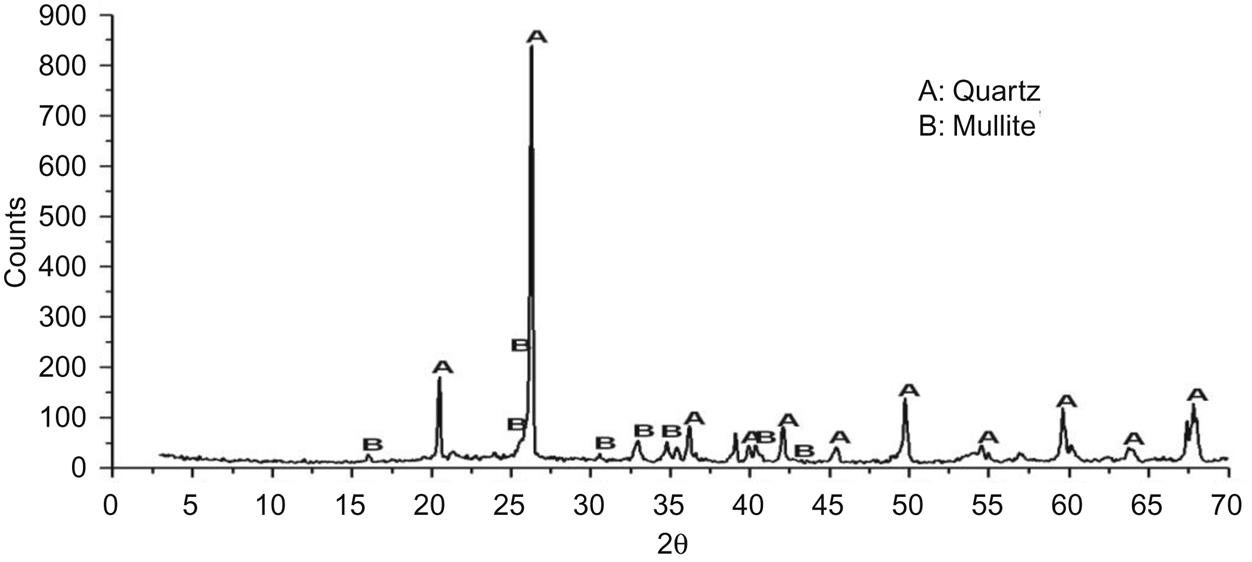
Feldspar used in the experiment came from Yixing, Jiangsu province, China. It was conducive to the reduction of the sintering temperature of ceramic brick. Its major mineral components were quartz, muscovite, potash feldspar, and soda feldspar (Fig. 7.4).

The plasticity index of feldspar was 6.6 (Table 7.9), smaller than 7 and larger than those of MSWI fly ash and gang sand, and thus it is a material with higher plasticity than those of MSWI fly ash and gang sand.
Table 7.9
Plasticity Index of Feldspar Used
| Serial Number | G0 (g) | G1 (g) | G2 (g) | WL (%) | Wp (%) | Ip (%) |
| 1 | 12.41 | 26.21 | 23.13 | 28.7 | – | 6.6 |
| 2 | 13.33 | 35.39 | 31.40 | – | 22.1 |
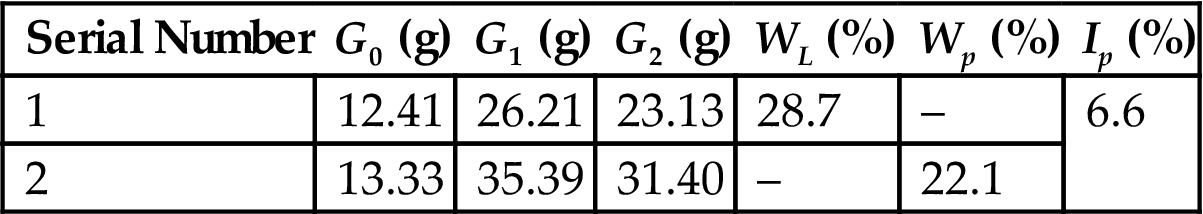
Note: G0, G1, G2, Ip, WL, Wp have the same meaning as they do in Table 7.4.
7.5 Orthogonal Test
The quality of appearance of ceramic bricks, the most important aspect of their performance, is chosen as the assessment indicator in the orthogonal test. Appearance is graded at five levels according to the state of crack, craze, arsis defect, and chipping, as shown in Table 7.10. The orthogonal test design, as well as intuitionistic and variance analysis is set out in Tables 7.11 and 7.12.
Table 7.10
Grading of Appearance of Ceramic Bricks mm
| Appearance Quality | 5 | 4 | 3 | 2 | 1 |
| Sum length of crack along width of bedding face and that extending to side face | ≤30 | 30–45 | 45–60 | 60–80 | ≥80 |
| Sum length of crack along length of bedding face and that extending to side face or end face | ≤50 | 50–65 | 65–80 | 80–100 | ≥100 |

Table 7.11
Orthogonal Test Design and Intuitionistic Analysis
| No. | MSWI Fly Ash | Error | Red Ceramic Clay | Feldspar | Sintering Temperature (°C) | Grade of Appearance Quality |
| R16 | 1 | 1 | 1 | 1 | 1 | 1 |
| R17 | 1 | 2 | 2 | 2 | 2 | 4 |
| R18 | 1 | 3 | 3 | 3 | 3 | 5 |
| R19 | 1 | 4 | 4 | 4 | 4 | 3 |
| R20 | 2 | 1 | 2 | 3 | 4 | 4 |
| R21 | 2 | 2 | 3 | 4 | 1 | 3 |
| R22 | 2 | 3 | 4 | 1 | 2 | 4 |
| R23 | 2 | 4 | 1 | 2 | 3 | 3 |
| R24 | 3 | 1 | 3 | 4 | 2 | 3 |
| R25 | 3 | 2 | 4 | 1 | 3 | 2 |
| R26 | 3 | 3 | 1 | 2 | 4 | 3 |
| R27 | 3 | 4 | 2 | 3 | 1 | 2 |
| R28 | 4 | 1 | 4 | 2 | 3 | 1 |
| R29 | 4 | 2 | 1 | 3 | 4 | 2 |
| R30 | 4 | 3 | 2 | 4 | 1 | 2 |
| R31 | 4 | 4 | 3 | 1 | 2 | 1 |
| K1j | 13 | 9 | 9 | 8 | 8 | Σy = 43 |
| K2j | 14 | 11 | 12 | 11 | 12 | |
| K3j | 10 | 14 | 12 | 13 | 11 | |
| K4j | 6 | 9 | 10 | 11 | 12 | |
| K1j′ | 3.25 | 2.25 | 2.25 | 2 | 2 | Σy2 = 137 |
| K2j′ | 3.5 | 2.75 | 3 | 2.75 | 3 | |
| K3j′ | 2.5 | 3.5 | 3 | 3.25 | 2.75 | |
| K4j′ | 1.5 | 2.25 | 2.5 | 2.75 | 3 | |
| R | 2 | 1.25 | 0.5 | 0.75 | 1 |
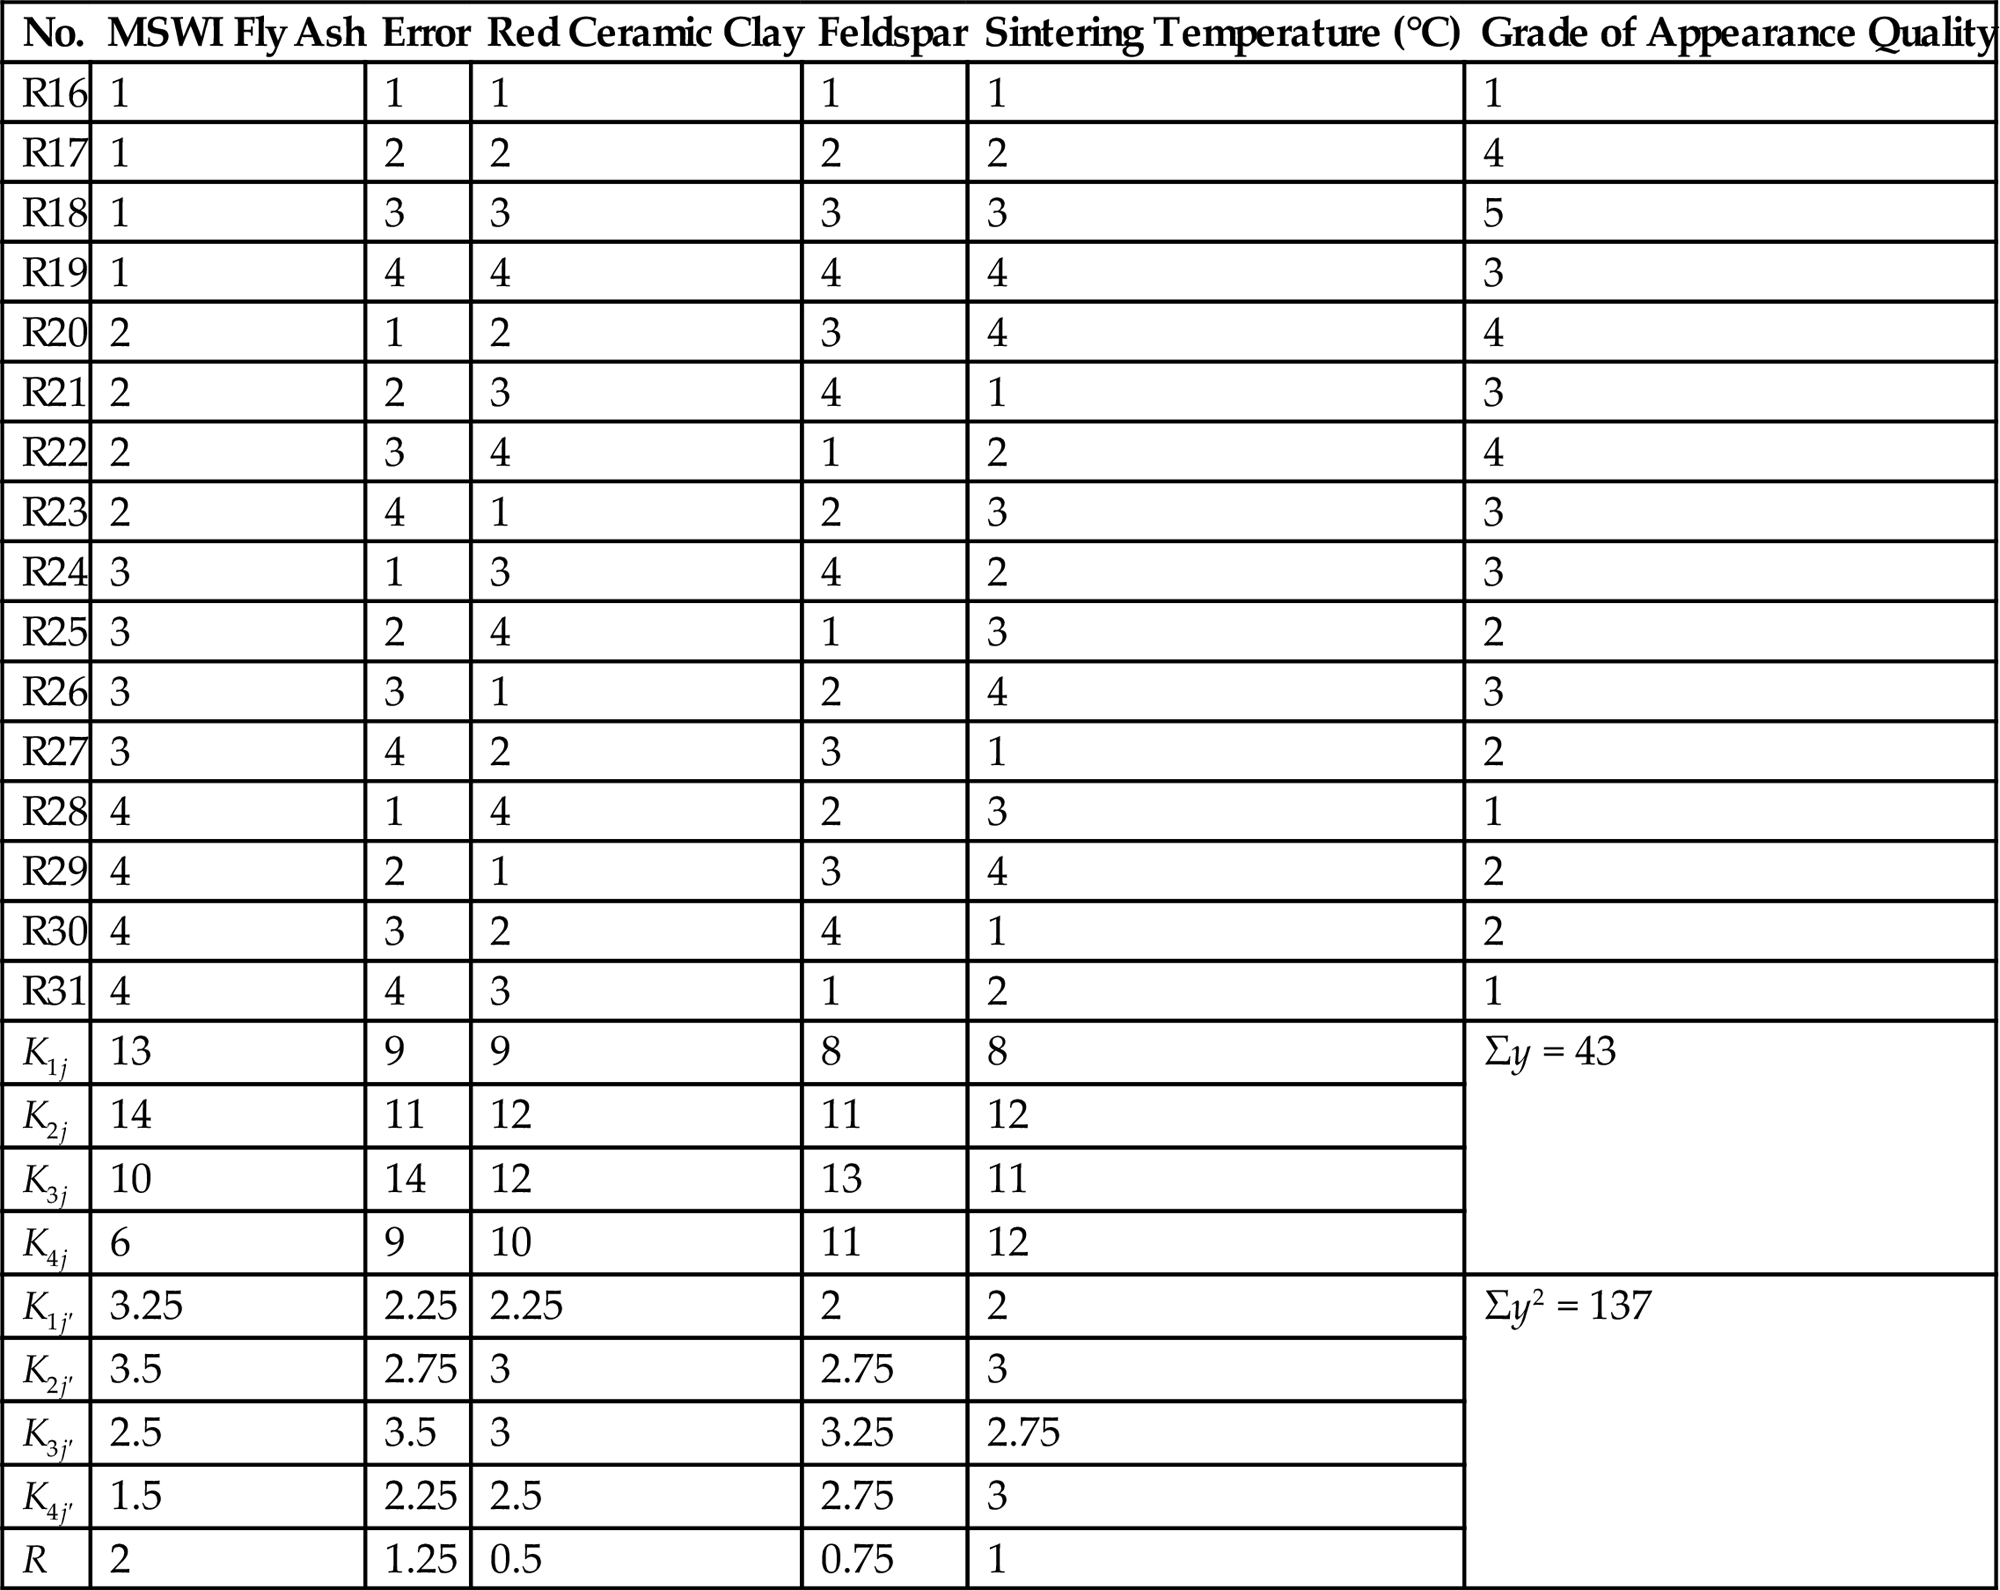
Table 7.12
Variance Analysis of the Orthogonal Test
| Source of Variance | Sum of Square | Degree of Freedom | Sum of Mean Square | F | Degree of Significance |
| MSWI fly ash | 9.69 | 3 | 3.23 | 2.31 | a |
| Red ceramic clay | 1.69 | 3 | 0.56 | 0.40 | |
| Feldspar | 3.19 | 3 | 1.06 | 0.76 | |
| Sintering temperature | 2.69 | 3 | 0.90 | 0.64 | |
| Error | 4.19 | 3 | 1.40 | F0.90(3,3) = 5.39 | |
| Sum | 21.45 | 15 | |||
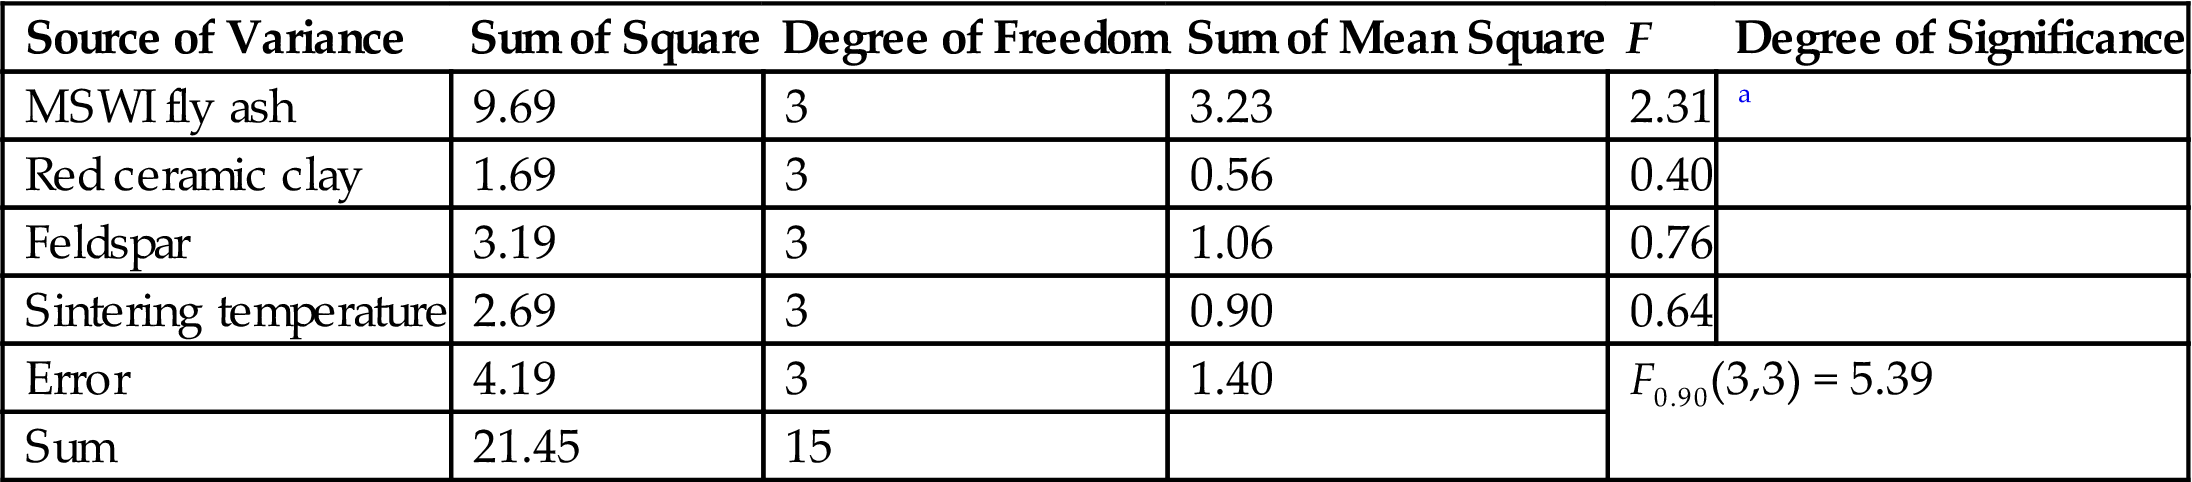
aMeans the biggest degree of significance.
Intuitionistic analysis shows that fly ash ranks as the No. 1 factor that influences the appearance quality of ceramic brick, and feldspar the No. 2 factor. Variance analysis indicates that MSWI fly ash is the decisive factor in terms of the appearance quality of ceramic brick, while the influence of feldspar and sintering temperature red ceramic clay is similar. Based on intuitionistic and variance analysis, material ratios for bricks of relatively good appearance quality are chosen, and this is shown in Table 7.13.

7.6 Analysis of Ceramic Brick Performance Based on R20 and R32
The performance of ceramic bricks sintered at 950°C, based on the R20 and R32 ratios, were studied in detail to determine the optimum ratio of materials. The appearance quality of products based on R20 and R32, sintered at 950°C, is set out in Table 7.14. It can be deduced from the table that ceramic bricks based on R20 all met the requirements of No. 1 described in GB5101-2003, while, in terms of bricks based on R32, only one sample met the No. 1 standard and two met the basic requirements. Consequently, bricks based on R20 registered better appearance quality than those based on R32.
Table 7.14
Appearance Quality of Products Based on R20 and R32 mm
| No. | Items | 1 | 2 | 3 | Average |
| R20 | Height difference between two side faces | 2.0 | 1.5 | 1.9 | 1.8 |
| Curve | 2.1 | 2.5 | 2.0 | 2.2 | |
| Height of impurity over faces | 2.1 | 1.9 | 1.7 | 1.9 | |
| Size that three chippings or ariss defects should not simultaneously exceed | 5.2 | 5.6 | 5.8 | 5.5 | |
| Craze I | 32.1 | 39.3 | 35.0 | 35.5 | |
| Craze II | 56.4 | 65.6 | 63.1 | 61.7 | |
| Faces without defects | Two sf* and two ef* | Two bf* and two ef* | Two sf* and one bf* | >one sf *and one ef* | |
| Color | Essentially uniform | Essentially uniform | Essentially uniform | Essentially uniform | |
| Grade | No. 1 | No. 1 | No. 1 | Average | |
| R32 | Height difference between two side faces | 2.7 | 2.3 | 2.9 | 2.6 |
| Curve | 2.2 | 2.8 | 3.0 | 2.7 | |
| Height of impurity over faces | 2.0 | 2.3 | 2.0 | 2.1 | |
| Size that three chippings or arsis defects should not simultaneously exceed | 10.7 | 7.6 | 9.4 | 9.2 | |
| Craze I | 59.2 | 60.3 | 61.7 | 60.4 | |
| Craze II | 76.4 | 79.2 | 80.3 | 78.6 | |
| Faces without defects | One sf* and two ef* | One bf* and one ef* | One bf* | <one sf *and one ef* | |
| Color | Essentially uniform | Partial uniform | Partial uniform | Partial uniform | |
| Grade | No. 1 | Pass | Pass | Pass |

Note: Craze I represents sum length of crack along width of bedding face and that extending to side face. Craze II represents sum length of crack along length of bedding face and that extending to side face or end face. sf*, bf* and ef* represent side face, bedding face, and end face respectively.
Fig. 7.5 shows compressive strengths of ceramic bricks sintered at 950°C and based on R20 and R32. The figure indicated that ceramic bricks based on R20 registered higher compressive strength than those based on R32.

Note R201, R202, R203 in Fig. 5.7 represent the compressive strengths of three samples based on R20; R31, R32, R33 represent the compressive strengths of R32. Av1 and Av2 represent the average compressive strength of bricks based on R20 and R32 respectively.
Fig. 7.6 shows water absorptions, after 5 h boiling in water, of ceramic bricks sintered at 950°C and based on R20 and R32. From the figure, it was clear that bricks based on ratio R20 boasted a lower water absorption than those based on ratio R32.
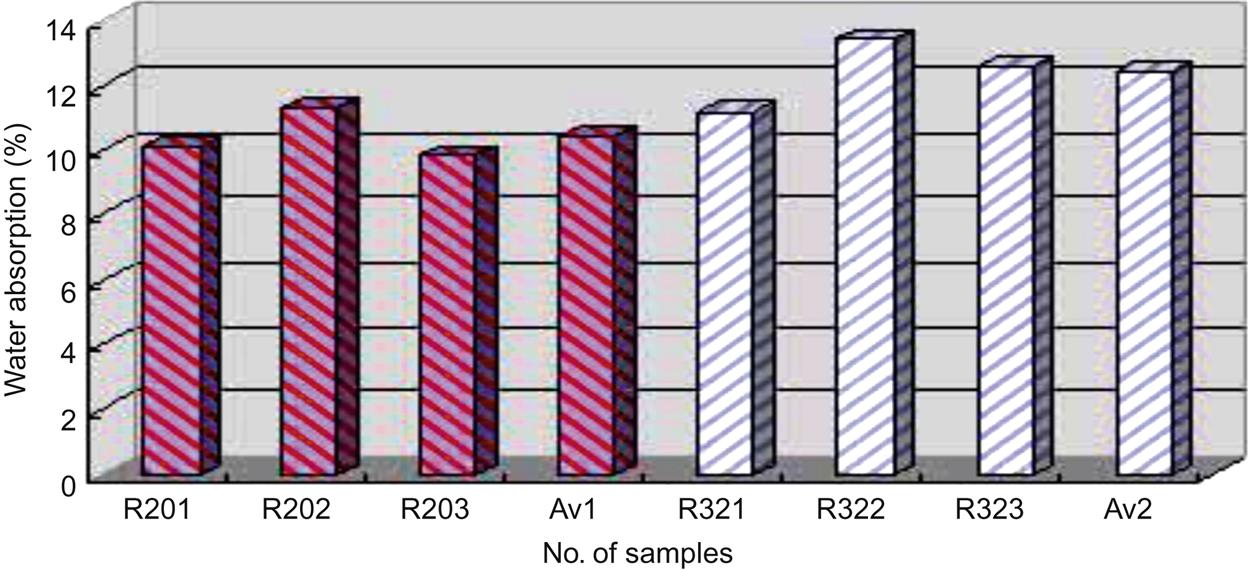
Note R201, R202, R203 in Fig. 5.8 represent the water absorptions of three samples based on R20; R31, R32, R33 represent the water absorptions of R32. Av1 and Av2 represent average water absorption of bricks based on R20 and R32, respectively.
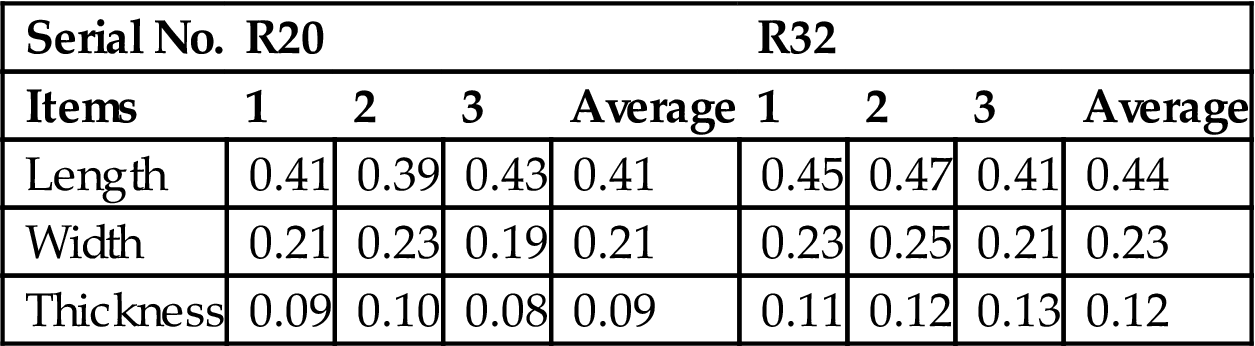
Table 7.15 shows specific shrinkage of ceramic bricks, sintered at 950°C and based on R20 and R32. It was indicated that variances in bricks based on R20 were relatively lower than in those based on R32.
Table 7.15
Shrinkage of Ceramic Bricks Sintered at 950°C and Based on R20 and R32 mm
| Serial No. | R20 | R32 | ||||||
| Items | 1 | 2 | 3 | Average | 1 | 2 | 3 | Average |
| Length | 0.41 | 0.39 | 0.43 | 0.41 | 0.45 | 0.47 | 0.41 | 0.44 |
| Width | 0.21 | 0.23 | 0.19 | 0.21 | 0.23 | 0.25 | 0.21 | 0.23 |
| Thickness | 0.09 | 0.10 | 0.08 | 0.09 | 0.11 | 0.12 | 0.13 | 0.12 |
From the above performance analysis of compressive strength, water absorption, and shrinkage, it is concluded that R20 is better than R32 in terms of production of ceramic bricks using MSWI fly ash, red ceramic clay, gang sand, and feldspar. Hence, bricks based on R20 are chosen to analyze performance variation and microstructure and phase altering as a function of temperature.
7.7 Analysis of Performance Variation of Bricks Based on R20 As a Function of Temperature
The quality of appearance of products based on R20 as a function of temperature is described in Table 7.16. It was shown that bricks made in accordance with R20 and sintered between 950°C and 1000°C met the requirements of grade No. 1, described in GB5101-2003, and those sintered between 900°C and 925°C, as well as those sintered between 1000°C and 1025°C, met the minimal requirements for ceramic bricks, while those sintered between 1025°C and 1050°C were unqualified. Consequently, sintering temperatures spanning 950°C and 1000°C were recommended to produce ceramic bricks of grade No. 1 in terms of appearance quality.
Table 7.16
Appearance Quality of Bricks Based on R20 as a Function of Temperature (mm)
| Items | 900°C | 925°C | 950°C | 975°C | 1000°C | 1025°C | 1050°C |
| Height difference between two side faces | 2.7 | 2.6 | 1.8 | 1.8 | 1.9 | 2.4 | 3.1 |
| Curve | 3.4 | 3.1 | 2.2 | 2.2 | 2.4 | 3.9 | 4.3 |
| Height of impurity over faces | 2.3 | 2.2 | 1.9 | 1.8 | 1.7 | 1.9 | 2.4 |
| Size that three chippings or ariss defects should not simultaneously exceed | 5.2 | 5.3 | 5.5 | 5.6 | 5.9 | 6.3 | 8.1 |
| Craze I | 40.1 | 39.4 | 35.5 | 33.9 | 32.4 | 40.3 | 45.2 |
| Craze II | 70.3 | 68.3 | 61.7 | 54.6 | 49.2 | 60.2 | 79.3 |
| Faces without defects | <one sf *and one ef* | >one sf *and one ef* | Zero | ||||
| Color | Partially uniform | Essentially uniform Essentially uniform | Partially uniform | ||||
| Grade | Pass | No. 1 | Pass | Unqualified | |||
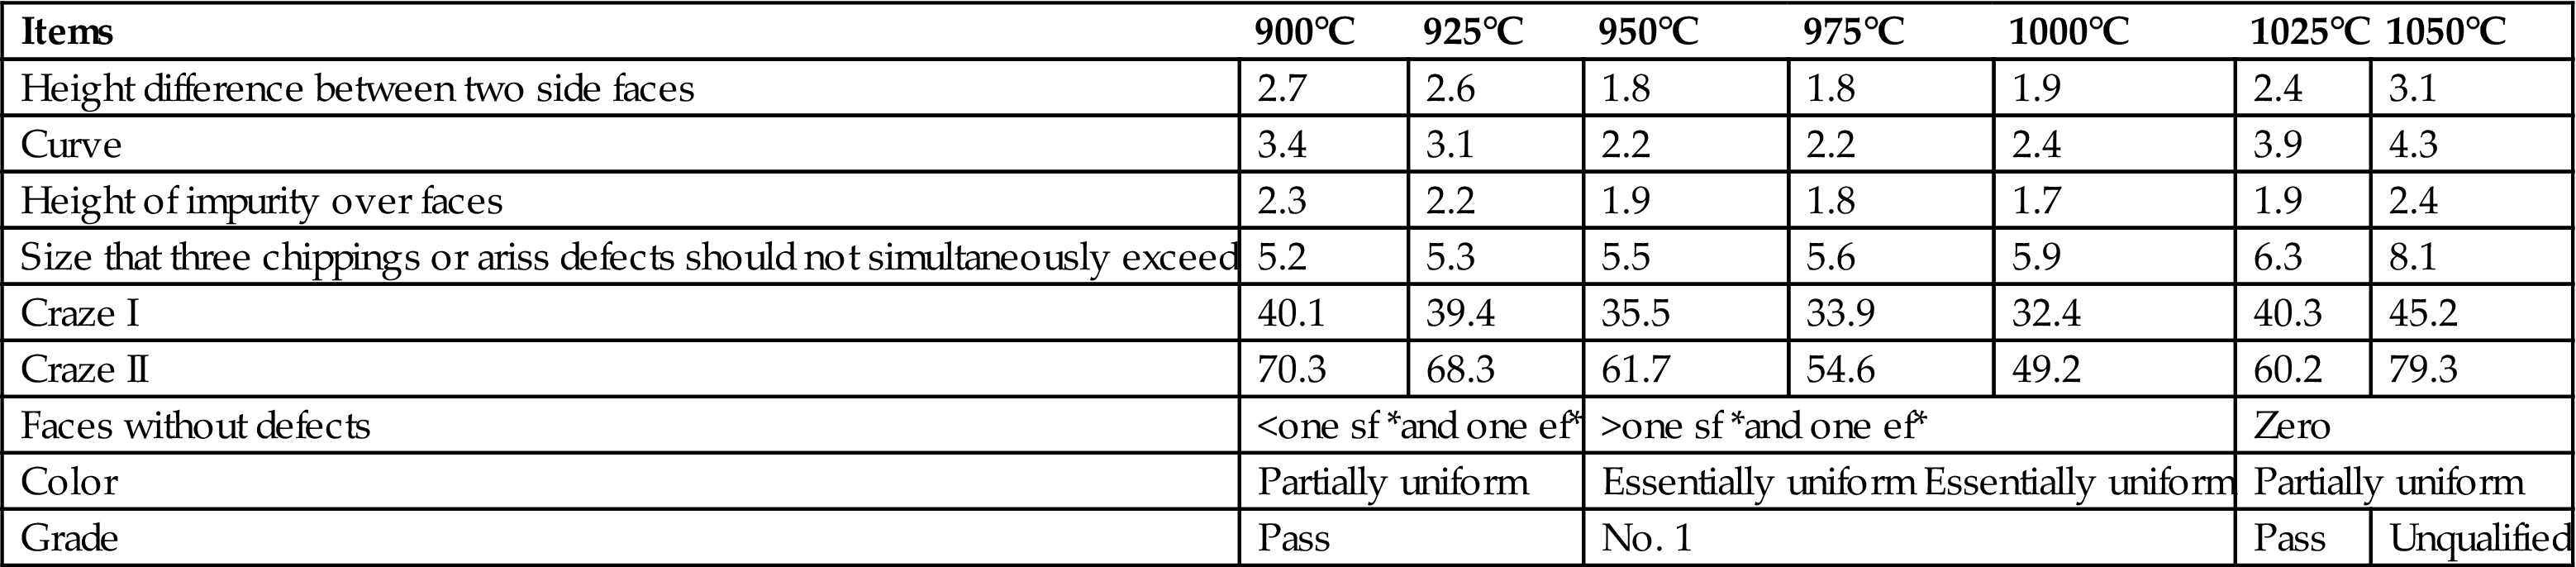
Note: Craze I, Craze II, sf*, bf* and ef* have the same meaning as they do in Table 7.7.
Fig. 7.7 shows the compressive strengths of the bricks made in accordance with R20 as a function of temperature. It was clear that compressive strength increased with the increase of temperature, and thus increasing temperature was a choice for strengthening ceramic bricks. Between 925°C and 1000°C, compressive strength was roughly proportional to sintering temperature. Bricks sintered between 900°C and 938°C, 938°C and 1000°C, and 1000°C and 1050°C, fell into grades MU10, MU15, and MU20, respectively.

Note: 1, 2, 3 in Fig. 5.9 represent the compressive strengths of three different brick samples respectively, and Av represents the average compressive strength.
Specific water absorptions of bricks made in accordance with R20 as functions of sintering temperature are shown in Fig. 7.8. It can be seen from the figure that water adsorption of the product decreased as sintering temperature increased from 900 to 1000°C, and rose with increase of temperature from 1000 to 1050°C. This is caused by the fact that appearance quality is improved with the increase of temperature from 900 to 1000°C, while it deteriorates as temperature rises from 1000 to 1050°C.

Note: 1, 2, 3 in Fig. 5.10 represent water absorption of three different brick samples respectively, and Av represents the average water absorption.
Table 7.17 shows specific shrinkage of bricks made in accordance with R20 as a function of temperature. From the table, it can be seen that shrinkage decreased with increase of temperature from 900 to 1050°C, which was caused by the strengthening process. Bricks sintered at temperatures spanning 925°C and 1000°C registered relatively smaller shrinkage, meeting requirements for ceramic bricks, and this indicates good sintering between 925°C and 1000°C.
Table 7.17
Shrinkage of Bricks made in Accordance with R20 at Different Temperature (mm)
| Temperature | 900 | 925 | 950 | 975 | 1000 | 1025 | 1050 |
| Length | 0.52 | 0.31 | 0.19 | 0.17 | 0.14 | −0.09 | −0.16 |
| Width | 0.31 | 0.23 | 0.19 | 0.09 | 0.04 | −0.02 | −0.14 |
| Thickness | 0.15 | 0.14 | 0.11 | 0.09 | 0.07 | −0.04 | −0.09 |
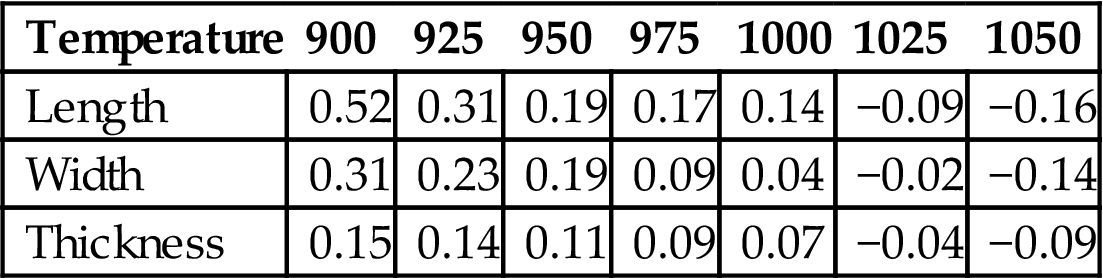
From the above analysis of the performance of bricks made in accordance with R20 as a function of temperature, sintering temperatures spanning 950°C and 1000°C are recommended to produce bricks of MU15 in terms of compressive strength and grade No. 1 in terms of appearance quality. Water absorption and shrinkage of bricks sintered at these temperatures both meet requirements for ceramic bricks.
7.8 Analysis of Ceramic Brick Microstructure Variation and Transformation of Phases
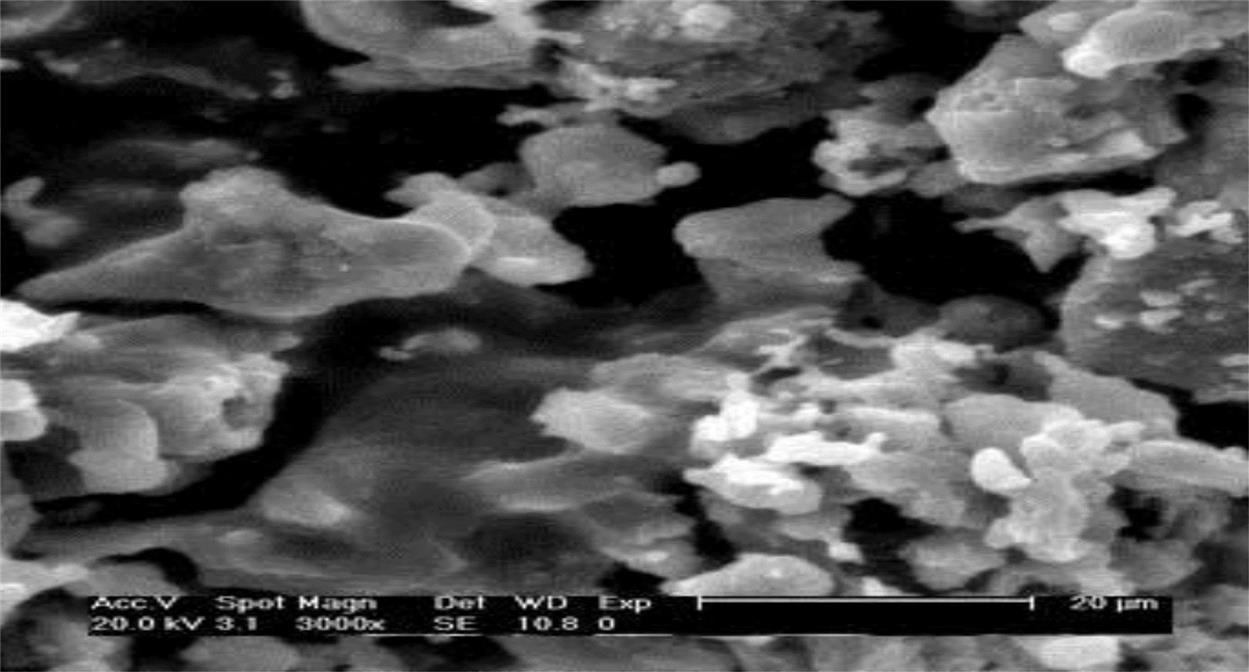
To study microstructure variation and phase transformation, SEM and XRD analyses were performed on bricks based on R20 and sintered at 900°C, 950°C, 1000°C, and 1050°C. Fig. 7.9 shows a SEM analysis of a ceramic brick made in accordance with R20 and sintered at 900°C. It was clear that the brick had a relatively incompact structure with a lot of depressions in it, indicating a relatively high rate of waste product. Interfaces among particles were clear-cut, without formation of continuous phases. In terms of performance, compressive strength was relatively low and water absorption relatively high, which was explained by the decisive factor of large product porosity.
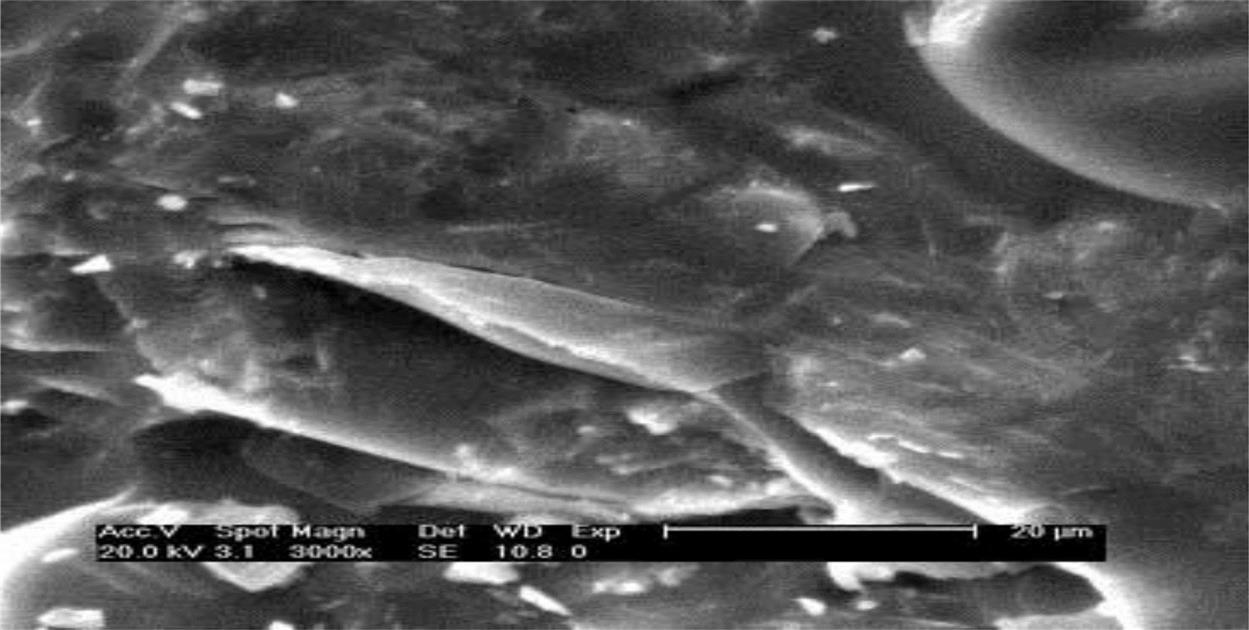
When the temperature rose to 950°C, most mini-cracks on the surfaces of the bricks disappeared, according to SEM analysis of the product sintered at 950°C, as shown in Fig. 7.10. Obvious reactions can be seen at interfaces of particles and the interfaces were much more obscure than those examined at 900°C. Hence, porosity decreases considerably and the density of the product increases, which may be attributed to particle migration through liquid phases with the increase of sintering temperature.

After being sintered at 1000°C, the product featured a smooth and sound surface, high strength, and great hardness, all indicating good performance. From Fig. 7.11, it can be seen that particles were closely connected together and covered with new output to form a continuous solid whole consisting of a large number of glass phases with an increase of temperature by tightly cementing particles. Meanwhile, heavy metals can be cemented by glass phases or immobilized within a firm crystal lattice, so that they can hardly be leached out. The product shows higher strength and smoother and darker surfaces, than do bricks sintered at 950°C. It seems that the product shows a character of more sound sintering when diffusion of the crystal lattice and the crystal interface, and surface diffusion proceed together.

Fig. 7.12 shows SEM analysis bricks sintered at 1050°C, with the particles more closely cemented together and invisible interfaces. A hard solid whole with high strength was the result. Apparently, heavy metals have been more tightly fixed in the solid and can hardly be leached out, even in acidic conditions. However, too many glass phases form at this temperature, which may be negative for appearance quality, owing to shape distortion.
From the above analysis, it is concluded that the microstructure is strengthened with the increase of temperature, and porosity reduced. In addition, the content of glass phases increases and particles are more closely cemented together as the sintering temperature increases from 900 to 1050°C, which is conducive to solidification of heavy metals in the body.
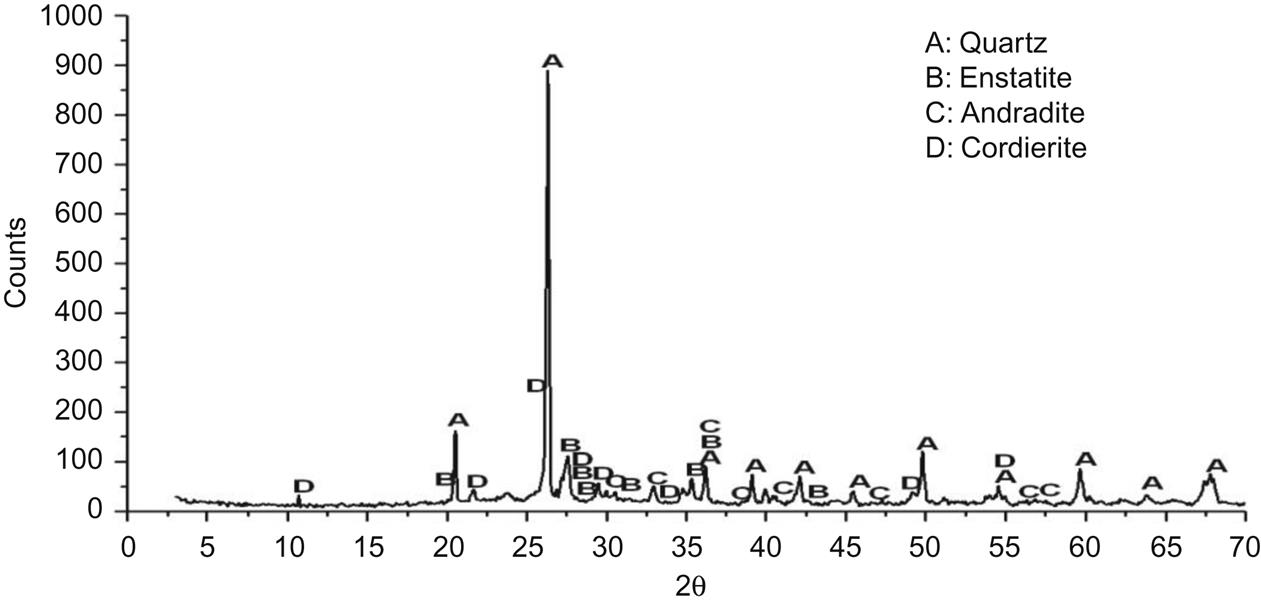
Major crystalline phases were quartz, cordierite, enstatite, and andradite, as shown in Fig. 7.13. No mullite was found in the XRD analysis, which indicated underfire of the bricks sintered at 900°C. The major phases formed were enstatite, andradite, and cordierite, which were also major mineral constituents of ceramic bricks and facilitate the strengthening process.
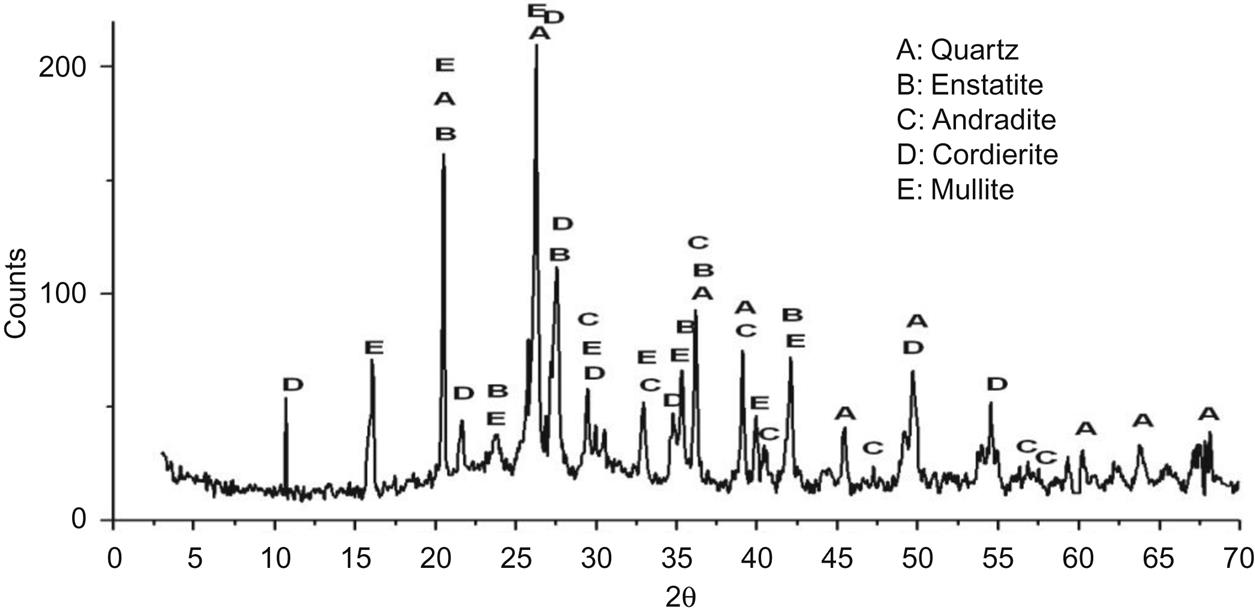
The XRD analysis, as shown in Fig. 7.14, of bricks sintered at 950°C, shows the existence of mullite, visible in the emergence of obvious diffraction peaks of mullite at d=5.39, 3.428, 3.390×, 2.886, 2.694, 2.542, 2.206, and 2.121 Å, implying that mullite had been a major crystalline phase of the bricks sintered at 950°C. Other mineral formations involved cordierite, enstatite, and andradite, and their quantity increased compared with that of the brick sintered at 900°C, which was shown by the increase of their diffraction peaks.

From the XRD analysis (Fig. 7.15), it was concluded that glass phases increased at 1000°C from their number at 950°C. The major crystalline phases were still quartz, cordierite, enstatite, and andradite, registering a reduction in the content of these from the level at 950°C, which was inconsistent with the result of SEM analysis.
From the XRD analysis at 1050°C (Fig. 7.16), it was implied that the content of crystalline phases continued to decrease and more glass phases formed, which was also inconsistent with what can be seen in the SEM analysis.

7.9 Leaching Toxicity Analysis of Bricks Based on R20
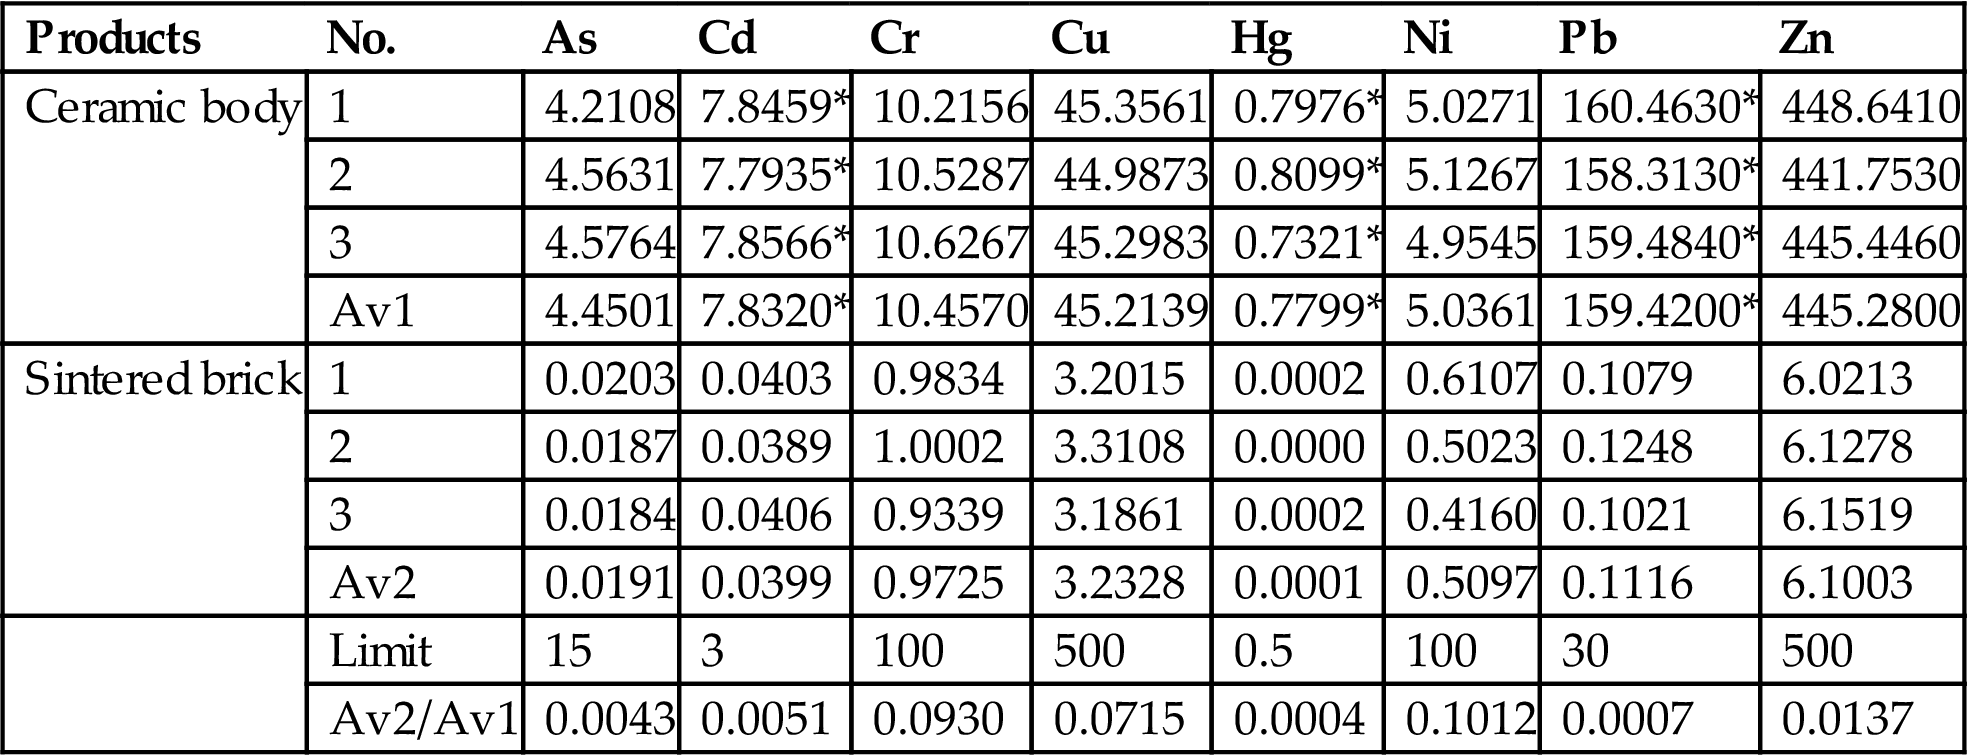
Given the performance of the bricks based on R20 and the stabilization of heavy metals, the bricks sintered at 950°C were chosen to test leaching toxicity. Leaching results, in accordance with HVEP and ALT standards, of ceramic bodies and bricks sintered at 950°C are shown in Tables 7.18 and 7.19. Leaching results of Pb and Hg from ceramic bodies in accordance with both standards exceeded the levels of the prescribed limit, and those of Cd in accordance with ALT standard also exceeded the prescribed limit levels. All leaching results from sintered bricks were far lower than the levels given as limits, and thus heavy metals were apparently stabilized in the strengthened body of ceramic brick through the sintering process. No leaching, in accordance with HVEP standard, of As and Hg from the sintered bricks were detected, and leaching of other heavy metals was reduced considerably, compared with those from ceramic bodies prior to the sintering process. Leaching results, in accordance with the standard of ALT, of Cd, Pb, and Hg from the sintered bricks were reduced to 0.51%, 0.07%, and 0.04% of those from the ceramic bodies, and those of other heavy metals were reduced greatly. Hence, the utilization of MSWI fly ash in making ceramic brick was an effective way to stabilize heavy metals.
Table 7.18
Leaching Results of Heavy Metals from Ceramic Bodies and Sintered Bricks in Accordance with HVEP Standard
| Products | NO. | As | Cd | Cr | Cu | Hg* | Ni | Pb* | Zn |
| Ceramic body | 1 | 0.0087 | 0.0286 | 0.1997 | 10.6790 | 0.1072* | 0.1893 | 13.0231* | 19.0245 |
| 2 | 0.0074 | 0.0295 | 0.2569 | 10.7520 | 0.1032* | 0.1145 | 14.9543* | 19.7651 | |
| 3 | 0.0082 | 0.0298 | 0.2469 | 9.2080 | 0.0968* | 0.1378 | 15.3969* | 19.4560 | |
| Av1 | 0.0081 | 0.0293 | 0.2345 | 10.2130 | 0.1024* | 0.1472 | 14.4581* | 19.4152 | |
| Sintered bricks | 1 | ND | 0.0001 | 0.0267 | 0.8930 | ND | 0.0142 | 0.0074 | 0.0721 |
| 2 | ND | 0.0000 | 0.0214 | 0.8013 | ND | 0.0159 | 0.0088 | 0.0768 | |
| 3 | ND | 0.0003 | 0.0244 | 0.8028 | ND | 0.0149 | 0.0098 | 0.0724 | |
| Av2 | ND | 0.0001 | 0.0242 | 0.8324 | ND | 0.0150 | 0.0087 | 0.0738 | |
| Limit[12] | 1.5 | 0.3 | 10 | 50 | 0.05 | 10 | 3 | 50 | |
| Av2/Av1 | 0.0034 | 0.0049 | 0.1030 | 0.0815 | 0 | 0.1020 | 0.0006 | 0.0038 |

Note: 1, 2, and 3 represent leaching results of heavy metals from two different ceramic bodies or sintered brick; Av1 and Av2 represent average leaching results of heavy metals from ceramic bodies and sintered brick; ND means that no leaching is detected.
Table 7.19
Leaching Result of Heavy Metals from Ceramic Bodies and Sintered Bricks in Accordance with ALT Standard
| Products | No. | As | Cd | Cr | Cu | Hg | Ni | Pb | Zn |
| Ceramic body | 1 | 4.2108 | 7.8459* | 10.2156 | 45.3561 | 0.7976* | 5.0271 | 160.4630* | 448.6410 |
| 2 | 4.5631 | 7.7935* | 10.5287 | 44.9873 | 0.8099* | 5.1267 | 158.3130* | 441.7530 | |
| 3 | 4.5764 | 7.8566* | 10.6267 | 45.2983 | 0.7321* | 4.9545 | 159.4840* | 445.4460 | |
| Av1 | 4.4501 | 7.8320* | 10.4570 | 45.2139 | 0.7799* | 5.0361 | 159.4200* | 445.2800 | |
| Sintered brick | 1 | 0.0203 | 0.0403 | 0.9834 | 3.2015 | 0.0002 | 0.6107 | 0.1079 | 6.0213 |
| 2 | 0.0187 | 0.0389 | 1.0002 | 3.3108 | 0.0000 | 0.5023 | 0.1248 | 6.1278 | |
| 3 | 0.0184 | 0.0406 | 0.9339 | 3.1861 | 0.0002 | 0.4160 | 0.1021 | 6.1519 | |
| Av2 | 0.0191 | 0.0399 | 0.9725 | 3.2328 | 0.0001 | 0.5097 | 0.1116 | 6.1003 | |
| Limit | 15 | 3 | 100 | 500 | 0.5 | 100 | 30 | 500 | |
| Av2/Av1 | 0.0043 | 0.0051 | 0.0930 | 0.0715 | 0.0004 | 0.1012 | 0.0007 | 0.0137 |
Note: 1, 2, 3, Av1, Av2, and ND have the same meaning as they do in Table 7.18.
Through leaching toxicity analysis in accordance with HVEP and ALT standards, it is concluded that the major hazardous heavy metals in sampled MSWI fly ash are As, Hg, Pb, Zn, and Cd. Consequently, their leaching toxicity should be reduced during its recycling or the disposal process. Sequential chemical extraction shows that soluble Cd exists mainly in the acid-soluble, exchangeable, and water-soluble phases, soluble Hg mainly in acid-soluble and water-soluble phases, while soluble Pb appears mainly in the acid-soluble phase, and soluble Zn mainly in organically bound and acid-soluble phases.
The major chemical components of fly ash are CaO, SiO2, and Al2O3, registering a CaO–SiO2–Al2O3 system, and its major compounds are glass phases, silicates, aluminum silicates, and quartz, which makes it a useful base for ceramic brick. In addition it is a material with low plastic content levels, and thus other materials of high plasticity should be added to make ceramic brick.
The orthogonal tests and performance analyses of R20 and R32 show that the optimum ratio of materials is MSWI fly ash 20%, red ceramic clay 60%, feldspar 10%, and gang sand 10%. The optimum sintering temperature is 950°C.
Performance analysis of bricks made in accordance with the optimum ratio of materials shows that temperatures spanning 950°C and 1000°C are recommended to produce bricks of MU 15 in terms of compressive strength and No. 1 grade in terms of appearance quality. Microstructure and phase transformation analysis shows that with the increase of temperature, the content level of crystalline phases of the product first rises and then drops, while the glass phases register a reverse trend. Major phases of the bricks are quartz, cordierite, enstatite, mullit, and andradite.
The leaching results of heavy metals from sintered bricks based on the optimum ratio of materials and sintered at 950°C, in accordance with the standards of HVEP and ALT, are reduced considerably compared with those from ceramic bodies prior to the sintering process. Hence, utilization of MSWI fly ash in making glazed ceramic brick is an effective way to stabilize heavy metals.
7.10 Production Technology of Facing Bricks Using Fly Ash
The resource technology of solid waste always needs to include a feasible process, a competitive product and enormous economic benefits. DTA-TGA analysis of fly ash shows that the addition of fly ash can reduce the sintering temperature of bricks, which can reduce energy consumption in the process of making brick. Microstructure analysis shows the product has a compact structure and the generated phase tends to diversification, which is beneficial to the performance of the bricks. In general, the product containing fly ash stabilizes the heavy metals, so as not to cause secondary pollution. In order to advance the study of brickmaking technology, a pilot scale test and economic assessment, as well as safety assessment, are introduced.
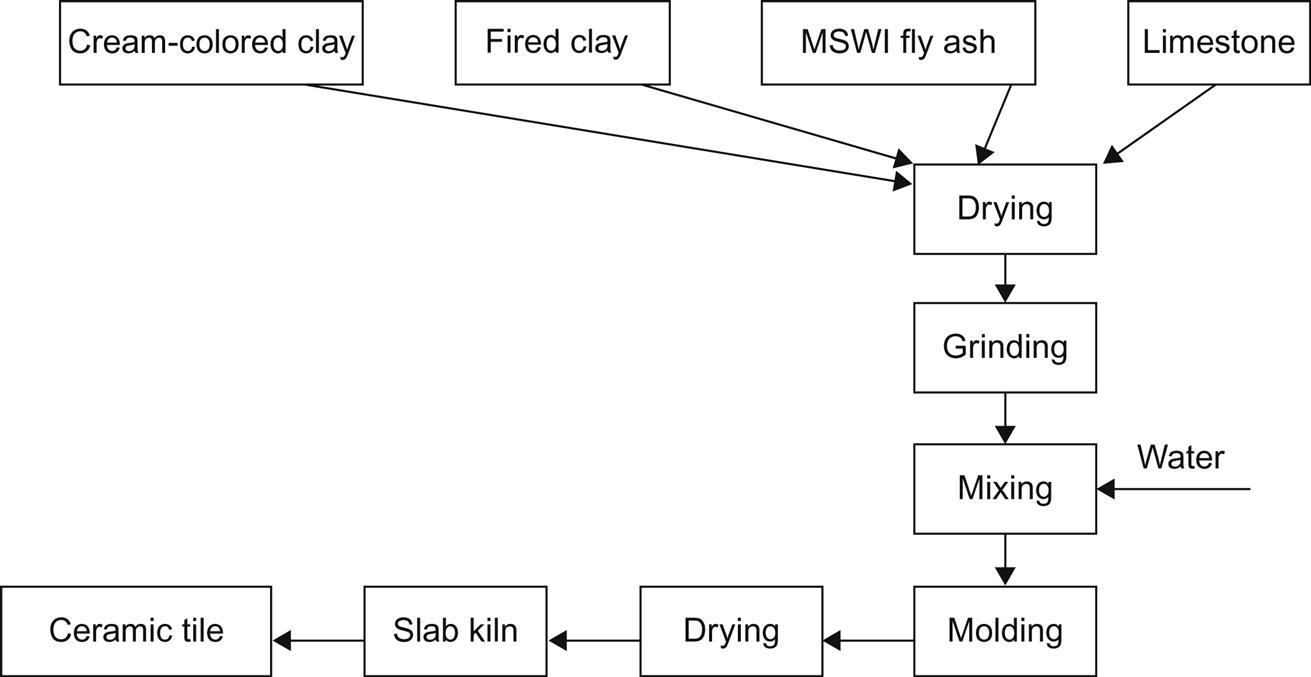
To make ceramic tile, fly ash, cream-colored clay, fired clay, and limestone were used. Cream-colored clay is a kind of natural clay, output in the area around Yixing, Jiangsu Province of China. Table 7.20 shows that the major chemical constitutions are SiO2 and Al2O3, which can react at high temperature to form a large quantity of mullite and silicates and the backbone of ceramic tile.
Table 7.20
Chemical Composition of Cream-Colored Clay
| Chemical Composition | SiO2 | Al2O3 | Fe2O3 | K2O | Na2O | CaO | MgO | TiO2 |
| Content (%) | 72.3 | 16.4 | 1.6 | 3.7 | 0.8 | 0.3 | 0.6 | 0.8 |

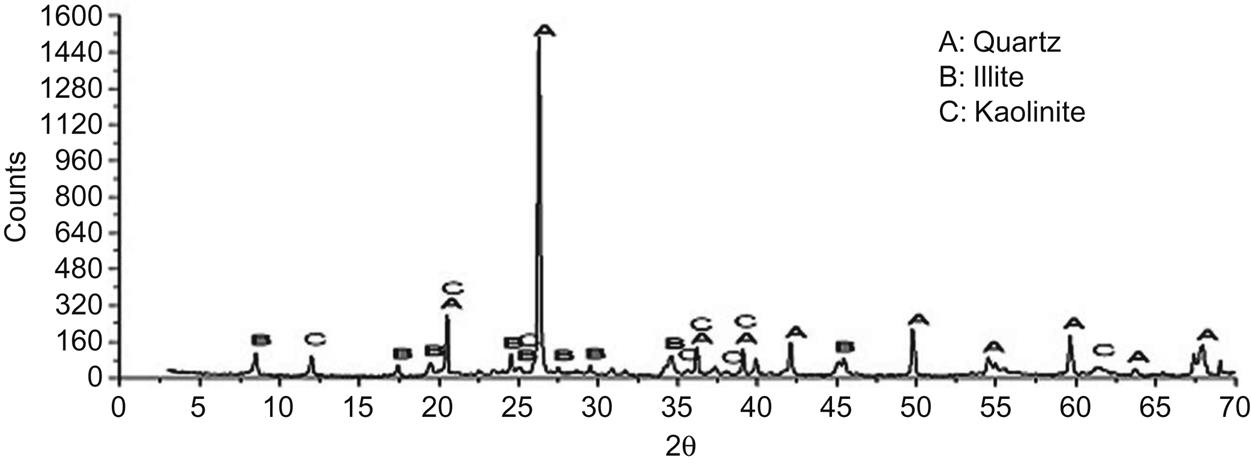
The major mineral constituents of cream-colored clay were quartz, illite, and kaolinite, which can change into mullite at temperatures over 900°C, thus facilitating the formation of framework of ceramic tiles, as shown in Fig. 7.17.
Fired clay is a kind of fired material produced by grinding waste terracotta. Table 7.21 implies that fired clay has a high content level of Al2O3, which is a major constituent of a ceramic body. It can react with SiO2, forming mullite and thus improving the physical performance of the product.
Table 7.21
Chemical Composition of Fired Clay
| Chemical Composition | SiO2 | Al2O3 | Fe2O3 | K2O | Na2O | CaO | MgO | TiO2 |
| Content (%) | 61.3 | 29.4 | 2.2 | 1.9 | 0.2 | 0.7 | 2.9 | 1.0 |

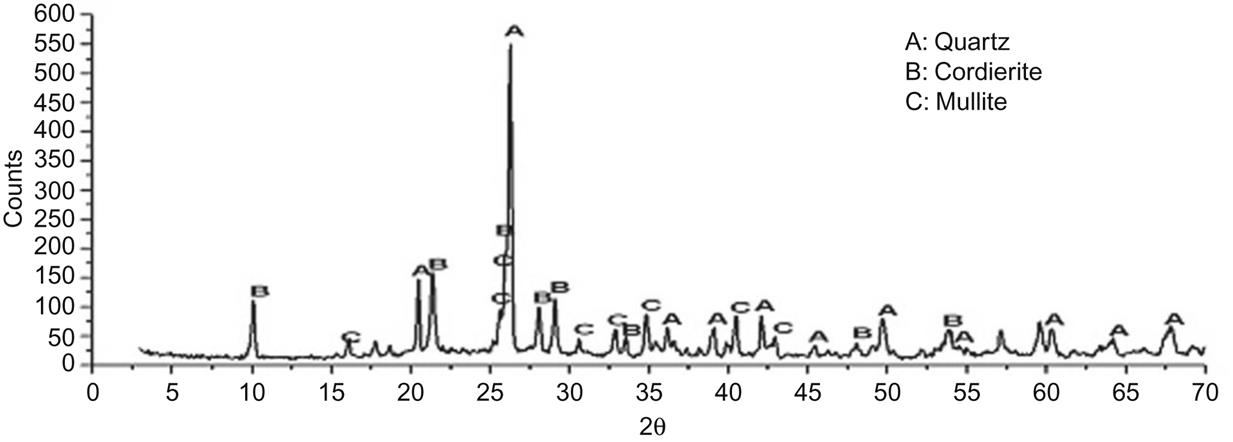
Being a fired material, its mineral compositions included quartz, mullite, and cordierite (Fig. 7.18), which help strengthen the framework of the product.
Limestone used in the experiment came from Yixing Jiangsu province, China. It is conducive to the reduction of the sintering temperature of ceramic tiles. Table 7.22 shows the ratios of raw materials for making ceramic tiles. Six samples of varied ratios without the addition of limestone were tested, and the sintering temperature exceeded 1000°C, which had an adverse effect on the stabilization of heavy metals. And then limestone was added to reduce the sintering temperature (Table 7.22). The sintering temperature was reduced to 960°C. Y7, Y8, Y9, and Y10 all result in good appearance and macro-performance. In order to increase the use of fly ash, Y10 was chosen as having the ideal ratio of raw materials.
Table 7.22
Ratios of Raw Materials (%) Used
| No. | Y1 | Y2 | Y3 | Y4 | Y5 | Y6 |
| Cream-colored clay | 55 | 50 | 45 | 40 | 35 | 30 |
| Fired clay | 40 | 40 | 40 | 40 | 40 | 40 |
| Fly ash | 5 | 10 | 15 | 20 | 25 | 30 |
| No. | Y7 | Y8 | Y9 | Y10 | Y11 | Y12 |
| Cream-colored clay | 55 | 50 | 45 | 40 | 35 | 30 |
| Fired clay | 30 | 30 | 30 | 30 | 30 | 30 |
| Limestone | 10 | 10 | 10 | 10 | 10 | 10 |
| Fly ash | 5 | 10 | 15 | 20 | 25 | 30 |

The method of making ceramic tiles is shown in Fig. 7.19. First, raw materials should be ground and then mixed with water. The mixed material should be left to stand for 18 h before screening, and then molded using a machine. Prior to the sintering process, the molded body should be dried at around 60°C.
Performances of the product based on the Y10 ratio, at different sintering temperatures, were studied in detail. Compressive strengths were measured in accordance with China GB4100-83. Fig. 7.20 shows the compressive strengths of the products at different sintering temperatures. It was indicated that when the ratio of fly ash was no more than 25%, MSWI fly ash was conducive to the improvement of compressive strength of the product sintered at temperatures between 920°C and 1060°C. However, when 25–30% fly ash was added, the compressive strength decreased when the sintering temperature exceeded 1000°C. Besides, the compressive strength of Y10 increased considerably as the temperature rose from 920 to 940°C. After 1000°C, it increased only slightly with the increase of temperature. The strengths achieved in Y10 met the requirements for ceramic tiles described in China GB4100-83.

Water absorption was measured following China GB2579-81 and China GB4100-83. Specific water absorption efficacies of the product at different sintering temperatures are shown in Fig. 7.21. It can be seen that, when it was no more than 20%, water adsorption of the product decreased with the increase in the ratio of MSWI fly ash. While, when 25–30% fly ash was added, water adsorption increased as the sintering temperature exceeded 980°C. Besides, water absorption at Y10 decreased as the temperature rose from 920 to 1020°C, while it showed little variation above 1020°C, resulting in a small porosity and strong density at 1020°C.

Table 7.23 shows specific deviations of the product at different sintering temperatures. It can be seen that all the products at Y10 proportions, sintered between 960°C and 1000°C, showed small shrinkage. Hence, the products sintered between 960°C and 1000°C exhibited excellent features.
Table 7.23
Shrinkage of a Product Sintered at Different Temperatures (mm) in the Presence of Fly Ash
| Temperature | 920 | 940 | 960 | 980 | 1000 | 1040 | 1080 |
| Length | 0.47 | 0.34 | 0.14 | 0.15 | 0.13 | −0.24 | −0.37 |
| Width | 0.23 | 0.12 | 0.12 | 0.06 | 0.03 | 0.09 | −0.24 |
| Thickness | 0.10 | 0.11 | 0.09 | 0.08 | 0.08 | −0.08 | −0.15 |
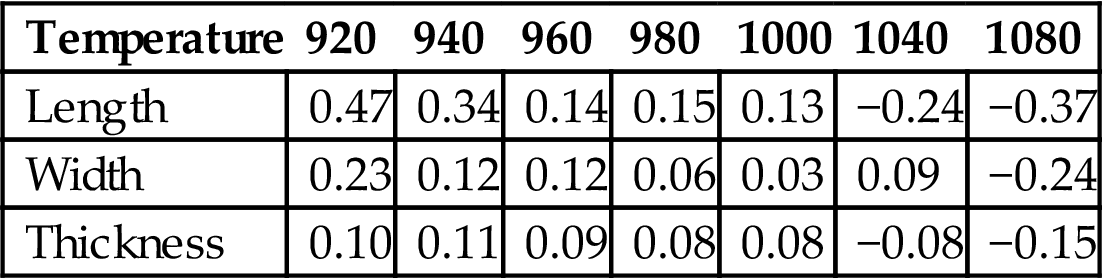
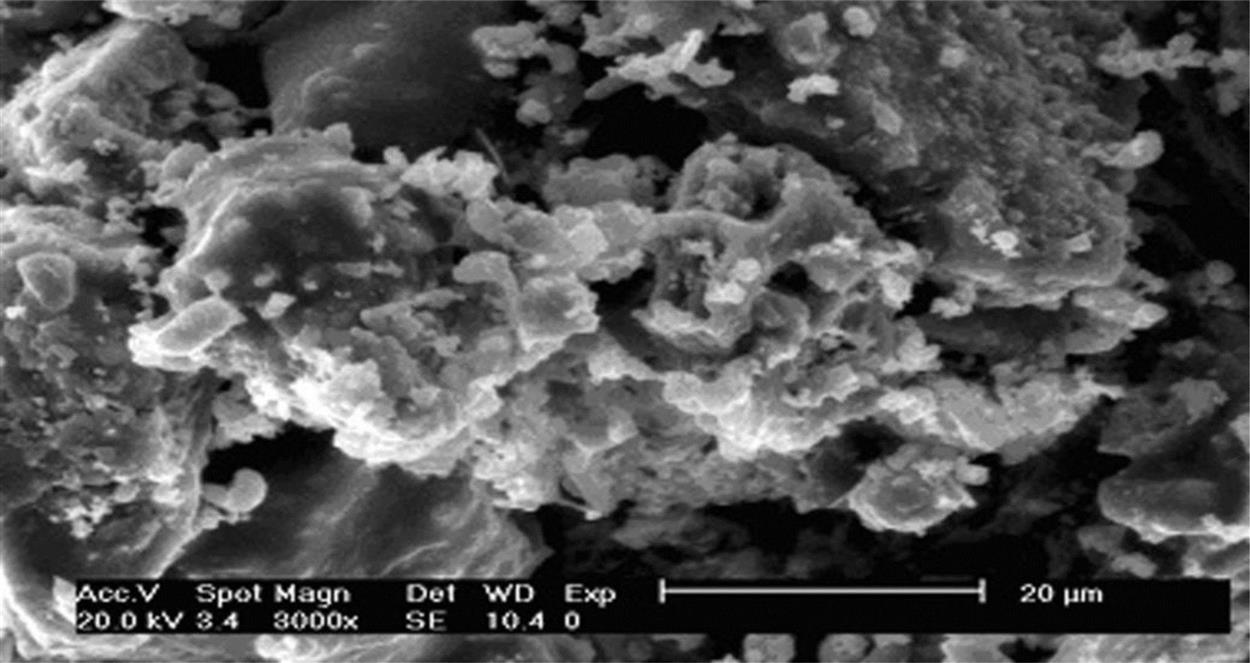
Fig. 7.22 shows an SEM analysis of ceramic tile sintered at 920°C. It was clear that the product sintered at 920°C had a relatively incompact structure with a lot of depressions in it, indicating a high rate of waste product. Interfaces among particles are clear-cut, without formation of continuous phases. In terms of macro-performance, compressive strength is relatively low and water absorption relatively high, which can be attributed to the decisive factor of large porosity of the product.
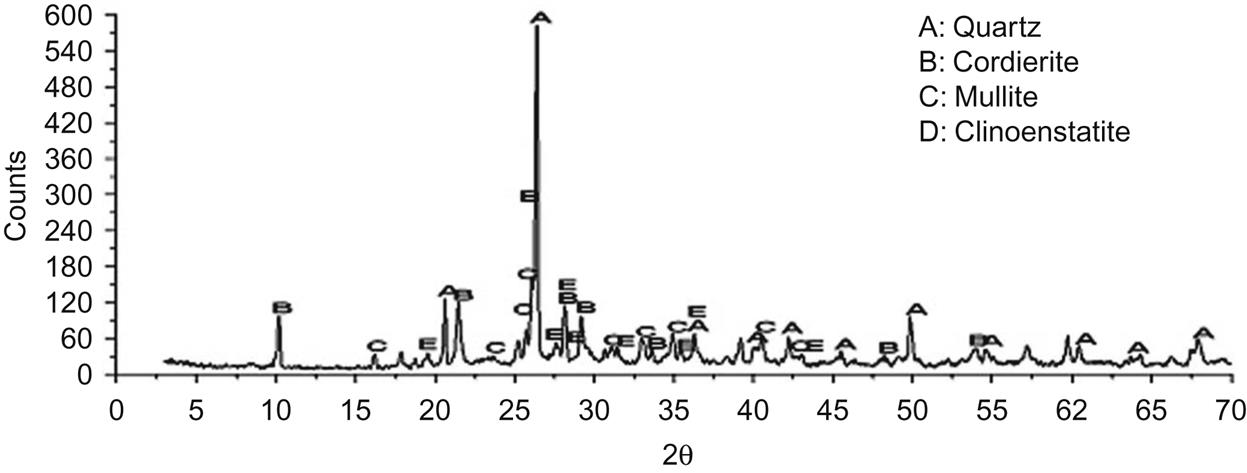
The major crystalline phases were quartz, cordierite, clinoenstatite, and mullite (Fig. 7.23). The diffraction peak of mullite was very obvious at d = 5.39, 3.428, 3.390×, 2.886, 2.694, 2.542, 2.206, and 2.121 Å, implying that mullite had been a major crystalline phase of the product at 920°C.
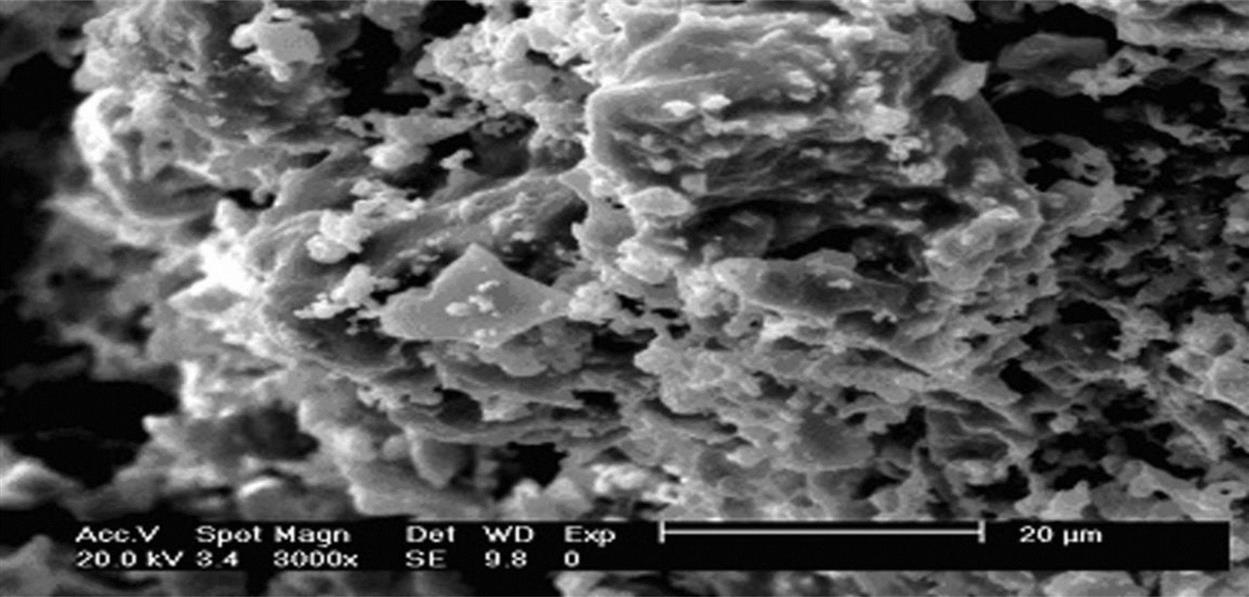
When the temperature rose to 940°C, mini-cracks on the surface of the product all disappeared, according to the SEM analysis of the product sintered at 940°C, as shown in Fig. 7.24. An obvious reaction can be seen at the interfaces of particles and the interfaces are much more obscure than those seen at 920°C. Hence, porosity decreased considerably and the density of the product increased, which may be attributed to particle migration through liquid phases with the increase of sintering temperature.
XRD analysis showed that the crystalline phases were quartz, cordierite, clinoenstatite, mullit, and andradite, registering an increase over those of 920°C (Fig. 7.25).

After being sintered at 960°C, the product featured a smooth and sound surface, high strength, and great hardness, all indicating good performance. From Fig. 7.26 (SEM analysis of the product sintered at 960°C), it can be seen that particles were closely connected together and covered with new output to form a continuous solid consisting of a large number of glass phases with an increase of temperature by tightly cementing particles. Meanwhile, heavy metals can be cemented by glass phases or immobilized in the firm crystal lattice so that they can hardly be leached out.

From the XRD analysis (Fig. 7.27), it was concluded that glass phases increased at 960°C, from those at 940°C. The major crystalline phases were still quartz, cordierite, clinoenstatite, mullit, and andradite, registering a reduction in content from those at 940°C.

SEM analysis and XRD analysis of the product sintered at 980°C are respectively shown in Figs. 7.28 and 7.29. The product showed a higher strength, smoother and darker surface, compared with the product sintered at 960°C. It was indicated that the product showed the characteristics of more sound sintering, when diffusion of crystal lattice and crystal interface as well as the surface diffusion proceeded together. In the SEM analysis of the product sintered at 980°C (Fig. 7.28), it was clear that particles were more closely cemented together and their interfaces were invisible. A hard solid whole with high strength was the result. Apparently, heavy metals had been more tightly fixed in the solid and can hardly be leached out even under acidic conditions.


From the XRD analysis at 980°C (Fig. 7.29), it was implied that content of crystalline phases continued to decrease and more glass phases formed, which was inconsistent with what can be seen in the SEM analysis.
Given the macro-performance of the product and stabilization of heavy metals, the product sintered at 960°C was chosen to test leaching toxicity. Leaching, in accordance with standard of HVEP, of Cd from the glazed tile was reduced to 0.53% of that from the body prior to sintering, Zn reduced to 0.59%, and Pb to 0.08%, as shown in Table 7.24. No Hg leaching was detected according to the HVEP standard. According to the ALT standard, leaching of Cd, Zn, Pb, and Hg from the glazed tile was reduced respectively to 0.51%, 2.72%, 0.01%, and 0.05% of that from the body prior to sintering. Hence, the use of fly ash in making glazed tiles is an effective way to stabilize such heavy metals as Cd, Hg, Pb, and Zn (Table 7.25).
Table 7.24
Leaching Toxicity of Heavy Metals According to the HVEP Standard (mg/L) of Glazed Tiles Containing Fly Ash
| Products No. | Cd | Hg | Pb | Zn | |
| Body prior to sintering | 1 | 0.016 | 0.110 | 7.697 | 6.342 |
| 2 | 0.023 | 0.092 | 6.935 | 8.431 | |
| 3 | 0.019 | 0.057 | 9.218 | 8.209 | |
| Av1 | 0.019 | 0.086 | 7.950 | 7.661 | |
| Glazed tile | 1 | ND | ND | 0.0012 | 0.0356 |
| 2 | ND | ND | 0.0072 | 0.0749 | |
| 3 | 0.0002 | ND | 0.0113 | 0.0247 | |
| Av2 | 0.0001 | ND | 0.0066 | 0.0451 | |
| Av2/Av1 | 0.0053 | 0 | 0.0008 | 0.0059 | |
| Limit | 0.3 | 0.05 | 3 | 50 | |
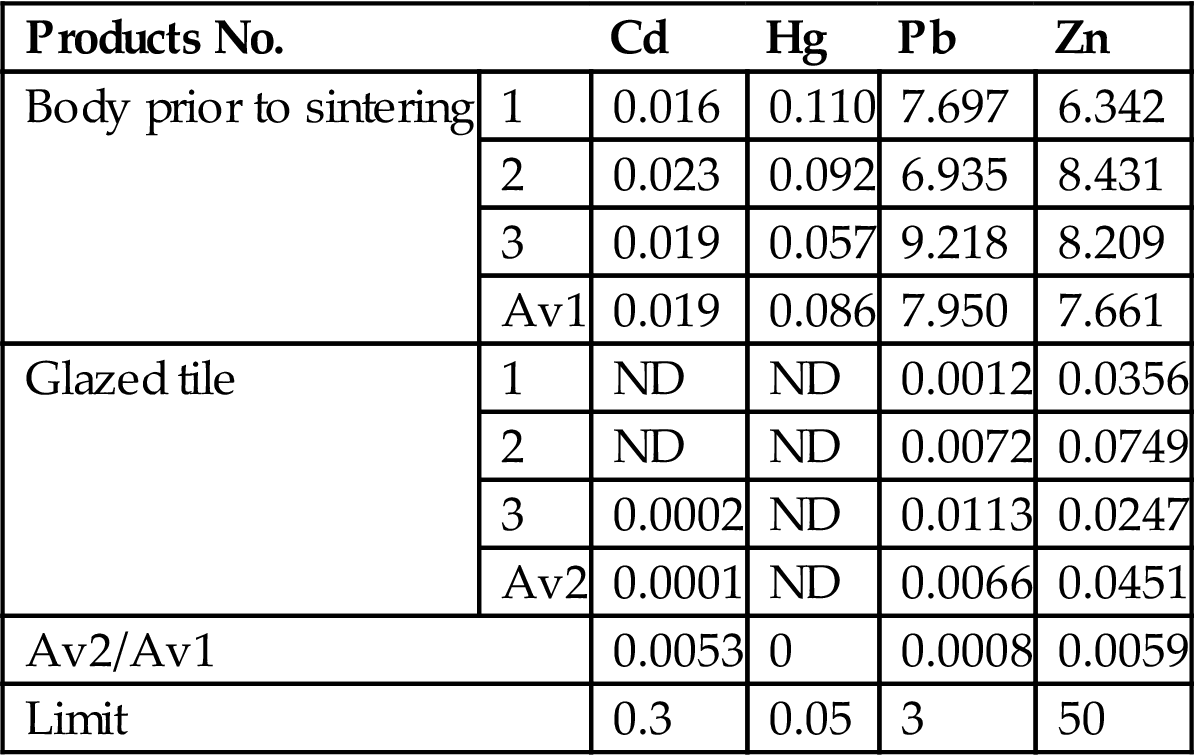
Table 7.25
Leaching Toxicity of Heavy Metals According to the ALT Standard (mg/kg) of Glazed Tile Containing Fly Ash
| Products No. | Cd | Hg | Pb | Zn | |
| Body prior to aintering | 1 | 5.921 | 0.252 | 133.7 | 331.5 |
| 2 | 4.398 | 0.098 | 101.7 | 346.8 | |
| 3 | 6.002 | 0.276 | 98.1 | 298.2 | |
| Av1 | 5.440 | 0.209 | 111.2 | 325.5 | |
| Glazed tile | 1 | 0.050 | ND | 0.0122 | 9.231 |
| 2 | 0.034 | 0.0001 | 0.0143 | 8.340 | |
| 3 | ND | 0.0003 | 0.0013 | 9.025 | |
| Av2 | 0.028 | 0.0001 | 0.0093 | 8.865 | |
| Av2/Av1 | 0.0051 | 0.0005 | 0.0001 | 0.0272 | |
| Limit | 3 | 0.5 | 30 | 500 | |

Note: “Av1” and “Av2” in Table 7.24 and 7.25 represent the average value of three times. “ND” means that no leaching toxicity is detected.
From the sequential chemical extraction results given in Fig. 7.30, it was clear that Cd, Hg, Pb, and Zn existed mainly in the residue phase, and only a small portion of them can be extracted. Hence, the leaching toxicity of Cd, Hg, Pb, and Zn was greatly reduced in the product sintered at 960°C, compared with MSWI fly ash.

The presence and level of dioxins in the product is unfortunately not tested at present. Dioxins can decompose at 900°C-plus into innocent substances, which are discharged quickly and will not recompose into dioxins. Through leaching toxicity analysis by HVEP and ALT standards, it is concluded that the major hazardous heavy metals of sampled MSWI fly ash Are Hg, Pb, Zn, and Cd. Consequently, their leaching toxicity should be reduced during its recycling or in its disposal. As major constituents of the sampled fly ash are glass phases, silicates, aluminum silicates, and quartz, it can be used as a base for ceramic tiles. Through sintering at 960°C-plus, heavy metals can be cemented into the solid lattice in the product, which is very strong. Consequently, leaching toxicities of Hg, Pb, Zn, and Cd can be substantially reduced.
A leaching analysis in accordance with the HVEP standard indicates that leaching of Cd from the glazed tile is reduced to 0.53% of that from the body prior to sintering, of Zn to 0.59%, and of Pb 0.08%, and no Hg is detected in the leachate. A leaching analysis in accordance with the ALT standard shows that leaching of Cd, Zn, Pb, and Hg from the glazed tile is reduced respectively to 0.51%, 2.72%, 0.01%, and 0.05% of that from the body prior to sintering. Hence, the use of fly ash in making glazed tiles is an effective way to stabilize such heavy metals as Cd, Hg, Pb, and Zn.
Sequential chemical extraction shows that, through sintering at 960°C, specifications of Hg, Pb, Zn, and Cd are largely changed. Only a small portion of these heavy metals exists in the soluble phase, which is the reason why Hg, Pb, Zn, and Cd register a low leaching toxicity in the product. With the increase in temperature, crystalline phase content levels first rises and then fall, while the glass phases register a reverse trend. The major phases of the product are quartz, cordierite, clinoenstatite, mullit, and andradite. The product sintered at 960°C-plus boasts sound macro-performances and can be used widely in construction.
7.11 Pilot Scale Test for Production of Facing Brick Using Fly Ash
This test was carried out in the Yixing Changzheng ceramics factory, Jiangsu Province, China. Two kinds of facing brick, named R series (red, including fly ash, red mud, and sand tank) and Y series (yellow, including fly ash, cream-colored clay, and fired clay) were selected in both lab scale and pilot scale.
The main factors affecting sintering are the material ratio, sintering temperature, sintering time, and particle size. In addition, the crystal structure of the particles, sintering atmosphere, and additives will have some influence on the sintering process. Generally, the smaller the particle size the greater the reaction activity, and the sintering process will ultimately be much easier. Therefore, something that changes the crystal structure of raw materials will affect the sintering.
Nowadays, hot-pressing sintering is more and more popular owing to the low sintering temperature and dense body. Hot pressure can provide extra driving force to replace the offset surface tension, hence the sintering process can continue, or even accelerate in some ways. However, this pilot scale test used the cold-pressing technique in order to reduce the cost.
7.11.1 Material Proportion
Changzheng ceramics factory had only two calcination temperature ranges, namely 1100–1150°C and 1050–1100°C. The calcination temperature is higher, so there is no need to use feldspar, which shows a good performance on fluxing. The calcite was selected and two groups of material proportions were designed (Tables 7.26 and 7.27).
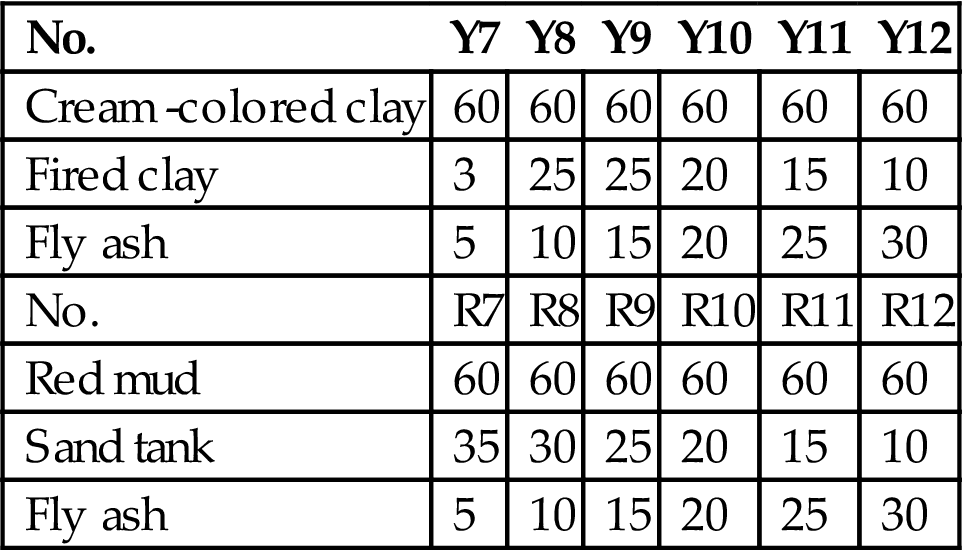
Table 7.26
Pilot Ratio (I) for Production of Facing Brick Using Fly Ash (%)
| No. | Y1 | Y2 | Y3 | Y4 | Y5 | Y6 |
| Cream -colored clay | 60 | 60 | 60 | 60 | 60 | 60 |
| Fired clay | 30 | 25 | 20 | 15 | 10 | 5 |
| Fly ash | 5 | 10 | 15 | 20 | 25 | 30 |
| Calcite | 5 | 5 | 5 | 5 | 5 | 5 |
| No. | R1 | R2 | R3 | R4 | R5 | R6 |
| Red mud | 60 | 60 | 60 | 60 | 60 | 60 |
| Sand tank | 30 | 25 | 20 | 15 | 10 | 5 |
| Fly ash | 5 | 10 | 15 | 20 | 25 | 30 |
| Calcite | 5 | 5 | 5 | 5 | 5 | 5 |

7.11.2 Status and Compressive Strength of the Products
Group I was first processed in two different temperature ranges and results are shown in Table 7.28. At 1100–1150°C, both Y1 and R1 were in good condition and reached a MU20MPa standard but other samples showed the over-burning phenomenon in different degrees. In another temperature range, the addition of fly ash lowered the sintering temperature so that more products such as Y1, Y2, Y3, and R1, R2 were seen.
Table 7.28
Group I: Sintering Status and Compressive Strength
| 1100–1150 | Y1 | Y2 | Y3 | Y4 | Y5 | Y6 |
| Sintering status | Good | Slightly overburned | Overburned | Seriously overburned | Seriously overburned | Seriously overburned |
| Compressive strength (MPa) | 24.3 | 23.9 | – | – | – | – |
| 1100–1150°C | R1 | R2 | R3 | R4 | R5 | R6 |
| Sintering status | Good | Overburned | Seriously overburned | Seriously overburned | Seriously overburned | Seriously overburned |
| Compressive strength (MPa) | 23.1 | 22.5 | – | – | – | – |
| 1050–1100°C | Y1 | Y2 | Y3 | Y4 | Y5 | Y6 |
| Sintering status | Good | Good | Good | Slightly overburned | Overburned | Seriously overburned |
| Compressive strength (MPa) | 23.8 | 22.3 | 21.9 | – | – | – |
| 1050–1100°C | R1 | R2 | R3 | R4 | R5 | R6 |
| Sintering status | Good | Good | Slightly overburned | Overburned | Seriously overburned | Seriously overburned |
| Compressive strength (MPa) | 22.2 | 21.1 | 20.5 | – | – | – |

No calcite was added to group II, in order to increase the calcination temperature of the product to improve its sintering status(Table 7.29). After calcination at 1100 to 1150°C, the sintering conditions of Y7 to Y9 and R7 to R8 were better, their compressive strength reached the level of MU20MPa. Meanwhile, at 1050 to 1100°C, Y7–Y10 and R7–R9 were good, so Y10, R9 at 1050–1100°C was the set of conditions selected for the follow-up test.
Table 7.29
Group II: Sintering Status and Compressive Strength
| 1100–1150°C | Y7 | Y8 | Y9 | Y10 | Y11 | Y12 |
| Sintering status | Good | Good | Good | Slightly overburned | Overburned | Seriously overburned |
| Compressive strength (MPa) | 23.7 | 22.9 | 22.1 | 21.8 | – | – |
| 1100–1150°C | R7 | R8 | R9 | R10 | R11 | R12 |
| Sintering status | Good | Good | Slightly overburned | Overburned | Seriously overburned | Seriously overburned |
| Compressive strength (MPa) | 22.1 | 21.9 | 21.6 | – | – | – |
| 1050–1100°C | Y7 | Y8 | Y9 | Y10 | Y11 | Y12 |
| Sintering status | Good | Good | Good | Good | Slightly overburned | Overburned |
| Compressive strength (MPa) | 22.1 | 21.8 | 21.2 | 21.2 | – | – |
| 1050–1100°C | R7 | R8 | R9 | R10 | R11 | R12 |
| Sintering status | Good | Good | Good | Slightly overburned | Overburned | Overburned |
| Compressive strength (MPa) | 20.2 | 20.5 | 19.5 | – | – | – |

7.11.3 Comparison of Properties Between Y10, R9, and Laboratory Products
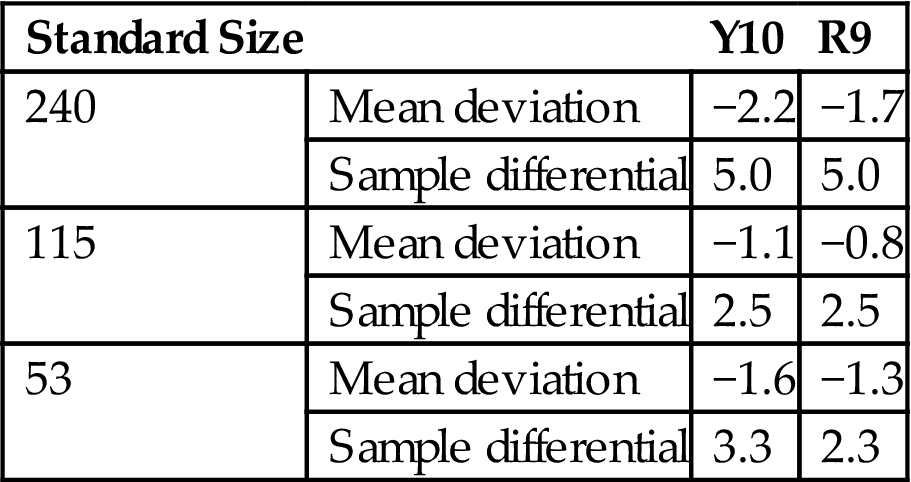
The size deviation of Y10 and R9 met the requirements for first-class ceramic tiles (GB5101-2003). Compared with laboratory products Y900–Y1000, Y10 and R9 appear to have a greater proportion of negative deviation (Table 7.30).
Table 7.30
Size Deviation of R9 and Y10 (mm)
| Standard Size | Y10 | R9 | |
| 240 | Mean deviation | −2.2 | −1.7 |
| Sample differential | 5.0 | 5.0 | |
| 115 | Mean deviation | −1.1 | −0.8 |
| Sample differential | 2.5 | 2.5 | |
| 53 | Mean deviation | −1.6 | −1.3 |
| Sample differential | 3.3 | 2.3 |
Both Y10 and R9 met the requirements of GB5101-2003. Compared with the laboratory products Y900–Y1000, the qualities of appearance of Y10 and R9 were better (Table 7.31).
Table 7.31
Appearance Qualities of Y10 and R9 (mm)
| Products | Surface Elevation | Bend | High Impurity Convexity | Edge and Angle Drop | Crackle I | Crackle II | Full face | Color |
| Y10 | 1.3 | 1.7 | 1.9 | 3 | 21 | 16 | One face and one top | Basically consistent |
| R9 | 1.1 | 2.0 | 1.5 | 5 | 18 | 32 | Two faces and one top | Basically consistent |

Note: crack I is the length of surface across the tile and extending to the surface of the strip. Crack II refers to the length of surface along the tile and extending to the top surface of the length, or the length of the horizontal crack on the top surface.
3. Compressive strength and flexural strength
Compressive strengths and flexural strengths of Y10 and R9 are shown in Table 7.32. Compared with the laboratory products Y900–Y1000, the compressive strengths and flexural strengths of Y10 and R9 were better. The compressive strength of Y10 had reached the strength grade of MU20M.
Table 7.32
Compressive Strengths and Flexural Strengths of Y10 and R9
| Products | Mean Compressive Strength (MPa) | Standard Deviation (S) | δ | Mean Compressive Strength (MPa) | Flexural Strength (MPa) |
| Y10 | 21.2 | 7.6 | 0.17 | 20.9 | 4.6 |
| R9 | 19.5 | 8.2 | 0.11 | 19.3 | 4.5 |

4. Water absorption rate, saturation coefficient and frost resistance test
Compared with the laboratory products Y900–Y1000, water absorption rates and saturation coefficients for Y10 and R9 were smaller, and frost resistance test decreases were relatively small, which meant that the antiweathering ability was greater than that of the products from the pilot scale tests(Table 7.33).
Table 7.33
Water Absorption Rate (W24), Saturation Coefficient, and Loss of Quality after Frost Resistance Tests Y10, R9 (%)
| Products | Mean Water Absorption Rate W24 | Mean Saturation Coefficient | Maximum Saturation Coefficient | Loss of Quality after Frost Resistance Test |
| Y10 | 5.1 | 0.69 | 0.74 | 1.3 |
| R9 | 4.9 | 0.64 | 0.68 | 1.1 |

5. Other characteristics
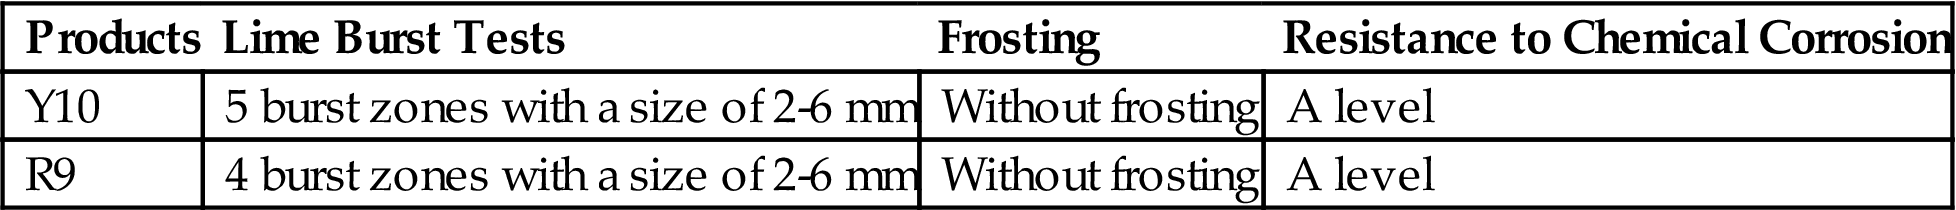
The levels of risk of lime burst and frost damage in Y10 and R9 met the requirements of first-class products and superior products based on GB5101-2003. Resistance to chemical corrosion was at A level (Table 7.34). Compared with the laboratory products Y900–Y1000, risk of lime burst and degree of efflorescence in Y10 and R9 were smaller.
Table 7.34
Other Performance Indicators of Y10 and R9
| Products | Lime Burst Tests | Frosting | Resistance to Chemical Corrosion |
| Y10 | 5 burst zones with a size of 2-6 mm | Without frosting | A level |
| R9 | 4 burst zones with a size of 2-6 mm | Without frosting | A level |
It was concluded that the properties of brick products from the pilot test were far superior to those from the laboratory because the laboratory experiments were conducted in a reducing atmosphere while the pilot test was performed in an oxidizing atmosphere, which contributed to the formation of cation vacancy and was beneficial for sintering.
7.11.4 Comparison of Microstructure Between Y10, R9, and Laboratory Products
The SEM graph showed that after burning at 1050–1100°C, the structures of Y10 and R9 were more compact than those of laboratory products and a large number of crystal phases existed, as shown in Fig. 7.31. The XRD patterns showed that the main crystal phase of Y10 was quartz, mullite, cordierite, enstatite, calcium silicate stone, and calcium-iron garnet stone, as shown in Fig. 7.32.


Mullite content of Y10 was 108 counts. In the glass phase it was 53 counts, which accounted for 49.2% of the total amount of mullite; the quartz content was 648 counts, which accounted for 13.7% of the total in the sample phase; this suggests that the proportion of crystalline phase was relatively large and the vast majority was crystalline aluminosilicate phase. Compared with the XRD pattern of the laboratory products, the vitrification degree of Y10 products was bigger.
XRD patterns of the R9 product (Fig. 7.33) showed that in mullite content of a total number of 78 counts, glass phase accounts for 52.8% of total mullite; quartz peak intensity accounts for 562 counts, in the sample phase 11.7% of the total; this suggested that the samples in the crystalline phase made up a relatively small proportion, and vitrified more seriously than Y10.

7.11.5 Requirements for Dioxin Destruction
Because of the difficulty and high cost of the detection of dioxins, no more data about dioxins is available in this pilot test. The evidence to date indicates that the heat treatment method for dioxin is effective. The melting point of dioxin is 302–305°C, and when it comes to 500°C, it begins to decompose. At 800°C, dioxin will be completely decomposed in 21 s. Dioxin decomposition and burning time was proportional to temperature and transparent burning rate. If dioxin stayed at 700°C for 30 min, treatment efficiency could reach more than 99.7%. In this test, the burning temperature was above 900°C and the residence time was 30 min. It can be speculated that the products of this test contained hardly any dioxins.
In order to prevent the volatilization of dioxins, the roller kiln sintering method was used. The roller kiln used the method of rapid temperature increase, so that the sintering process was completed in just 2 h. In this way, not only will dioxins and heavy metals be prevented from volatilizing in the slow heating period, but also much time will be saved. The dioxin in sintering flue gas can be destroyed by connecting several roller kilns in a series, that is, flue gas from a roller kiln was conducted into another roller kiln and was burned again for the thorough destruction of dioxins.
7.11.6 Economic Evaluation of Making Facing Brick with Fly Ash
The production of ceramic tiles with fly ash was not only to save the high disposal costs per annum but also to profit from ceramic tile sales. Therefore, from the point of view of the utilization of waste and the perspective of high demand for building materials which meet the requirements of the domestic and international markets, ceramic tile production has brought considerable economic benefits and has profound social significance. Specific cost accounting is shown in Table 7.35.
Table 7.35
Cost Accounting of Fly Ash Facing Brick
| Project | Remarks | Amount | Unit | Unit Price | Total Price (million RMB) |
| Fly ash content | 100,000 m2/a | 200 | Ton | ||
| Other l materials | 100,000 m2/a | 2000 | Ton | 58.5 RMB/t | 0.117 |
| Glaze | Cover bottom glaze | 50 | Ton | 4160 RMB/t | 0.208 |
| Coal | To gage roller kiln | 700 | Ton | 247 RMB/t | 0.172 |
| Electricity | Dry production | 30 | Degree | 0.5 RMB/degree | 1.5 |
| Wage | Social welfare included | 60 | Person | 20,000/people | 1.20 |
| Scrap rate | 5%, cost was 15 RMB/m2, 10 × 15 × 5% | 0.163 | |||
| Mechanical depreciation | 10%, 100 × 10% | 0.10 | |||
| Depreciation of civil construction | 10%, 200 × 10% | 0.20 | |||
| Tax and management fees | After deducting the purchase of the original and the fuel section | 0.264 | |||
| Total | 2.574 | ||||
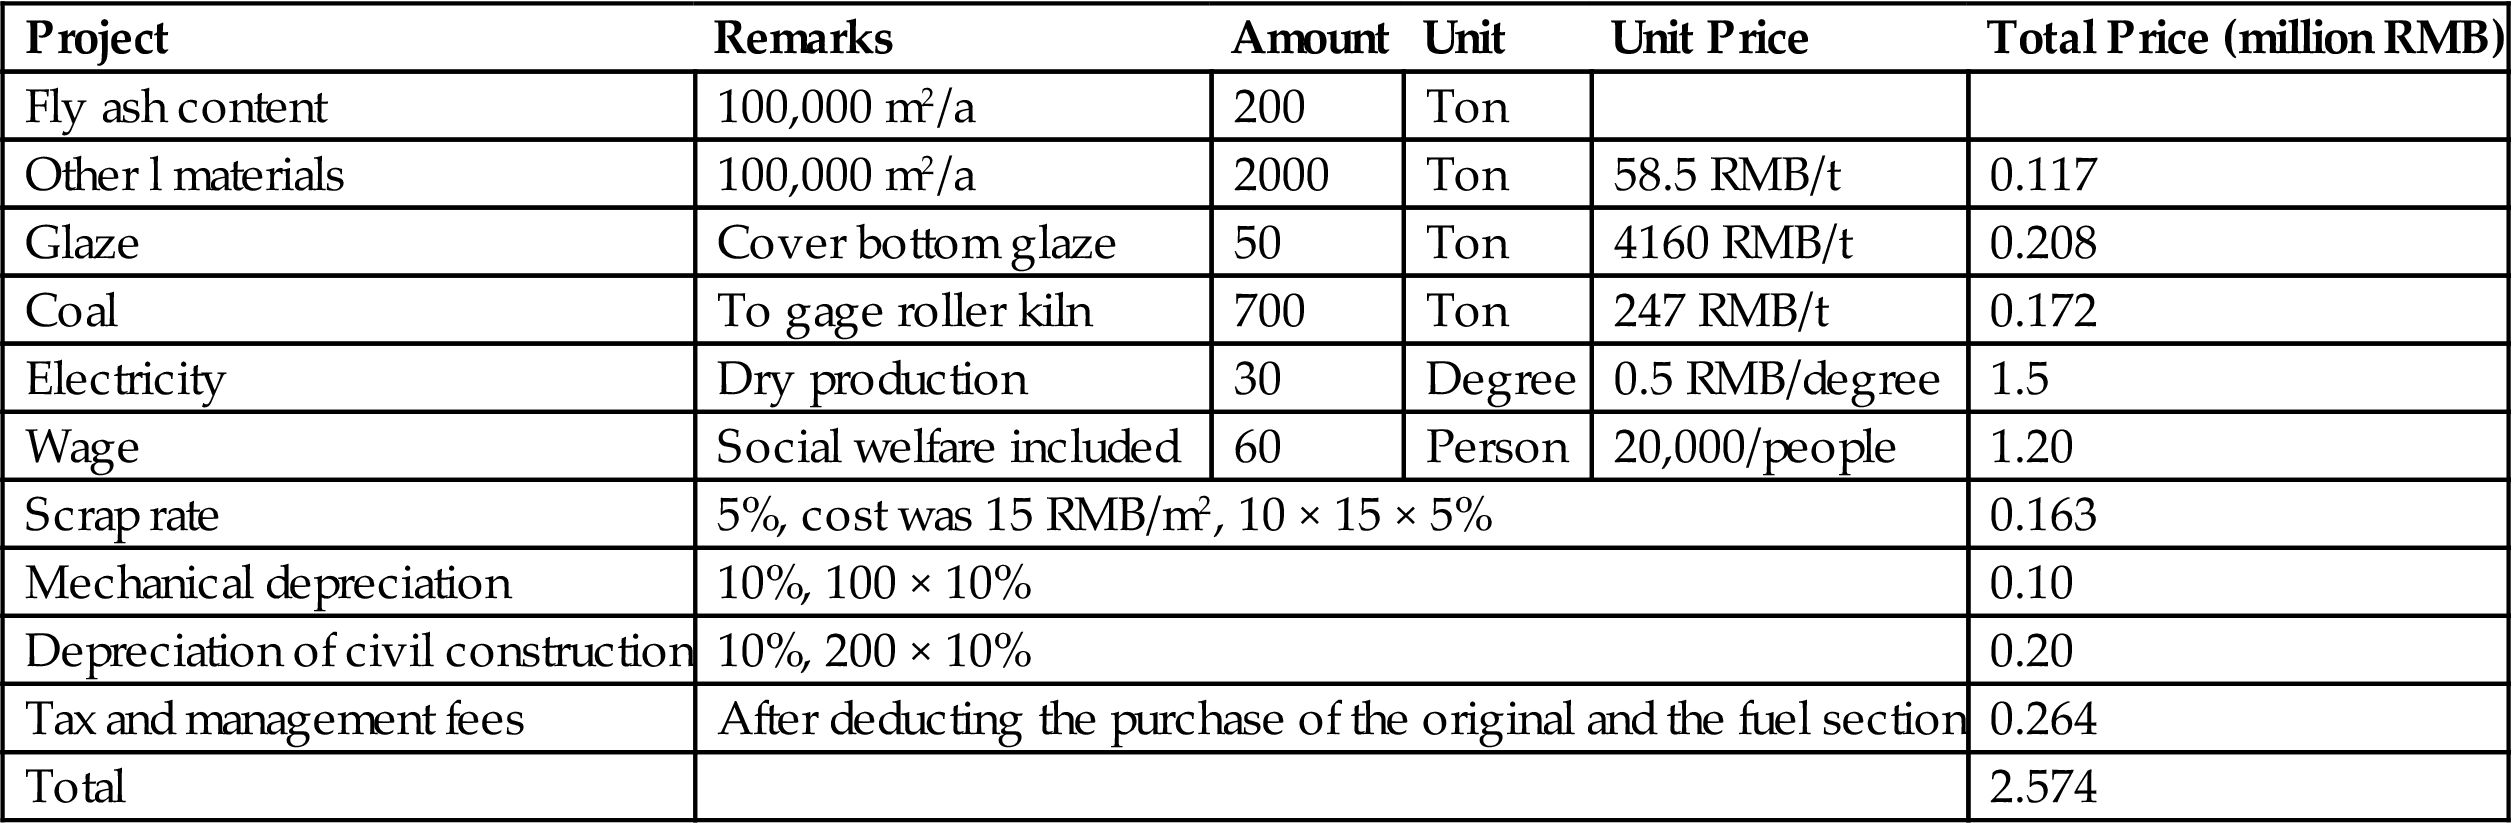
From the table it can be seen that the total cost was 2.574 million RMB/100,000 m2, which means the unit cost was 25.7 RMB/m2. The sale price was 35 RMB/m2. The profits were 9.3 RMB/m2. The total annual output value was 3.5 million RMB. The total profit was 0.93 million RMB. In addition, ash consumption quantity amounted to 2000 t/y, which means saving 5.4 million RMB for fly ash disposal.
7.11.7 Safety Evaluation of Fly Ash Facing Brick
Environmentally friendly materials are the way forward in materials development. So-called environmentally friendly materials should not only perform well but also be environmentally safe, or have the capacity to improve the environment. Those materials perform well or are very functional, with little resource and energy consumption, and produce no environmental pollution. Characteristically they coexist with the use of good energy and there are no side effects impacting the environment.
The results of product performance tests showed that product performance at 940–1000°C is better, so for this safety test those products were selected. Tests for the pollution characteristics of heavy metals and leaching toxicity were performed.
Surface leaching toxicity is an important index for ceramic product safety testing. The United States carries out leaching experiments using 4% acetic acid solution and boiling for 24 h, when the dissolution content of Pb should be no more than 1 mg/250 cm2. In Switzerland, the leaching amount does not exceed 3 mg/100 cm2. Thus, generally 4% acetic acid solution is used as leaching solution. Therefore, for this experiment the leaching agent with 4% acetic acid solution was chosen.
In order to analyze the content of heavy metal in fly ash at different sintering temperatures, the leaching concentration was compared before and after sintering (Tables 7.36–7.38, Fig. 7.34). The heavy metals were mainly from fly ash, except Zn, and the concentration was reduced with the increase of sintering temperature. Specifically, the volatilization of Pb, Cd, As, and Hg played a big part in the decrease of heavy metals. The sintering process can solidify and stabilize heavy metals to avoid leaching and volatilizing (Tables 7.39 and 7.40).
Table 7.36
Comparison of Metal Content in the Finished Product and the Body Weight of the Green Body (mg/kg)
| Heavy Metal | Blank | 20% Fly Ash | Y940 | Y960 | Y980 | Y1000 | Y20 |
| As | 35.63 | 33.28 | 23.87 | 21.73 | 19.60 | 16.75 | 12.47 |
| Zn | 1436 | 835.9 | 1258 | 1245 | 1223 | 1203 | 1188 |
| Hg | 4.63 | 4.78 | 2.13 | 1.94 | 1.62 | 1.25 | 0.65 |
| Pb | 317.2 | 292.8 | 215.70 | 187.15 | 149.08 | 130.05 | 101.50 |
| Cd | 7.01 | 6.56 | 5.40 | 4.70 | 4.14 | 3.43 | 3.01 |
| Ni | 42.4 | 20.98 | 41.85 | 71.75 | 71.45 | 71.16 | 71.08 |
| Cr | 74.2 | 69.1 | 72.05 | 189.60 | 194.00 | 258.40 | 254.00 |
| Cu | 297.1 | 228.12 | 291.65 | 290.17 | 288.68 | 288.09 | 287.50 |
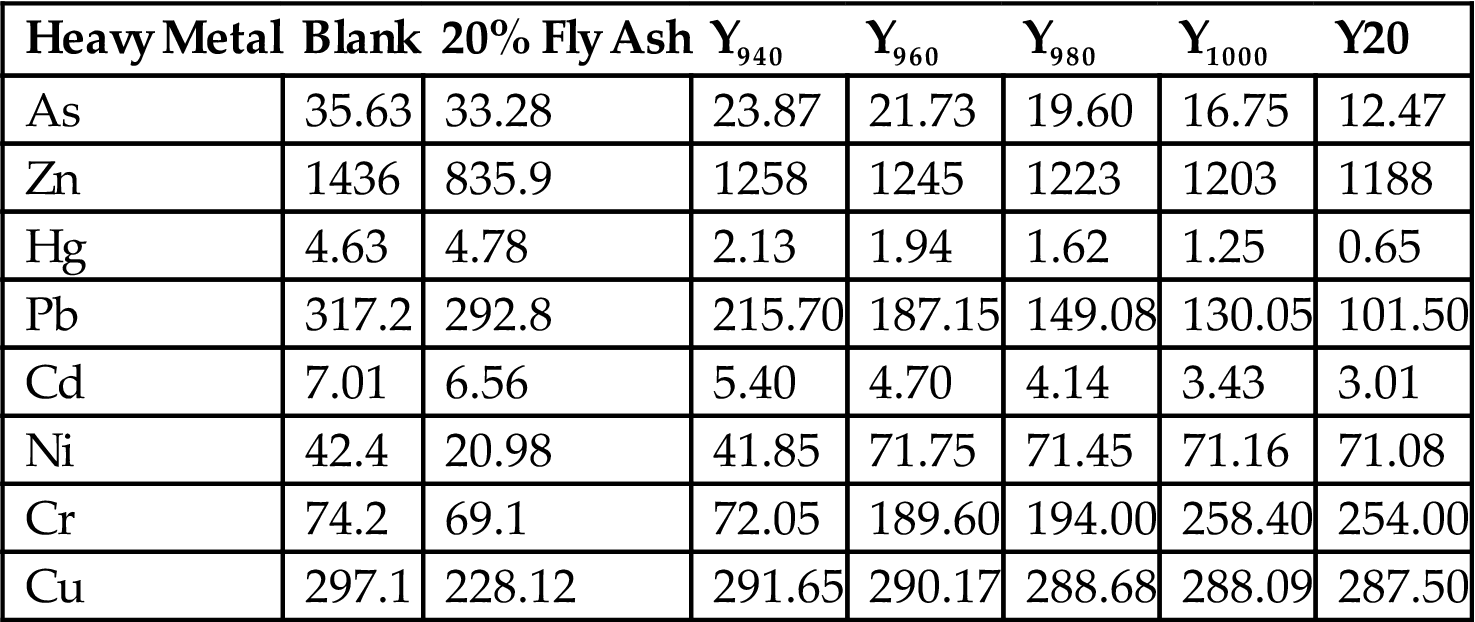
Table 7.37
Surface Leaching of Heavy Metals from Fly Ash Ceramic Facing Brick (mg/cm2)
| Time | No. | As | Zn | Hg | Pb | Cd | Ni | Cu | Cr |
| 4d | Y940 | 0.0024 | 0.0970 | 0.0030 | 0.0120 | 0.0003 | 0.0022 | 0.0130 | 0.0190 |
| Y960 | 0.0013 | 0.0850 | ND | 0.0080 | ND | 0.0019 | 0.0080 | 0.0120 | |
| Y980 | 0.0006 | 0.0590 | ND | 0.0050 | ND | 0.0013 | 0.0050 | 0.0090 | |
| Y1000 | ND | 0.0390 | ND | ND | ND | 0.0008 | 0.0030 | 0.0050 | |
| Y20 | ND | 0.015 | ND | ND | ND | ND | ND | ND | |
| 2 × 4d | Y940 | 0.0006 | 0.0281 | 0.001 | 0.0044 | ND | 0.0007 | 0.0033 | 0.0062 |
| Y960 | 0.0004 | 0.0256 | ND | 0.0037 | ND | 0.0007 | 0.0021 | 0.0041 | |
| Y980 | 0.0002 | 0.0191 | ND | 0.0024 | ND | 0.0005 | 0.0015 | 0.0033 | |
| Y1000 | ND | 0.0141 | ND | ND | ND | 0.0003 | 0.0010 | 0.0022 | |
| Y20 | ND | 0.0063 | ND | ND | ND | ND | ND | ND | |
| 3 × 4d | Y940 | 0.0003 | 0.0020 | ND | 0.0023 | ND | 0.0003 | 0.0019 | 0.0024 |
| Y960 | ND | 0.0012 | ND | 0.0013 | ND | ND | 0.0008 | 0.0018 | |
| Y980 | ND | 0.0009 | ND | 0.0009 | ND | ND | 0.0005 | 0.0013 | |
| Y1000 | ND | 0.0006 | ND | ND | ND | ND | ND | ND | |
| Y20 | ND | ND | ND | ND | ND | ND | ND | ND |
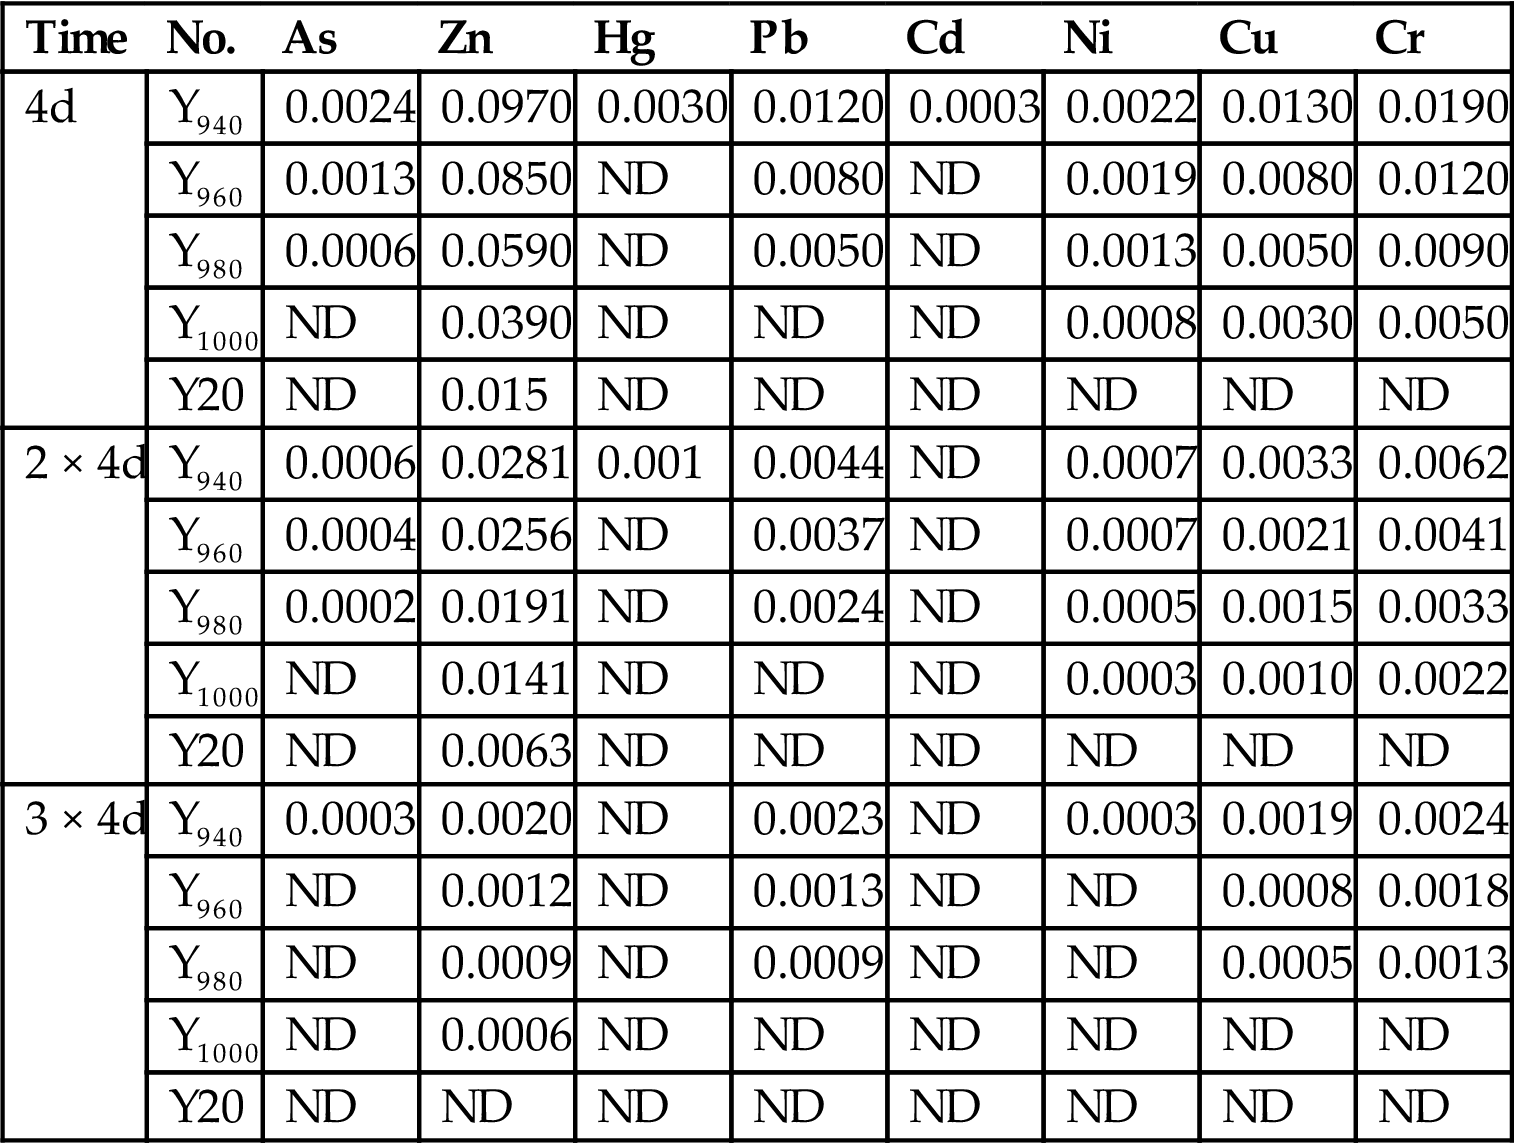
Table 7.38
Test Results of Horizontal Leaching of Products (mg/L)
| Element | Body | Y940 | Y960 | Y980 | Y1000 | Y1020 | Standard Limitations |
| As | 0.0046 | 0.0025 | 0.0022 | 0.0004 | ND | ND | 1.5 |
| Zn | 6.34 | 0.3571 | 0.3566 | 0.138 | 0.0863 | 0.0858 | 50 |
| Hg | 0.11 | 0.013 | 0.001 | 0.0002 | ND | ND | 0.05 |
| Pb | 7.69 | 0.0743 | 0.0461 | 0.0141 | 0.0073 | ND | 3 |
| Cd | 0.016 | 0.0003 | ND | ND | ND | ND | 0.3 |
| Ni | 0.01 | 0.0057 | 0.0049 | 0.004 | ND | ND | 10 |
| Cr | 0.186 | 0.035 | 0.051 | ND | ND | ND | 10 |
| Cu | 0.045 | 0.0234 | 0.0175 | 0.0012 | ND | ND | 50 |

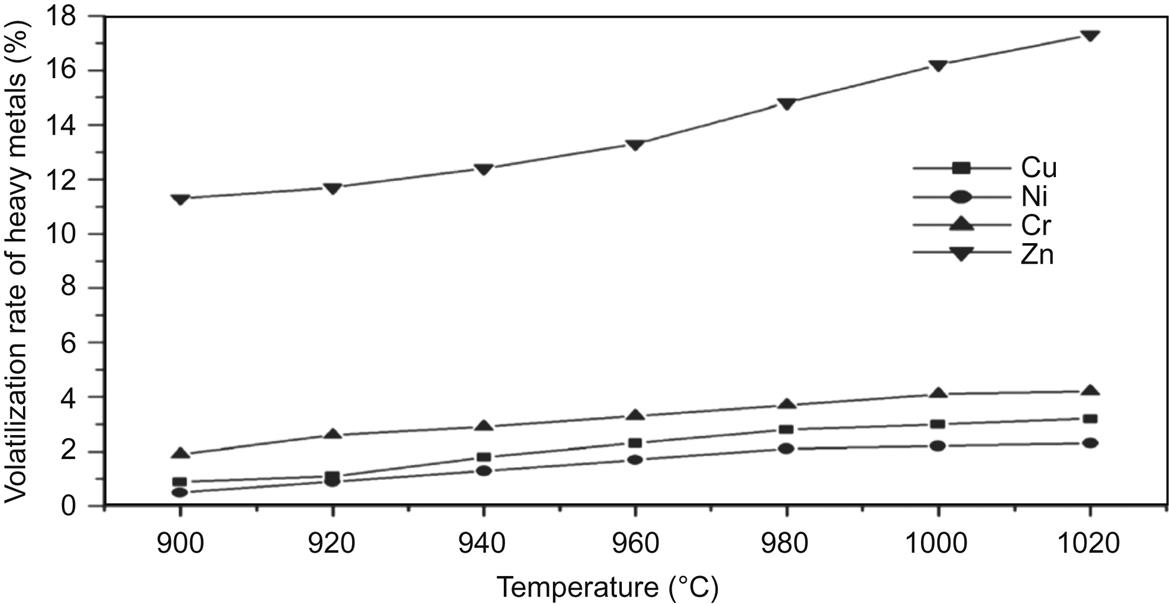
Table 7.39
Comparison of the Leaching Ability of Heavy Metals in the Product and the Blank
| Element | Horizontal Leaching Results | Effective Leaching Results | ||||||
| Y940/Blank | Y960/Blank | Y980/Blank | Y940/Blank | Y960/Blank | Y980/Blank | Y1000/Blank | Y20/Blank | |
| As | 0.543 | 0.478 | 0.087 | 0.4220 | 0.2360 | 0.0750 | 0.0700 | 0.0560 |
| Zn | 0.056 | 0.056 | 0.022 | 0.0668 | 0.0667 | 0.0354 | 0.0352 | 0.0292 |
| Hg | 0.118 | 0.009 | 0.002 | 0.4653 | 0.0346 | 0.0012 | – | – |
| Pb | 0.010 | 0.006 | 0.002 | 0.0074 | 0.0042 | 0.0025 | 0.0019 | 0.0009 |
| Cd | 0.018 | – | – | 0.0291 | 0.0274 | 0.0137 | 0.0086 | – |
| Ni | 0.57 | 0.49 | 0.40 | 0.1123 | 0.1096 | 0.0909 | 0.0829 | 0.0668 |
| Cr | 0.188 | 0.274 | – | 0.3068 | 0.2092 | 0.0878 | 0.0868 | 0.0580 |
| Cu | 0.52 | 0.388 | 0.027 | 0.4221 | 0.2356 | 0.0747 | 0.0702 | 0.0560 |

Table 7.40
Test Results of Effective Extraction of Products (mg/kg)
| Element | Blank | Y940 | Y960 | Y980 | Y1000 | Y20 | Standard Limitations |
| As | 1.63 | 0.688 | 0.384 | 0.1217 | 0.1145 | 0.0913 | 15 |
| Zn | 327.2 | 21.86 | 21.82 | 11.59 | 11.53 | 9.564 | 500 |
| Hg | 0.26 | 0.121 | 0.009 | 0.0003 | ND | ND | 0.5 |
| Pb | 134.7 | 1.01 | 0.56 | 0.34 | 0.25 | 0.12 | 30 |
| Cd | 5.842 | 0.17 | 0.16 | 0.08 | 0.05 | ND | 3 |
| Ni | 3.74 | 0.42 | 0.41 | 0.34 | 0.31 | 0.25 | 100 |
| Cr | 7.79 | 2.39 | 1.63 | 0.684 | 0.676 | 0.452 | 100 |
| Cu | 12.35 | 6.66 | 6.51 | 2.76 | 2.64 | 1.23 | 500 |
