Characterization of Heavy Metals and Dioxins in Fly Ash
Abstract
Fly ash is a hazardous material and of great concern due to the leaching behavior. Compositions of heavy metals, formation and control technology of dioxins, leaching toxicity, speciation distribution of heavy metals and mineral components, XRD analysis of mineral components, in fly ash, are fully provided. Effects of pH on leaching behavior of heavy metals and effects of temperature on volatilization ratios of heavy metals are presented. Results show that the contents of heavy metals in fly ash followed a sequence of Zn > Pb > Cu > Cr > As > Ni > Cd ≈ Hg. Most heavy metals in leaching solution, in accordance with horizontal vibration extraction procedure standard, exceed the limits. Major mineral components are found to be SiO2, Ca3Si2O7, Ca9Si6O21 ∙ H2O, AlCl3∙4Al(OH)3 ∙ 4H2O, etc. Al and Si have a direct relationship with extraction efficiency of heavy metals, which are conducive to stabilization of heavy metals. The simulation results using MINTEQA2 show that pH values may change the leaching behaviors of Zn, Cr, Cd, Ni, Pb, Cu, As, Hg. It is easy for Hg, Cd, As and Cd to volatilize, and a little difficult for Zn and difficult for Ni, Cr, and Cu to fly away from fly ash, with the increase of sintering temperature.
Keywords
Fly ash; heavy metals; leaching behavior; volatilization ratios; sintering temperature; dioxins
5.1 Compositions of Heavy Metals in Fly Ash
Fly ash is a must by-product of municipal solid waste (MSW) incineration process, which has been classified as a hazardous waste due to its relatively high content of heavy metals all over the world. The presence of heavy metals in municipal solid waste incineration (MSWI) fly ash is of environmental concern due to their leaching potential in landfill environments. Hence, its management is becoming a challenge for incineration of MSW, and therefore attracting world attention.
The ash used in this study came from two municipal solid waste incinerators, Shanghai Pudong and Jiangqiao MSWI Plants, which handle 1500–1700 t/day. Prior to analysis for characterization of heavy metals, fly ash was dried at 105°C. Hg detector was used to measure content of Hg and ICP (IRIS Advantage 5000) used to analyze content of other heavy metals. HNO3/H2O2 digestion method was applied to extract Hg from the ash, and HNO3/HF/HClO4 method applied for other heavy metals.
Leaching toxicity analysis was performed in accordance with HVEP (horizontal vibration extraction procedure) and ALT (available leaching toxicity) standards, in which de-ionized water is used as the agent and the liquid to solid ratio registers 10:1 for the former and 100:1 for the latter. Sequential chemical extraction has long been used as a method to analyze speciation of heavy metals. In this study, sequential chemical extraction was performed on 10 g fly ash, with a liquid to solid ratio of 10:1 in each step. Specific description of each step is shown in Table 5.1. Heavy metals of the last two speciations are hardly soluble. In the last step, the contents of Cd, Pb and Zn in the residue from Step 5 were analyzed by digestion with HCl/HNO3/HF/HClO4 and that of Hg by digestion with HCl/H2O2/HNO3.
Table 5.1
Sequential Chemical Extraction Procedures
| Steps | Reagent | Conditions |
| (1) Water soluble | De-ionized water | 3 h Continuous agitation |
| (2) Exchangeable | MgCl2 | 3 h Continuous agitation |
| (3) Acid soluble | 0.5 M CH3COOH + 0.1 M Ca(NO3)2 | 3 h Continuous agitation |
| (4) Bound to organic matter | 3 h Intermittent agitation | |
| (5) Bound to Fe–Zn oxides | 0.175 M (NH3)2C2O4 + 0.1 M H2C2O4 | 3 h Intermittent agitation |
| (6) Residual | HCl/HNO3/HF/HClO4; HCl/H2O2/HNO3 | Digestion on electric hot plate |
2 M HNO3 was diluted to different concentrations of the solution, which were used as the extractant of different pH to extract heavy metals from the ash. Leaching solution was analyzed using ICP after 48 h horizontal vibration on rotary table concentrator (DKY-II), additionally, simulated using MINTEQA2 modeling. The fly ash was sintered at 400, 600, 800, 900, 1000, 1100 and 1200°C, respectively for 30 min in the muffle furnace (SX2-4-10). After cooling down, the sintered fly ash went through volatilization analysis of its heavy metals.
Fig. 5.1 shows that the contents of heavy metals in fly ash follows a sequence of Zn>Pb>Cu>Cr>As>Ni>Cd≈Hg in Pudong MSWI Plant and Jiangqiao Plant, and total heavy metals accounted for around 0.68% by mass of fly ash for the former, and approximately 0.71% for the latter. Contents of heavy metals in fly ash from Jiangqiao MSWI Plant were generally higher than those from Pudong MSWI Plant, which may be resulted by the difference in waste components and incineration temperatures between both plants.

Note: “Av1” and “Av2” represent average content of heavy metals from Pudong and Jiangqiao MSWI Plant respectively.
Given that hazard of heavy metals is manifested not only by their contents but also by their extraction toxicity, and thus leaching toxicity analysis is required to assess environmental risk imposed by them.
5.2 Formation and Control Technology of Dioxins in Fly Ash
In China, a total of 178 MSWs incineration plants were in operation in 2014, producing almost 2–4 million tons of fly ash and 30–46 million tons of bottom ash. Fly ash is a residue collected from the flue gas cleaning system in waste incineration plants, which is a kind of complex particles with heavy metals and persistent organic pollutants (POPs) like polychlorinated dibenzo-p-dioxins and dibenzofurans (PCDD/Fs), polychlorobenzene, and polycyclic aromatic hydrocarbons (PAHs) etc., and can’t be used for landfill and building materials before treatment. Dioxin from waste incineration contains poly-chlorinated dibenzo-pdioxin (PCDDs) and poly-chlorinated dibenzofuran (PCDFs). In most of the incineration plants (including the medical waste incinerators), international toxic equivalent (I-TEQ) value in bottom ash is extremely low (only 0.55–1.78 pg I-TEQ/g), whereas the concentration in fly ash is in the range of 0.1–0.8 ng I-TEQ/g.
Conclusion have be made that dioxins are highly persistent in environment and are apt to bioconcentration in food chain because of the liposolubility intergenerational effect. Dioxin is a kind of chlorinated tricyclic aromatic compounds of which some have the intense carcinogenesis, tetratogenesis and mutagenesis. In Europe, tolerable daily intake (TDI) is 1–10 pg I-TEQ/kgbody weight where the threshold is 5 pg I-TEQ/kgbody weight in Sweden, Finland and Norway.
Precisely because of the existence of heavy metals and dioxins, fly ash treatment and management become one of the crucial environmental issues. In China, landfill for fly ash and reuse for the bottom ash are two dominant ways. For decades, researchers and government regulators concerns more on the concentration of heavy metals, while dioxins in the fly ash receives little attention. The reuse workspace or landfill site of fly ash and bottom ash make long at-work exposures. However, there still have relatively little data about the distribution and emission characteristics of dioxins, especially the concentration of PCDD/Fs in the workplace air.
5.2.1 Dioxins Generation in MSWI System
The proven formation mechanism of dioxin in the MSWI system has four possible ways.
1. Initial presence in the refuse to be incinerated. The PCDD/Fs existed in the original waste have not been destructed completely and remained in the residues and flue gases. The refuse itself has extremely trace amounts of dioxins (Tables 5.2 and 5.3).
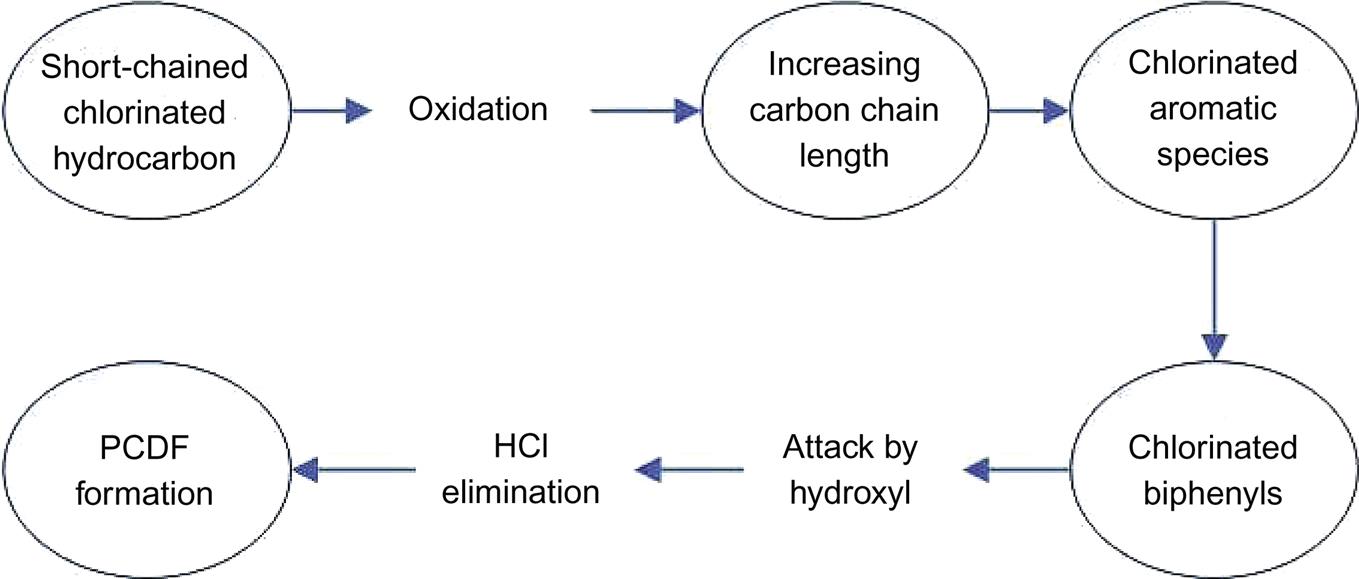
2. High-temperature gas-phase formation. Firstly the chlorinated and hydrocarbon with short chain is converted into chlorobenzene, and then converted into PCBs, which ultimately changed into PCDFs under high temperature (571–982°C). PCDFs can be changed into PCDDs through further reactions. Generally, dioxin generated in this way accounts for 8–10% of the total concentration.
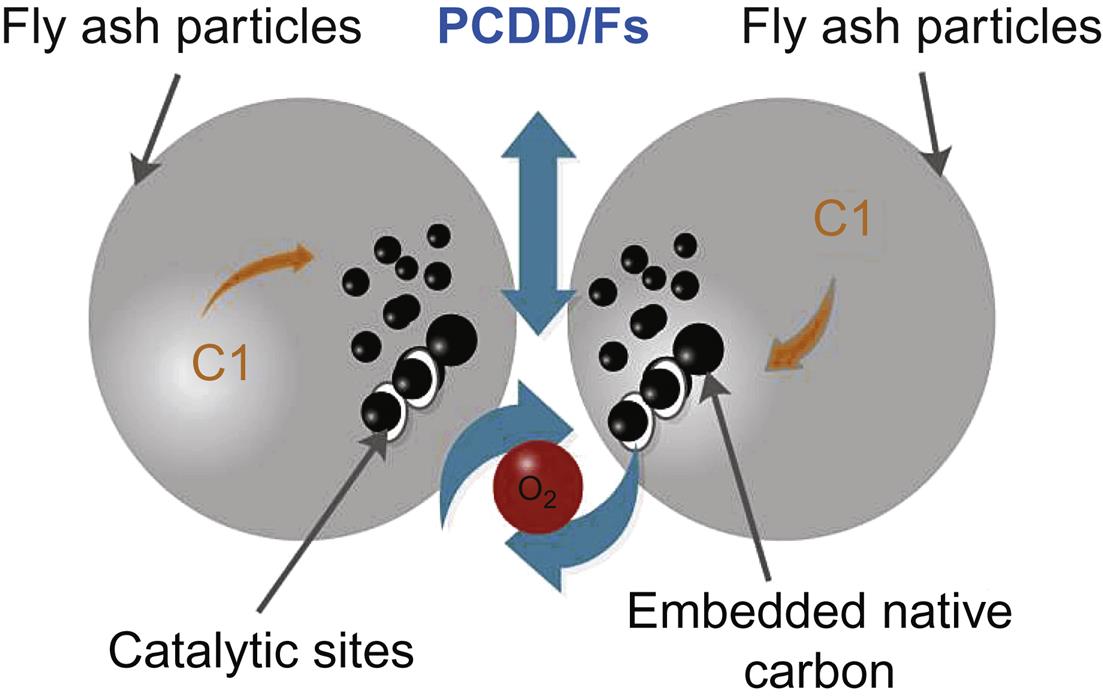
3. De novo synthesis. The organic or inorganic chlorine of fly ash matrix and macromolecule carbon (also called residual carbon) can produce PCDD/Fs with some catalytic compositions (Cu, Fe) in the fly ash. In this process, PAHs are transferred to PCDFs via decomposition, chlorination and oxidation. Part of the PCDD/Fs spread to the gas phase, but a large amounts of dioxins remain in the fly ash particles. Temperature also has a great effect on the amounts of dioxin generated in this way. A recent study showed that almost all PCDD/Fs were synthesised after combustion, for example, in electrostatic precipitators. Inevetible conditions of novo systhesis are: (1) the absence of amorphous carbon; (2) oxygen; (3) chlorine; (4) catalyst like CuCl2 or other transition metal chemicals; (5) 200–400°C.
4. Precursor synthesis. Incomplete combustion and heterogeneous catalytic reaction on surface can produce various organic precursors, like chlorophenol, which are easily converted into PCDD/Fs afterwards. The precursors may come from the waste and the formation afterwards. For example short-chained hydrocarbons like ethane (C2H6), ethene (C2H4), ethyne (C2H2) can synthese the polychloriznated benzenes and polychlorinated Phenols, both of which are usually precursors of dioxin.
Table 5.2
Prediction for the Total Amounts of Dioxins in the MSWI
| Year | 2005 | 2006 | 2007 | 2010 | 2015 | 2020 |
| Incinerated refuse (millions tons per year) | 79.1 | 113.8 | 143.5 | 231.3 | 486.7 | 890.0 |
| Total amounts of dioxins (g-TEQ/a) | 581.4 | 836.4 | 1054.8 | 1700.1 | 3577.2 | 6541.5 |

Table 5.3
The initial Concentration of Dioxins in the Refuse
| Country | Kinds of refuse | Dioxins | Concentration (ppb) | Referrence |
| Canada | MSW | OCDD | 0.4–0.6 | (Weidemann and Lundin, 2015) |
| Germany | Paper, cardboard | Dioxin | 3.1–45.5 | (Wilken et al., 1992) |
| Plastic, wood, leather, textile | 9.5–109.2 | |||
| Vegetables | 0.9–16.9 | |||
| Ameriaca | Refuse derived fuel | PCDDs | 1.0–13.0 | (Agency, 1996) |
| PCDFs | 0–0.6 |

5.2.2 Emission Characteristics and Analysis of Dioxins in Fly Ash and Bottom Ash
In general, the content distributions and characteristics of dioxins strongly depend on the constitutions of the refuse, the combustion process and operation conditions. In China, both grate furnace incinerator and fluidized bed incinerator are widely used and the dust control methods include semi-dry adsorption, activated carbon adsorption, electrostatic precipitator and bag filter. According to the research (Table 5.4), grate furnace incinerator may be worse than fluidized bed incinerator in terms of dioxin concentration and dioxin type in the fly ash because quench tower equipped at fluidized bed incinerator can effectively prevent dioxins from secondary synthesis.
Table 5.4
Dioxin Concentration of Fly Ash in Different Combustion Processes and Dedusting Methods
| Combustion Processes | Methods | Dioxin Concentration (ng TEQ/g) |
| Grate furnace incinerator | Semi-dry adsorption and bag filter | 0.34–3.80 |
| Semi-dry adsorption, activated carbon adsorption and bag filter | 0.74–4.46 | |
| Semi-dry adsorption and electrostatic precipitator | 0.52 | |
| activated carbon adsorption and bag filter | 7.53 | |
| Fluidized bed incinerator | Semi-dry adsorption, activated carbon adsorption and bag filter | 0.80 |
| Semi-dry adsorption and bag filter | 0.14–0.90 | |
| Bag filter | 0.25–8.2 |

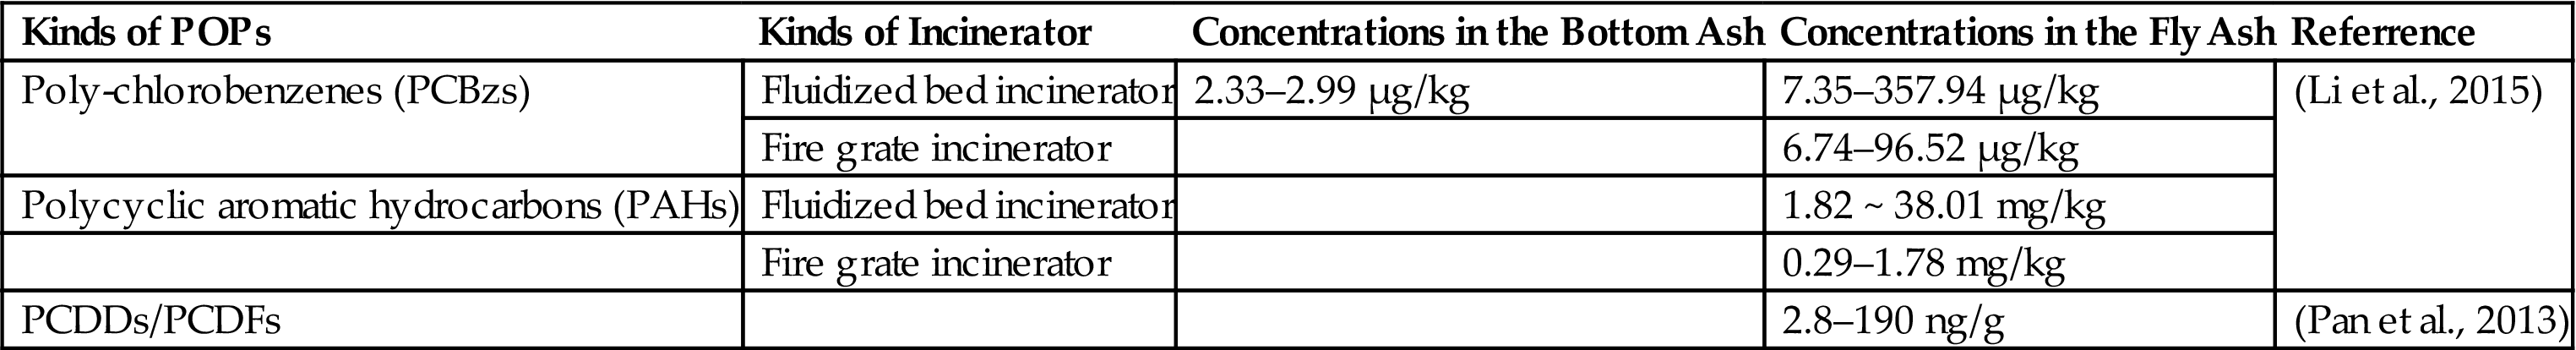
Apart from dioxins, chlorobenzene (CBz), PAHs and PCBs are also frequently found in flue gas, bottom ash, and fly ash generated by municipal solid waste incinerators. Due to wide applications of insecticides and preservative, the concentration of Hexachlorobenzene (HCB) in the fly ash is 10–100 times more than dioxins (Table 5.5). Besides, it is noteworthy that others POPs may have a risk on people from a life cycle perspective.
Table 5.5
POPs Concentrations in the Bottom Ash and Fly Ash
| Kinds of POPs | Kinds of Incinerator | Concentrations in the Bottom Ash | Concentrations in the Fly Ash | Referrence |
| Poly-chlorobenzenes (PCBzs) | Fluidized bed incinerator | 2.33–2.99 µg/kg | 7.35–357.94 µg/kg | (Li et al., 2015) |
| Fire grate incinerator | 6.74–96.52 µg/kg | |||
| Polycyclic aromatic hydrocarbons (PAHs) | Fluidized bed incinerator | 1.82 ~ 38.01 mg/kg | ||
| Fire grate incinerator | 0.29–1.78 mg/kg | |||
| PCDDs/PCDFs | 2.8–190 ng/g | (Pan et al., 2013) |
The homolog distribution of dioxins in different incinerators was found to be similar and the TEQ value was linearly related to some homologs which can become the indicator substances using for the rapid determination of dioxins. However, high molecular weight, wide range of homologs and trace amounts make the analysis difficult. At first, High Resolution Gas Chromatography and High Resolution Mass Spectrum (HRGC/HRMS) is performed for the exact determination. Before that, the samples should be extracted and concentrated for a long time so it is costly to use widely. For this reason, indirect ways are applied nowadays using the related compounds and matching models. For instance, chlorobenzene (CBz) is considered as the excellent indicators of dioxin because the emission characteristics and formation mechanism is similar with dioxins. In addition, CBz is an important precursor for the synthesis of PCDD/Fs. The total amounts of CBz have great associations with I-TEQ. Therefore, CBz was selected as the indicators in many studies.
5.2.3 Control Technologies of Dioxins
The substances that influence PCDD/Fs formation and their impact mechanisms, include different categories of chlorine (Cl2, HCl and chloride in fly ash), O2, copper, sulfur, water, and nitrogen compounds (ammonia and urea).
In incineration process, fly ash is the major reaction surface of dioxin formation, and the metal, metal oxides and metal chlorides on the surface will promote the formation of dioxin. Therefore, fly ash greatly affects the formation paths. It is confirmed that a small proportion of dioxins will be discharged with flue gas and most remained in fly ash, which may be in the range from 106 to 258 ng-TEQ/kg. According to the “Standard for pollution control on the landfill site of municipal solid waste” (GB16889), fly ash with the dioxin less than 3 ng-TEQ/g is allowed to landfill. As one of the carrier of dioxins, fly ash is gaining more and more attention. And the emission control of waste incineration turns to the total emission control. Here are some technologies of dioxin treatment ever used.
1. Melting method
Melting method is a way to decompose dioxin by heating the fly ash up to 1300°C. This method can reduce nearly half of the ash and totally remove the dioxins. But the high treatment temperature and the volatilization of some metals run up the cost, which is the main factor to limit the application.
2. Gas phase chemical reduction method
This technology is to heat organic compounds above 850°C with hydrogen, which can generate small molecule hydrocarbons and hydrogen chloride by dechlorination and hydrogen reduction. The gas phase reduction has a high removal rate on dioxin, PCBs, organochlorine pesticides and PAHs. For example, the removal rate can reach 99.9% for DDT and HCB. It’s also a high-cost technology and which original intention is to treat hazardous waste.
3. Photochemical decomposition method
It’s a technology to dechlorinate organic compounds like dioxin and generate ozone at the same time with the help of ultraviolet ray. Generally, low molecular intermediates, carbon dioxide, water and other ions like chloride ion and nitrate ion will be generated. Photochemical decomposition needs a complex operation and extra oxidants or catalysts.
4. Heat treatment method
It is found that dioxin from incineration fly ash can decompose in condition of catalysts-free and inertia atmosphere, which is the start of low temperature heat treatment technology. It is an effective way to reduce dioxin from fly ash, and the main requirements are as follows: (1) inertia atmosphere; (2) the reaction temperatures of 250–400°C; (3) the residence time of over 1 h; (4) the discharge temperature of fly ash with lower than 60°C.
5. Low-temperature plasma method
Low-temperature plasma method makes current pass through low-pressure air flow and generates high temperature which decompose almost all organic compounds to produce water, carbon dioxide and water-soluble inorganic salt, and the removal rate can reach 99.9%. But its application and popularization are restricted since the complex equipment and high-cost.
1. Extraction-catalytic dechlorination method
This technology transfers dioxin to organic solvent by solvent extraction, and then makes use of supported noble metal catalysts like Pt/C and Pt/Al2O3 assisted with hydrogen donor to achieve the dechlorination of dioxin under mild conditions. The technology needs to consume some solvent which has a significant amount of exposure risk for people during the extraction process.
2. Ball milling method
By mixing fly ash with CaO and placing in ball mill system, mechanochemical treatment can achieve great dechlorination and the main products are biphenyl and chloridion. Biphenyl can transfer to terphenyl, quaterpheny, cyclohexylbenzene and bicyclohexyl through the polymerization and hydrogenation reactions. The removal rate of dechlorination can reach almost 100% by mixing OCDD, OCDF with CaO.
3. Supercritical water oxidation process
Supercritical water oxidation process is a technology using O2 or H2O2 as oxidants to decompose harmful organic compounds under 374°C 22.1 MPa. Organic compounds can be quickly oxidized into CO2, water and inorganic salt. And its removal rate of dioxin and PCBs can reach above 99.9%.
5.3 Leaching Toxicity of Heavy Metals in Fly Ash
Leaching results of heavy metals in accordance with HVEP and ALT standards are shown in Table 5.6. It can be seen that the concentrations of most heavy metals in leaching solution, in accordance with HVEP standard, exceeded the limits required in “Identification Standard of Hazardous Waste—Identification of Leaching Toxicity”.
Table 5.6
Leaching Results in Accordance with HVEP Standard of Heavy Metals in Fly Ash (mg/L)
| Standard | Source | NO. | As | Cd | Cr | Cu | Hg | Ni | Pb | Zn* |
| HVEP | Pudong MSWI Plant | 1 | 0.031 | 0.127 | 0.954 | 0.308 | 0.403* | 0.051 | 49.010* | 52.760* |
| 2 | 0.029 | 0.098 | 0.923 | 0.315 | 0.475* | 0.057 | 47.340* | 48.350 | ||
| 3 | 0.028 | 0.110 | 0.898 | 0.289 | 0.483* | 0.059 | 48.250* | 49.250 | ||
| Av1 | 0.029 | 0.112 | 0.925 | 0.304 | 0.454* | 0.056 | 48.200* | 50.120* | ||
| Jiangqiao MSWI Plant | 1 | 0.034 | 0.162 | 0.965 | 0.361 | 0.412* | 0.054 | 59.010* | 67.230* | |
| 2 | 0.032 | 0.095 | 0.934 | 0.275 | 0.501* | 0.097 | 43.670* | 49.180 | ||
| 3 | 0.029 | 0.098 | 0.895 | 0.289 | 0.498* | 0.056 | 49.360* | 53.390* | ||
| Av2 | 0.032 | 0.118 | 0.931 | 0.308 | 0.470* | 0.069 | 50.680* | 56.600* | ||
| Limit | 1.500 | 0.300 | 10.000 | 50.000 | 0.05* | 10.000 | 3.000 | 50.000 | ||
| ALT | Pudong MSWI Plant | 1 | 15.98* | 28.34* | 40.20 | 97.76 | 1.11* | 19.87 | 597.32* | 1704.57* |
| 2 | 16.36* | 27.45* | 39.76 | 96.43 | 1.24* | 18.45 | 589.67* | 1694.69* | ||
| 3 | 16.01* | 29.67* | 41.54 | 97.01 | 1.09* | 18.97 | 602.56* | 1674.26* | ||
| Av3 | 16.12* | 28.49* | 40.50 | 97.07 | 1.15* | 19.10 | 596.52* | 1691.17* | ||
| Jiangqiao MSWI Plant | 1 | 16.23* | 30.13* | 47.40 | 93.23 | 1.25* | 18.98 | 634.10* | 1745.30* | |
| 2 | 18.01* | 29.04* | 39.46 | 97.98 | 1.46* | 21.23 | 569.30* | 1693.00* | ||
| 3 | 16.97* | 29.58* | 38.21 | 100.24 | 1.31* | 20.08 | 602.40* | 1695.50 | ||
| Av4 | 17.07* | 29.58* | 41.69 | 97.15 | 1.34* | 20.10 | 601.93* | 1711.27 | ||
| Limit | 15.00* | 3.00 | 100.00 | 500.00 | 0.50 | 100.00 | 30.00 | 500.00 |

Note: “*” means that leaching result exceeded the limits; “Av1”, “Av2”, “Av3”, and “Av4” represented the average leaching results, in accordance with both standards, for heavy metals in fly ash from both plants respectively.
5.4 Speciation of Heavy Metals and Mineral Components in Fly Ash
Fig. 5.2 and Fig. 5.3 show that soluble Cd mainly existed in the acid soluble, exchangeable and water-soluble phases, soluble Hg in acid soluble and water-soluble phases, while soluble Pb appeared in acid soluble and water soluble, Zn and As in bound to organic matter and acid soluble, for fly ash at room temperature. Hence, it is relatively difficult for Pb and Zn to be leached out in environment without the existence of acids. However, in natural environment exposing to acid rain, there always exist acids and the above four heavy metals tend to be extracted by acidic liquid after years. The aim of stabilization and sintering of the fly ash is to minimize leaching toxicity of heavy metals by reducing their existence in water soluble, exchangeable, acid soluble and bound to organic matter phases, as done in this work. Content of Cr in residual phase of fly ash from Jiangqiao Plant was relatively lower than that from Pudong Plant, while for other heavy metals, it was higher in terms of the former plant. This should be caused by transformation of Cr3+ to Cr6+ at relatively higher incineration temperature of Pudong Plant and higher solubility of Cr6+ than Cr3+ (Fig 5.4, Fig 5.5).


5.5 XRD Analysis of Mineral Components of Fly Ash
To find out major mineral components which include heavy metals in their crystal lattice, XRD analysis was performed on residues derived from each step of sequential extraction procedure shown in Table 5.1. After the first step, XRD analysis of residue is shown in Fig. 5.6. Major mineral components were found to be SiO2, Ca3Si2O7, Ca9Si6O21∙H2O, AlCl3∙4Al(OH)3∙4H2O, 5CaO∙3SiO2∙2H2O, Mg7Fe4O13∙10H2O, Al9Cl6(OH)21∙18H2O, Pb2Fe2O5, Ca2SiO4∙0.35H2O, (Mg,Al)(Si,Al)O(OH)∙8H2O. No basic oxides and chlorides were found in the spectrum, which should be dissolved during the first washing step. Diffraction peaks of Zn and Pb compounds appeared, while those of other heavy metals can’t be found, possibly for their relatively smaller contents in fly ash under the detection limit of XRD.
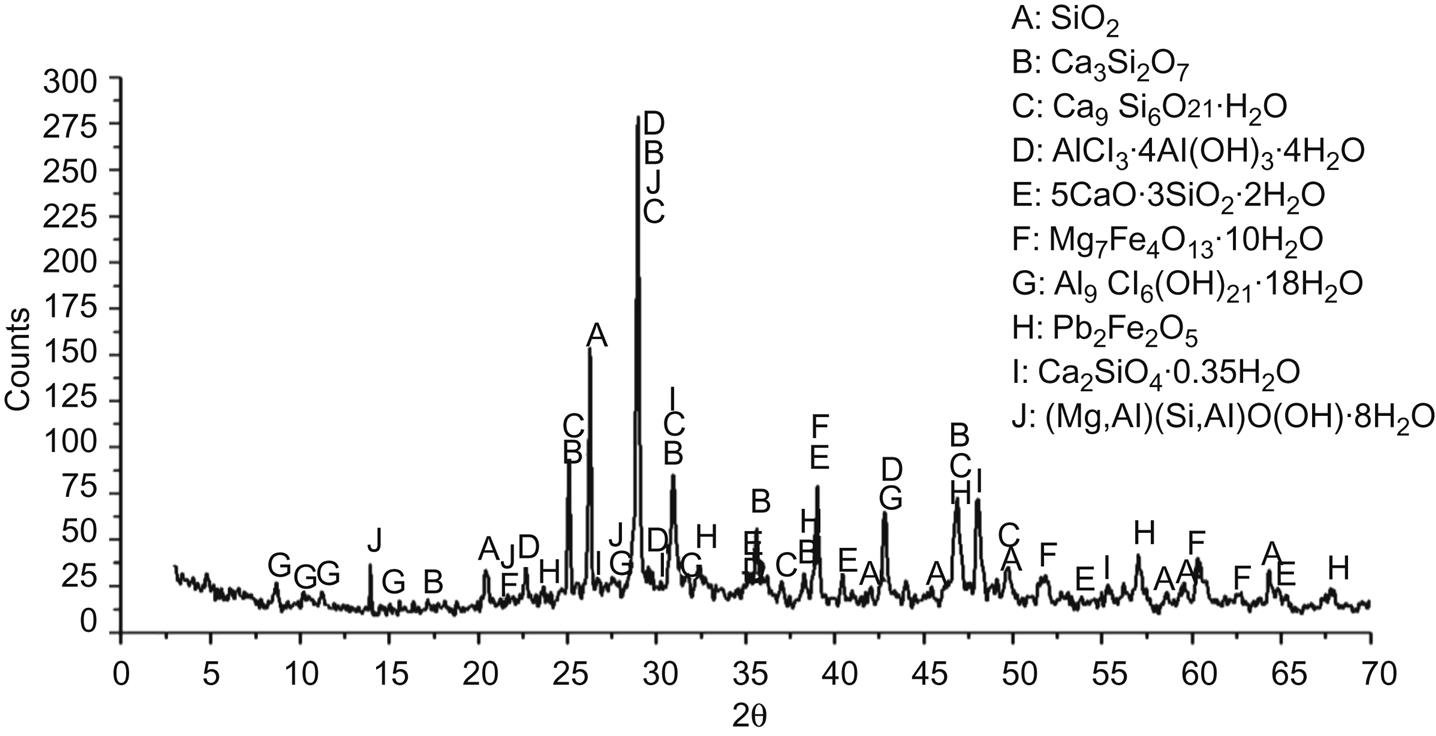
After the second step, diffraction peaks of Mg(OH)2 were found, those of AlCl3 ∙ 4Al(OH)3 ∙ 4H2O disappeared and diffraction peak of Al9Cl6(OH)2118H2O at d=2.11 Å decreased by 49% (Fig. 5.7). It was conferred that Mg2+ replaced Al3+ forming Mg(OH)2, which reduced contents of AlCl3 ∙ 4Al(OH)3 ∙ 4H2O and Al9Cl6(OH)21 ∙ 18H2O. Contents of other minerals increased correspondently, as reflected in the XRD spectrum.

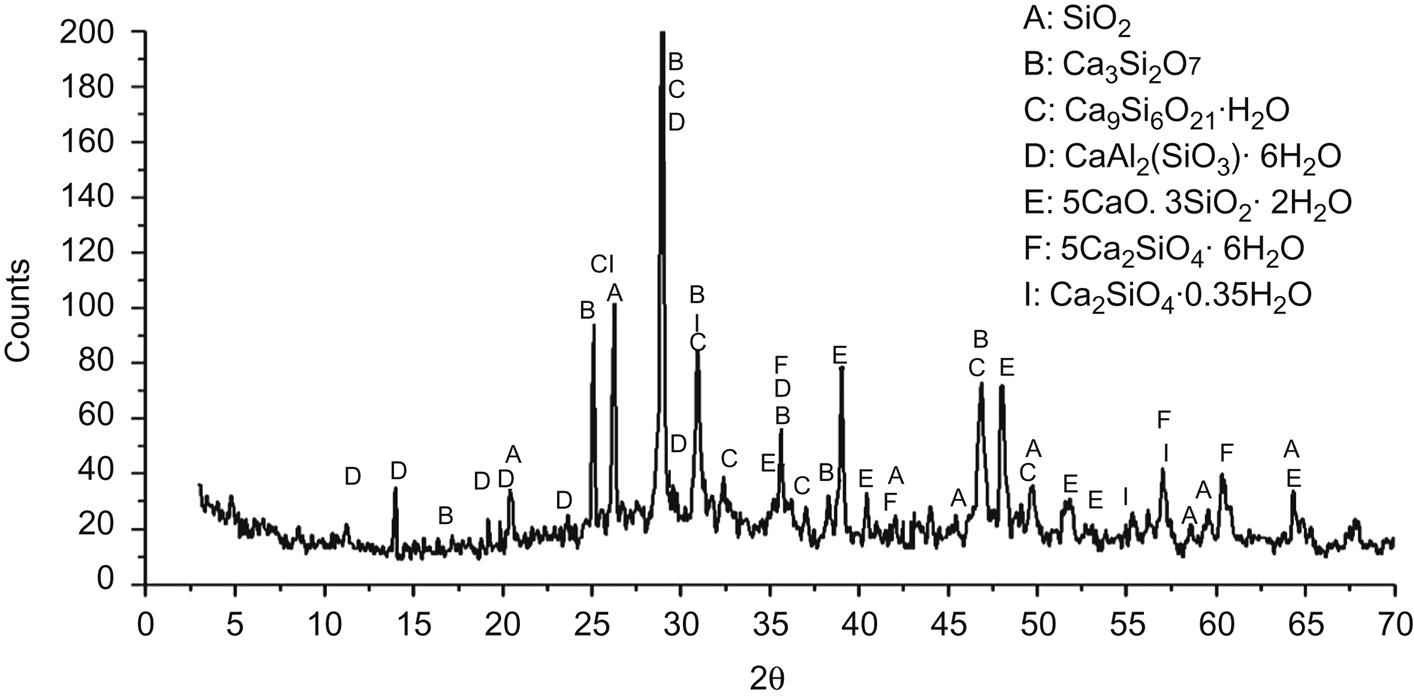
Fig. 5.8 shows that diffraction peaks of Mg(OH), Al9Cl6(OH)21∙18H2O, (Mg, Al)(Si, Al)O(OH) ∙ 8H2O and Pb2Fe2O5 disappeared, and those of CaAl2(SiO3)4 ∙ 6H2O and Mg7Fe4O13 ∙ 10H2O appeared, indicating that the former four minerals reacted with acid in the third step and contents of latter two minerals raised consequently to within the detection limit of XRD. In addition, contents of glass phases increased compared with that of residue from the second step.

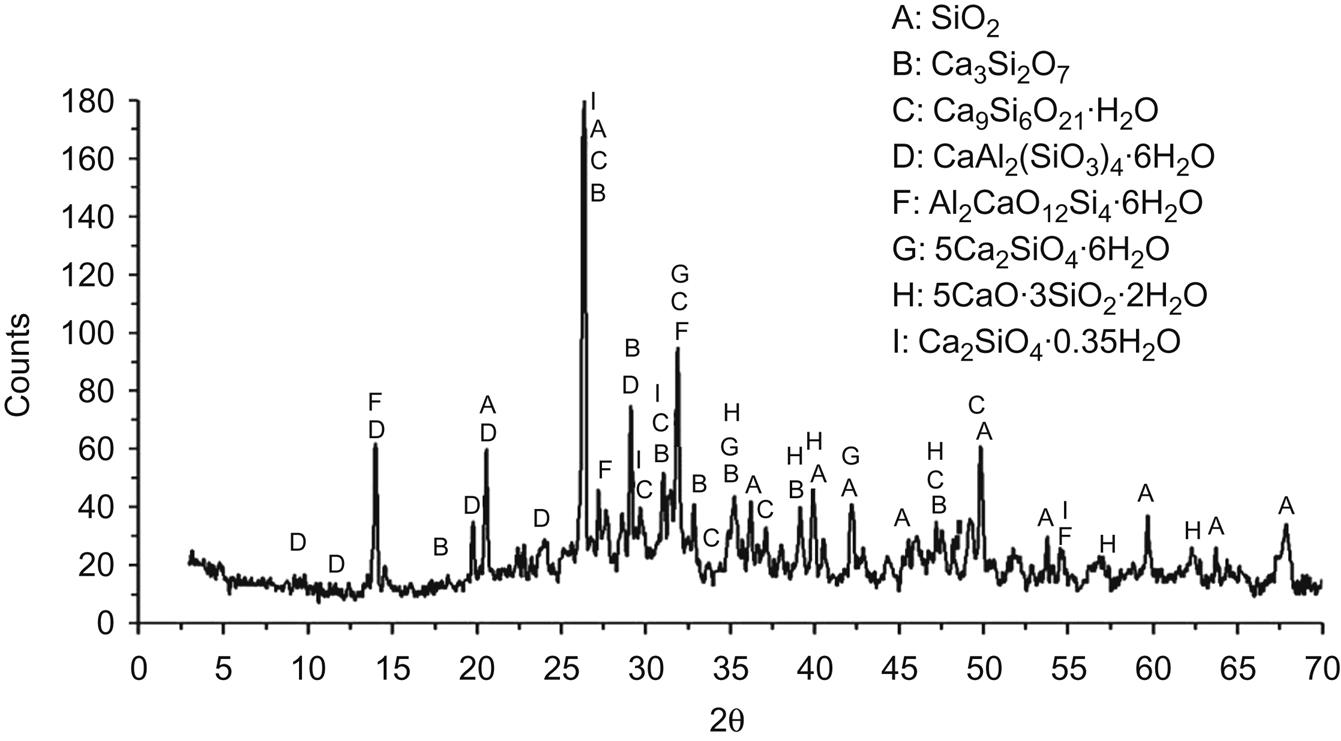
In the XRD analysis of residue from the fourth step, as shown in Fig. 5.9, Mg7Fe4O13 ∙ 10H2O disappeared from the spectrum, indicating that it was removed from the ash in the fourth step. Meanwhile, contents of glass phases as well as silicates increased again compared with that from the third step.
It was demonstrated that major mineral compositions of residue from the fifth step were calcium-silicates and aluminosilicates, including SiO2, Ca3Si2O7, Ca9Si6O21∙H2O, CaAl2(SiO3)4∙6H2O, 5CaO∙3SiO2∙2H2O, Al2CaO12 ∙ SI4 ∙ 6H2O and Ca2SiO4, in which heavy metals of residual phase were occluded. Besides, contents of glass phases as well as calcium-silicates and alumino-silicates increased again, compared with that from the fourth step, as shown in Fig. 5.10. It was conferred that contents of Ca, Si, and Al should influence extraction of heavy metals.
Based on the above XRD analysis of residue from each step of sequential extraction procedures, it was concluded that contents of glass phases increased steadily from the first step to the fifth step, indicating that extraction efficiency of heavy metals should decrease with the increase of glass phase contents. In addition, major mineral components of residue from the fifth step were mainly calcium-silicates and aluminosilicates, registering an increase in content from the first step to the fifth step, demonstrating that heavy metals of residual phase were occluded mainly in both silicates and content of Ca. Al and Si had a direct relationship with extraction efficiency of heavy metals. Consequently, it was conferred that fly ash may be stabilized in silicate materials containing Al and Ca, which were conducive to stabilization of heavy metals.
5.6 Effects of pH on Leaching Behavior of Heavy Metals in Fly Ash
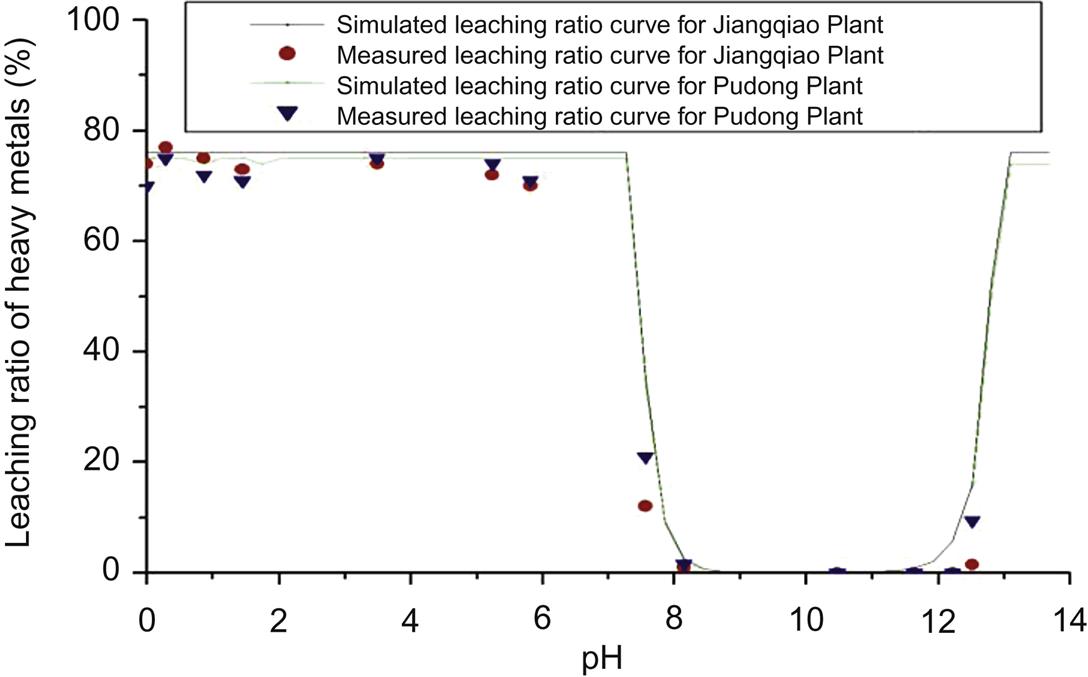
Leaching results of heavy metals in fly ash from both plants are compared with those derived from simulation using MINTEQA2, which is an equilibrium speciation model that can be used to calculate the equilibrium composition of dilute aqueous solutions in the laboratory or in natural aqueous systems. The model is useful for calculating the equilibrium mass distribution among dissolved species, adsorbed species, and multiple solid phases under a variety of conditions
5.6.1 Effects of pH on Leaching Behavior of Zn
Leaching results of Zn are essentially consistent with the simulated ratios, indicating that simulated leaching ratios can represent actual leaching behavior of Zn. The leaching ratios were relatively higher for fly ash from Jiangqiao MSWI Plant than those from Pudong MSWI Plant, which may be caused by a higher content of residual speciation in terms of the latter plant (Fig. 5.11). At pH from 0 to 7.5, leaching ratios of Zn are approximately equal to 75%, and close to zero at pH between 8 and 12 due to formation of Zn(OH)2 and ZnO ∙ SiO2, demonstrating a high content of acid soluble phase which was consistent with result of the specification analysis. When pH exceeds 12, leaching ratio increases again due to transformation of Zn precipitations to soluble [Zn(OH)3]−, and [Zn(OH)4]2− which is the major form in strong basic conditions.
Form transformation of Zn follows a sequence of dissolved ZnOHCl and ZnCO3 → precipitated Zn(OH)2 and ZnO ∙ SiO2 → [Zn(OH)3]− and [Zn(OH)4]2−, as described in Fig. 5.12. Major reactions taking place at pH ≥ 12 are: Zn(OH)2 + OH− → [Zn(OH)3]−, Zn(OH)2 + 2OH− → [Zn(OH)4]2−, ZnO + 2OH− + H2O → [Zn(OH)3]−, ZnSO4 + OH− → [Zn(OH)2 SO4]2−.

5.6.2 Effects of pH on Leaching Behavior of Cr
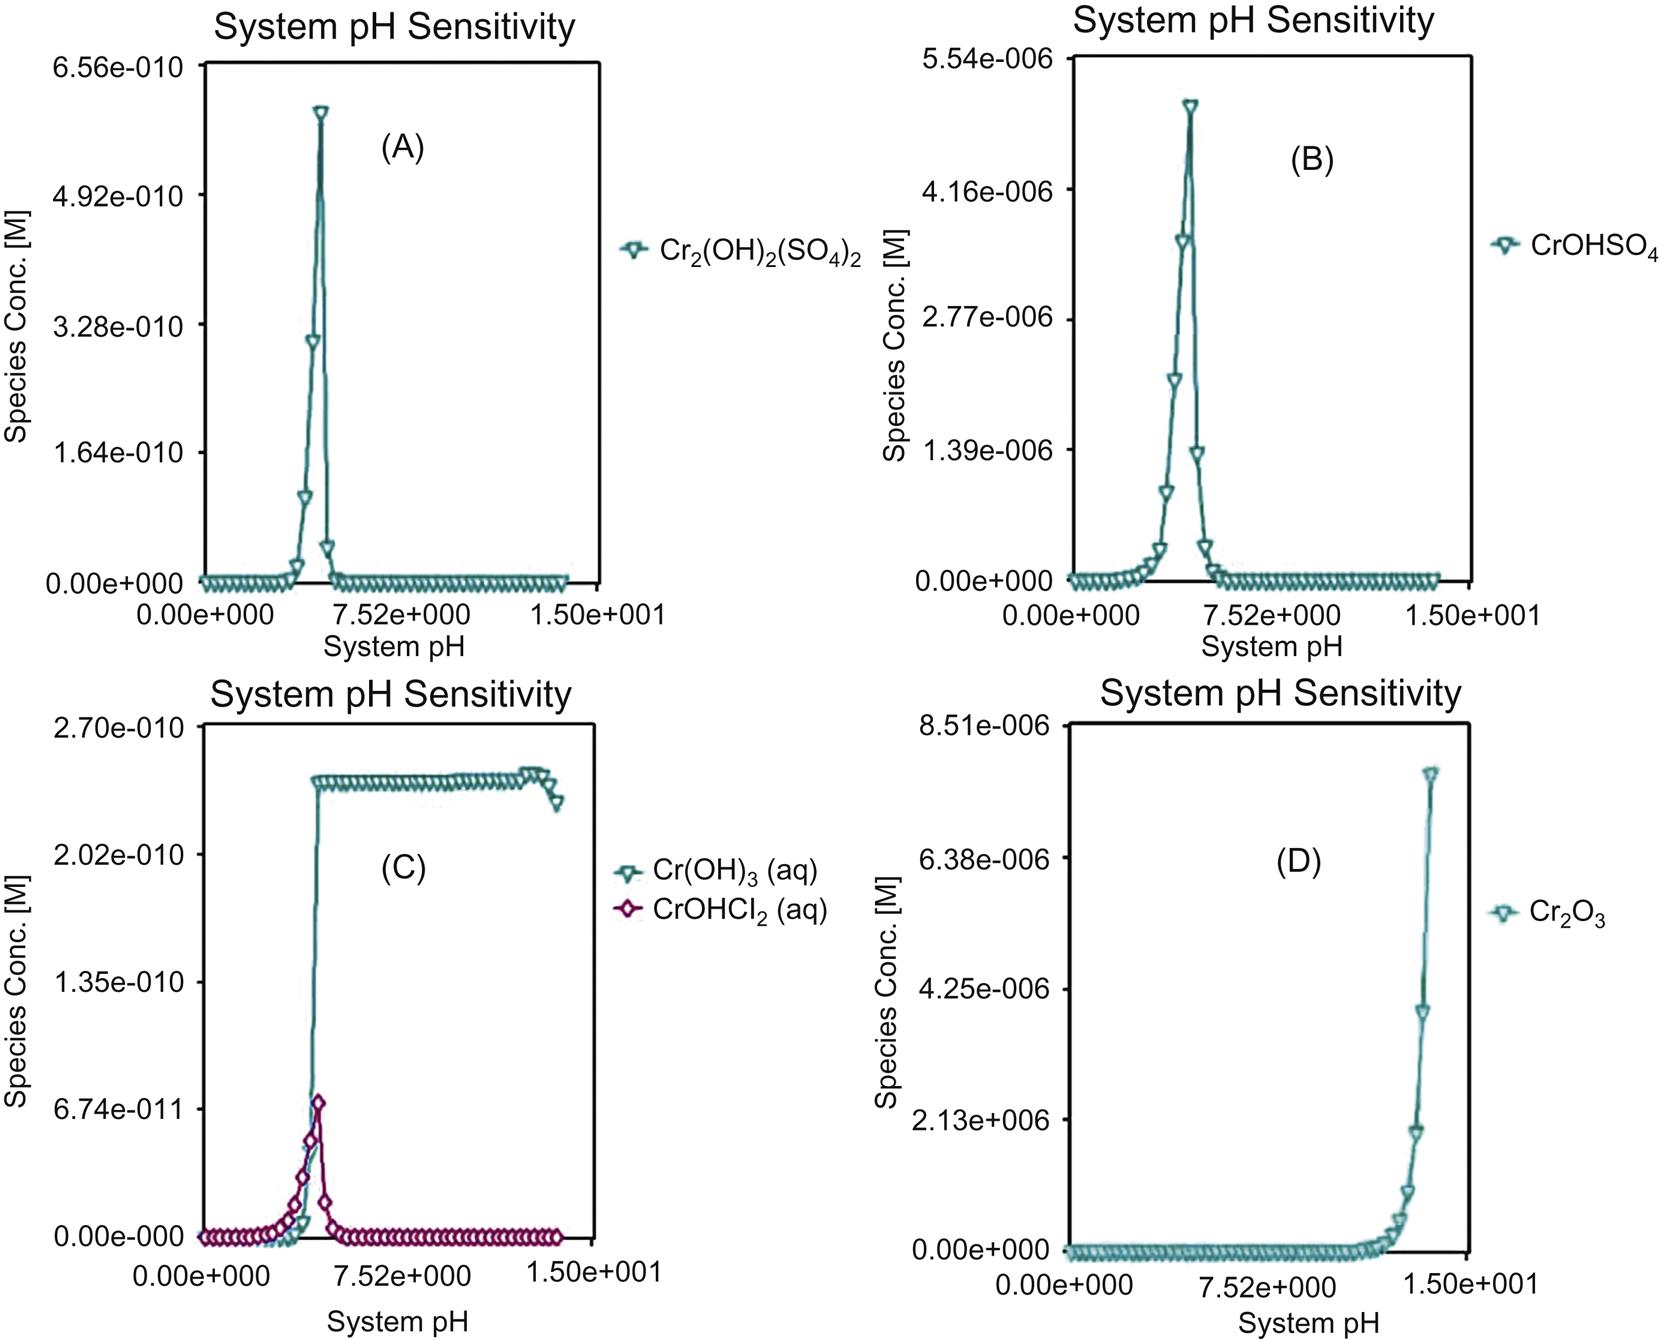
Measured and simulated leaching results of Cr are not always consistent, as shown in Fig. 5.13, indicating that simulated leaching ratios can’t always represent actual leaching behavior. When pH is lower than 4, simulated value is generally higher than the measured value, and the maximum measured leaching ratio is around 35% for Jiangqiao Plant and approximately 37% for Pudong Plant. Both measured and simulated leaching results are close to zero as pH ≥4, due to formation of Cr(OH)3 and Cr2O3, as shown in Fig. 5.14. It can be seen that form transformation of Cr follows a sequence of Cr2+ → Cr2(OH)2(SO4)2 → CrOHCl2 → Cr(OH)3 → Cr2O3 with the increase of pH.

5.6.3 Effects of pH on Leaching Behavior of Cd
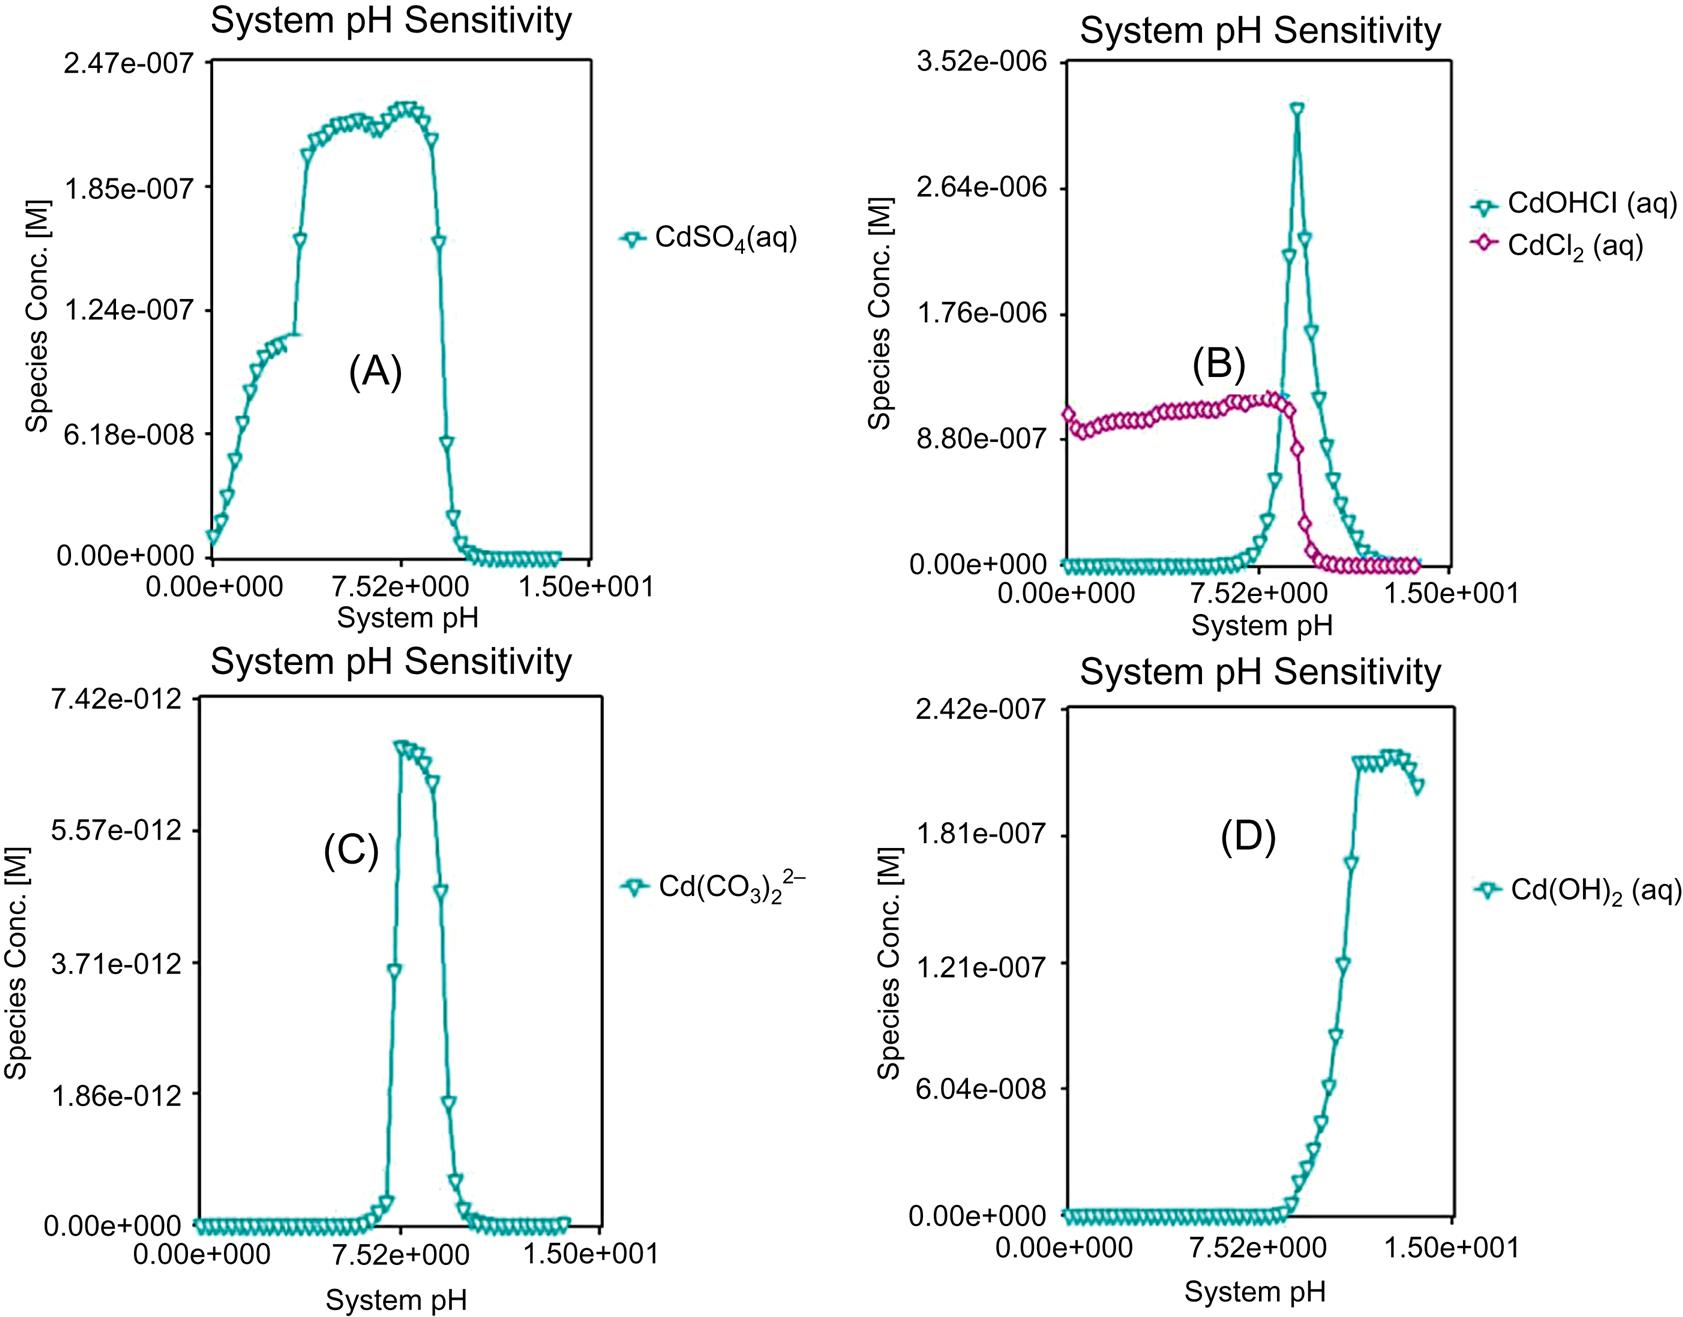
As shown in Fig. 5.15, measured leaching results of Cd are relatively lower than the simulated ratios when pH≤10, in terms of fly ash from Jiangqiao Plant and Pudong Plant, and leaching ratios are relatively higher for the former plant with the same reason described for Zn. Hence, simulated value can’t always represent the actual leaching behavior in terms of Cd. At pH≥11, the leaching results are close to zero, demonstrating minimal leaching in conditions of strong alkalinity. There is one point at around pH of 10 over the simulated value, which should be caused by error. The maximum leaching ratios exceeds 80% at pH close to zero, demonstrating a high content of soluble phase of Cd. From Fig. 5.16 it can be seen that form transformation of Cd follows a sequence of Cd2+ → CdCO3 and CdOHCl → Cd(OH)2 with the increase of pH.

5.6.4 Effects of pH on Leaching Behavior of Ni
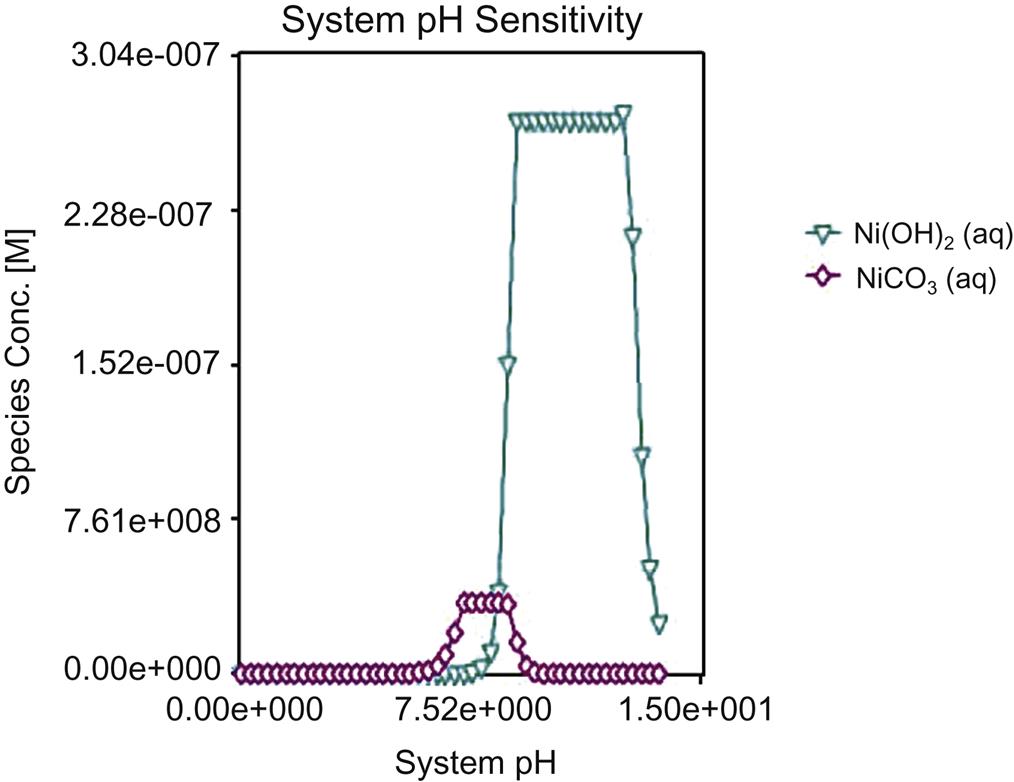
Leaching results of Ni are not consistent with the simulated value at pH≤2, as shown in Fig. 5.17, indicating that the latter can’t represent its actual leaching behavior at pH spanning 0 and 2. While, as pH≥2, the measured and simulated values are well consistent, and thus the latter can represent actual leaching behavior of Ni at pH ≥ 2. Maximum leaching ratio is relatively higher for Jiangqiao Plant with the same reason described for Zn. Form of Ni follows a sequence of Ni2+ → NiO ∙ SiO2 → NiCO3 → Ni(OH)2 → Ni(OH)3, as shown in Fig. 5.18.

5.6.5 Effects of pH on Leaching Behavior of Pb
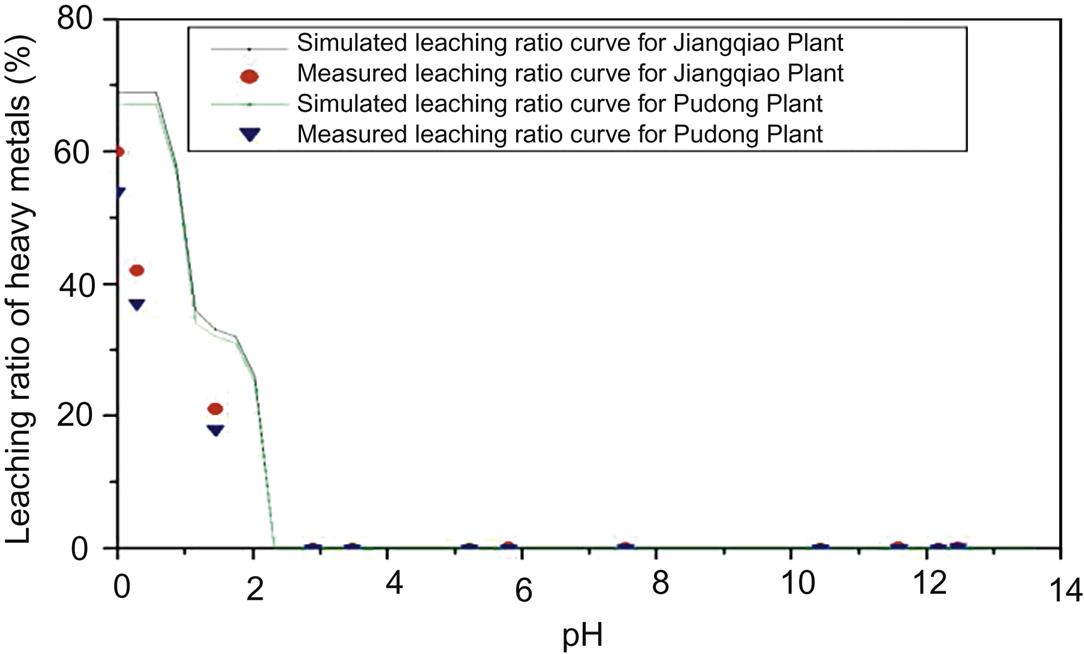
Measured and simulated leaching results of Pb for both plants are essentially consistent, indicating that simulated leaching ratios can reflect actual Pb leaching behavior in the environment, as described in Fig. 5.19. Leaching ratio reduces with the increase of pH from 0 to 3, indicating its tendency to being leached out of fly ash At strong acidic environment. At pH = 3–12, it is close to 0 due to formation of insoluble Pb(OH)2. When pH exceeds 12, it rises with the increase of pH, which is caused by transformation of Pb(OH)2 to [Pb(OH)3]−, [Pb(OH)4]2− and [Pb(OH)2 ∙ SO4]2−. Major reactions are: Pb(OH)2 + OH− → [Pb(OH)3]−, Pb(OH)2 + 2OH− → [Pb(OH)4]2−, PbO + 2OH− + H2O → [Pb(OH)3]−, PbSO4 + OH− → [Pb(OH)2 ∙ SO4]2−. Consequently, Pb mainly exists in the form of [Pb(OH)4]2− in strong basic conditions with pH ≥ 12, as shown in Fig. 5.20.

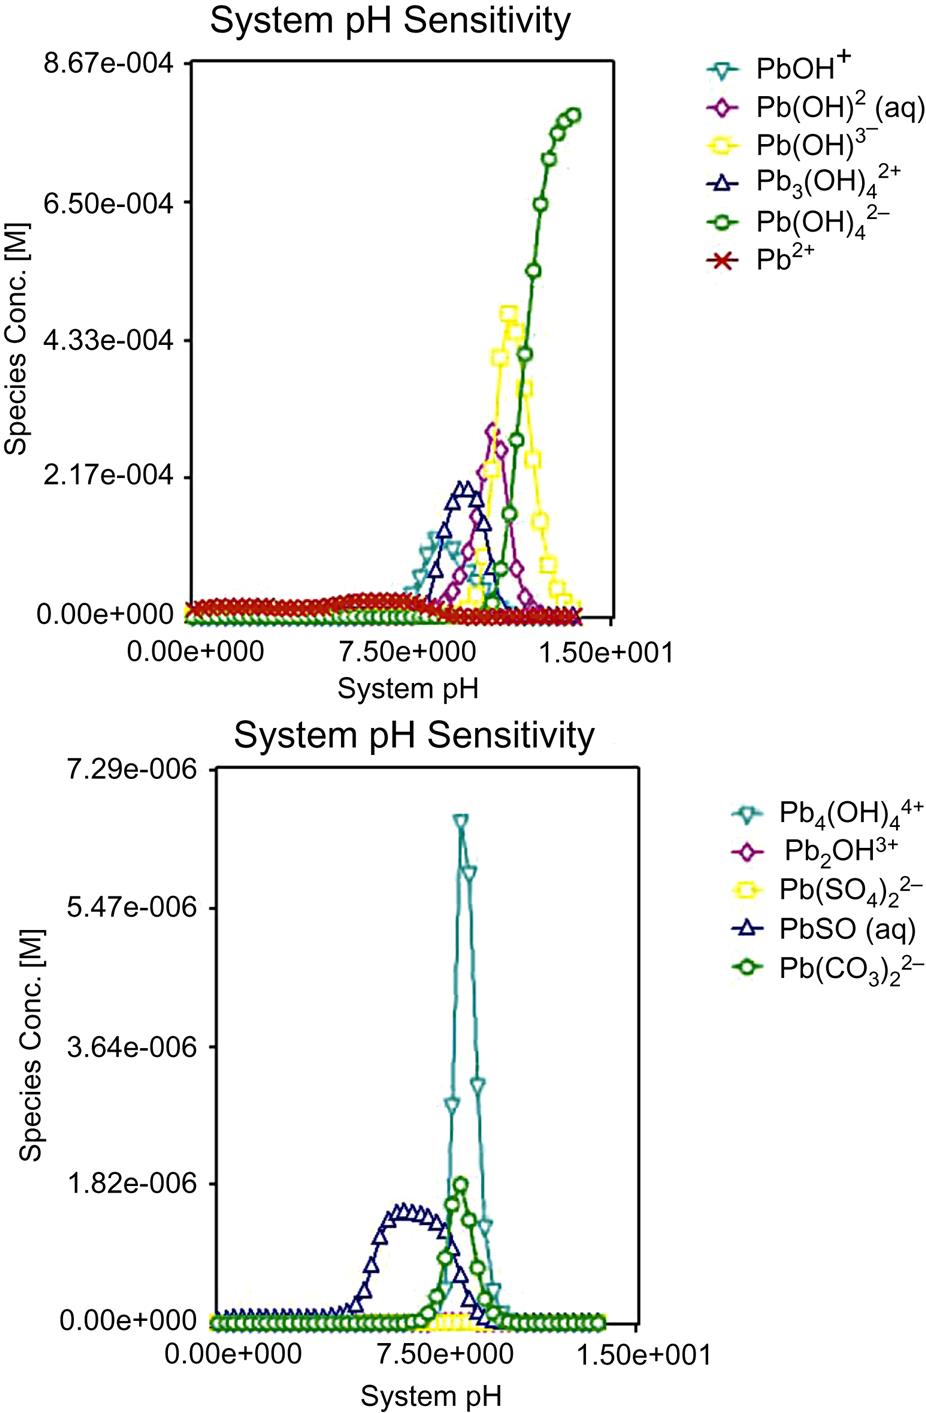
Fig. 5.20 shows that form transformation of Pb follows a sequence of Pb2+ → PbSO4 and Pb(OH)2 → [Pb(OH)3]− and [Pb(OH)2 SO4]2− → [Pb(OH)4]2− with the increase of pH. It is clear that Pb(OH)2 is transformed into [Pb(OH)4]2− and [Pb(OH)3]− which finally forms [Pb(OH)4]2− under strong basic environment. In terms of PbSO4, existing mainly at pH between 5.5 and 8.5, most of it is transformed into [Pb(OH)4]2− and only a small portion into [Pb(OH)2 ∙ SO4]2−, releasing Pb2+. Hence, its leaching toxicity is enhanced at both strong acidic and basic conditions, and thus inflicting a bad influence on environment.
5.6.6 Effects of pH on Leaching Behavior of Cu
Measured leaching results of Cu are well consistent with the simulated value for fly ash from both plants (Fig. 5.21), and thus the latter can reflect its actual leaching behavior in the environment. Maximum leaching ratio is over than 60%, demonstrating that Cu tends to be leached out in strong acidic environment. As pH is ≥4, its leaching ratios are close to zero, and thus a basic environment is conducive to stabilization of Cu. It is conferred that its form transformation follows sequence of dissolved Cu at pH of 1-minus → sulfides and oxides of Cu at pH = 1–4 → cuprous sulfides and oxides at pH ≥ 4.

5.6.7 Effects of pH on Leaching Behavior of As
Leaching results derived from measurement and simulation are well consistent at pH ≥ 2.5, while the ratios derived from the former are relatively lower than those from the latter at pH ≤ 2.5, demonstrating that the simulated value can represent actual leaching behavior of As only at pH of 2.5-plus, as shown in Fig. 5.22. The maximum measured leaching ratios are close to 60% at pH near zero, indicating that a strong acidic condition is conducive to extraction of As. Relatively low measured ratios compared with the simulated ones should be caused by loss of partial As in digestion process.
5.6.8 Effects of pH on Leaching Bbehavior of Hg
Like As, measured leaching ratios (Fig. 5.23), at pH of 9-minus, are relatively lower than the simulated ones for fly ash from both plants with similar reason described in terms of As. At pH between 0 and 4, measured leaching ratios are close to 50%, indicating that it is relatively easy for Hg to be leached out of fly ash and impose a bad influence on the environment. While at pH ≥ 9.5, leaching ratios by both methods are close to zero, demonstrating that Hg is relatively safe under strong basic conditions. Hence, a strong basic condition is conducive to reduction of its leaching toxicity.

Based on the above analysis of leaching results by measurement and simulation for fly ash from both plants, it is concluded that the maximum leaching results of Cr were relatively higher for Pudong Plant, while those of other heavy metals were lower compared with those for Jiangqiao Plant. It should be caused by different incineration temperatures and processes. Measured leaching results are well consistent with the simulated ones for Cu, Pb and Zn, indicating that the latter can reflect their actual leaching behavior in the environment. Leaching ratio of Cu decreases with the increase of pH until it is close to zero at pH ≥ 4, showing that a basic environment is conducive to reduction of its leaching toxicity. In terms of Zn and Pb, leaching results first decrease and finally increase with the increase of pH, demonstrating that it is easy for them to be leached out at both strong acidic and basic environment. For Ni, As, Cr, Hg, and Cd, leaching results, close to zero, are well consistent by both methods only when pH is over 1.5, 2.5, 5, 9.5, and 11 respectively, indicating that simulated ratios can’t always reflect actual leaching behavior of these heavy metals. Consequently, Ni, As, Cr, Hg, and Cd are relatively safe for the environment in strong basic conditions, as their leaching toxicity is around zero.
5.7 Effects of Temperature on Volatilization Ratios of Heavy Metals
Volatilization results of Hg and Pb with the increase of sintering temperature are shown in Fig. 5.24(A) and (B). It is clear that volatilization ratio of Hg increases considerably as sintering temperature rises from 400°C to 1,000°C, and is close to 100% after being sintered between 1,000°C and 1,200°C. Pb volatilizes slowly as it increases from 400°C to 800°C, flies away quickly from 800°C to 1,000°C, and is removed completely from fly ash Between 1,000°C and 1,200°C. Around 80% As and Cd fly away from fly ash sintered at 1,000°C, and almost total As and Cd volatilize from fly ash sintered at 1,200°C, which is shown in Fig. 5.24(C) and (D). Volatilization ratio of Zn, which is shown in Fig. 5.24 (E), is much smaller than that of the above four heavy metals after being sintered at the same temperature. Close to 60% Zn flies away from fly ash sintered at 1,200°C. Volatilization ratios of Cr, Ni and Cu are no more than 10% after being sintered at 1200°C, which is shown in Fig. 5.24(F), (G) and (H).
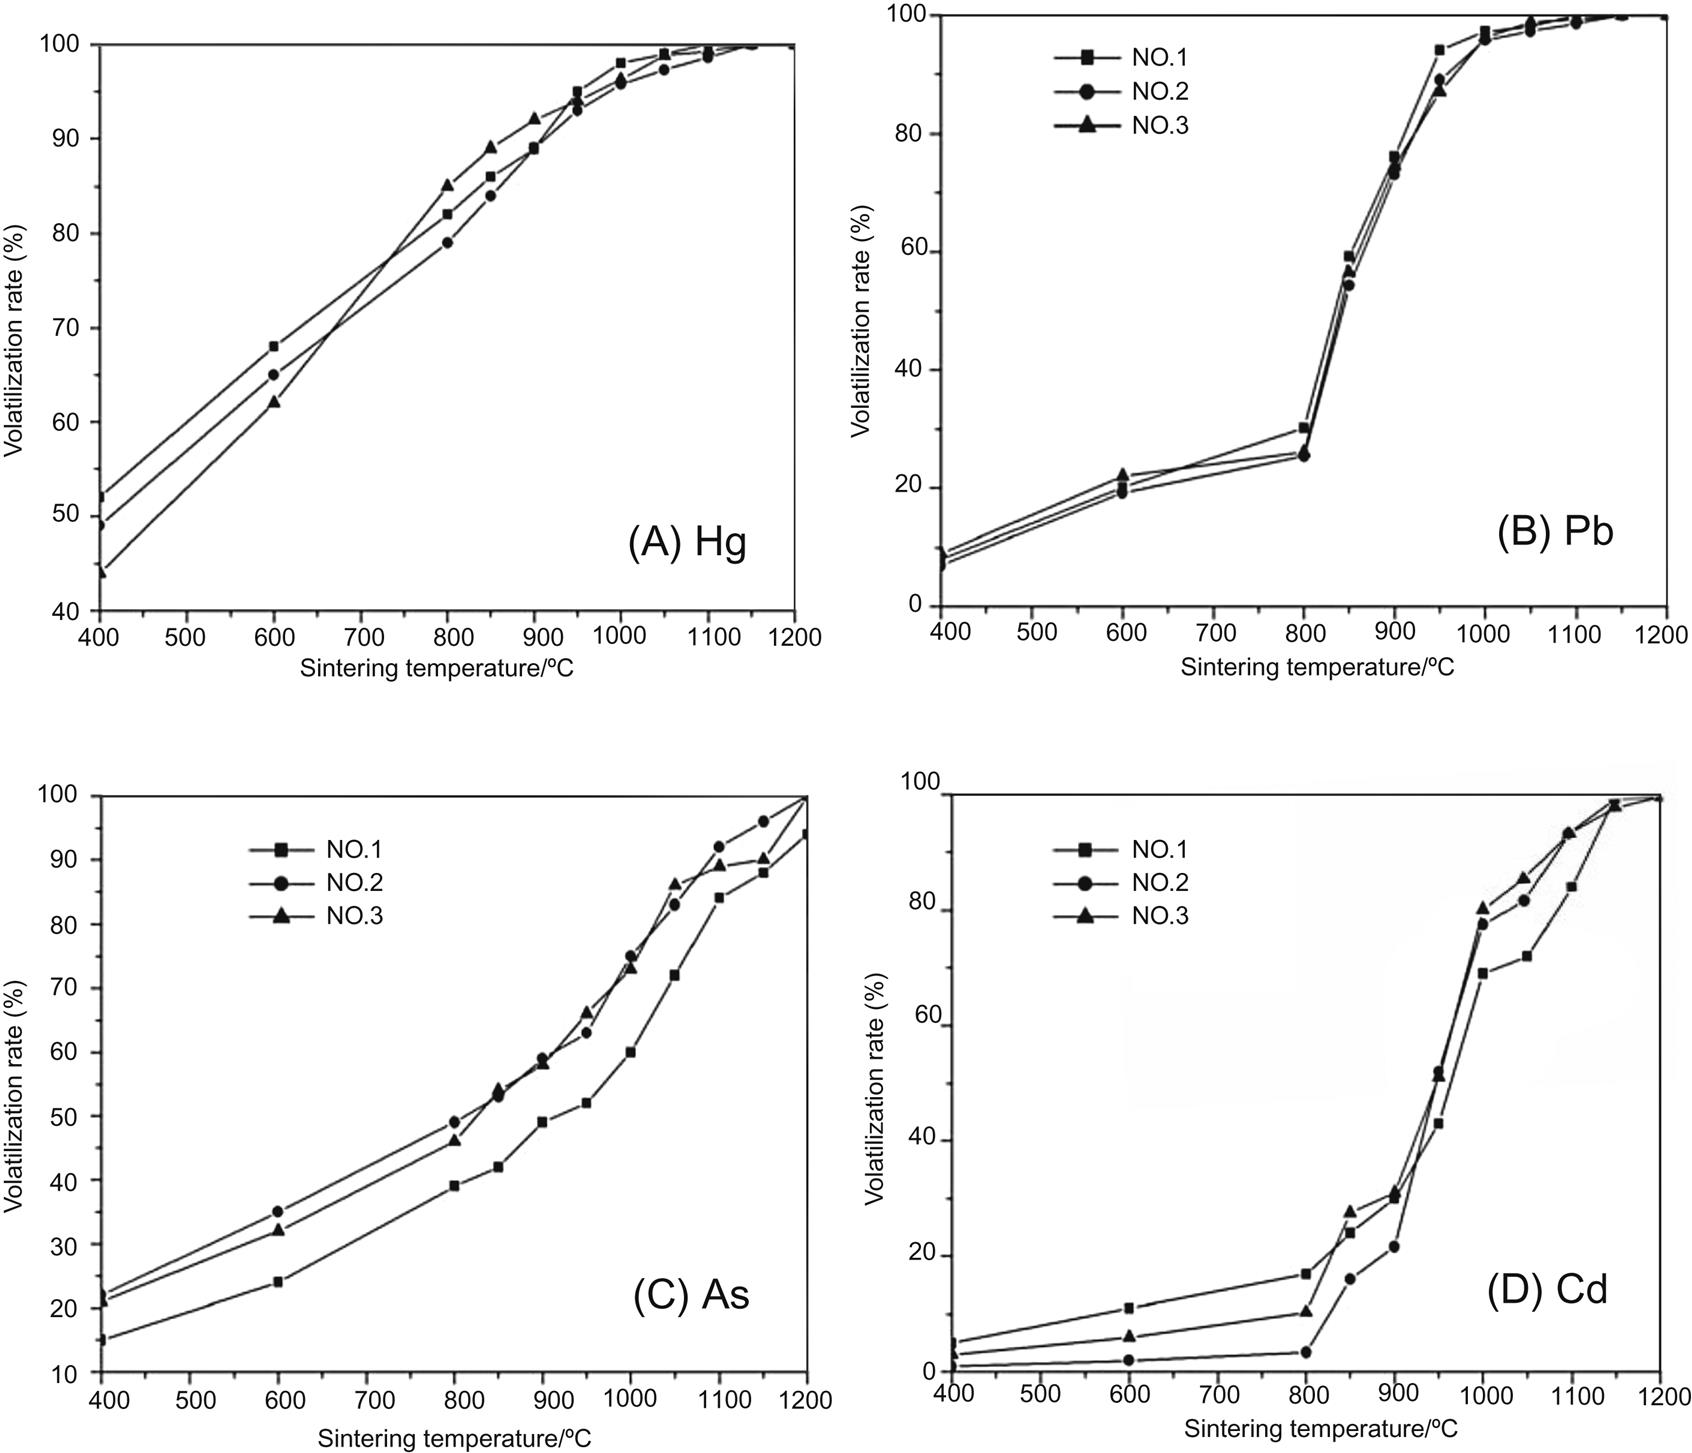

Based on the above analysis of volatilization of heavy metals, volatility of heavy metals decreases as: Hg > Pb > Cd, As Zn > Cr, Ni, Cu. It is easy for Hg, Cd, As and Cd to volatilize, and a little difficult for Zn and difficult for Ni, Cr, and Cu to fly away from fly ash, with the increase of sintering temperature. Hence, exhaust gas from the thermal treatment of fly ash contains a lot of heavy metals, especially Hg, Pb, Cd and As, and thus should go through further treatment.
Contents of heavy metals follow a sequence of Zn > Pb > Cu > Cr > As > Ni > Cd approximately Hg in both plants, and total heavy metals account for ≤1% by mass of fly ash. Leaching toxicity shows that major hazardous heavy metals are As, Cd, Hg, Pb and Zn. Soluble Cd mainly exists in the acid, exchangeable and water soluble phases, soluble Hg mainly in acid and water soluble phases, while soluble Pb mainly appears in acid soluble and soluble Zn and As mainly in bound to organic matter and acid soluble, in terms of fly ash At room temperature.
Contents of calcium-silicates, aluminosilicate, and glass phases increases steadily from the first step to the fifth step, indicating that extraction ratios of heavy metals should decrease with the increase of their content. In other words, content of glass phases, as well as that of Ca, Si, and Al can influence leaching behavior of heavy metals, and thus fly ash can be stabilized by increasing their content in the stabilized body.
Measured leaching results are well consistent with the simulated ones for Cu, Pb and Zn at pH between 0 and 13, while for Ni, As, Cr, Hg, and Cd, they are consistent only when pH is over 1.5, 2.5, 5, 9.5, and 11 respectively, indicating that simulated ratios reflect actual leaching behavior of the former three metals but can’t always reflect that of the latter five heavy metals. Cu, As, Cr, Hg, Cd, and Ni can be leached out in strong acidic conditions, but relatively safe under strong basic conditions. In terms of Zn and Pb, it is easy for them to be leached out at both strong acidic and basic environment.
Volatility ratio of heavy metals follows a sequence of Hg > Pb > Cd, As > Zn > Cr, Ni, and Cu. It is easy for Hg, Pb, As and Cd to volatilize, which fly away almost entirely at 1,200°C. It is relatively difficult for Zn to volatilize, around 60% of which flies away at 1,200°C, and it is difficult for Cr, Ni and Cu to volatilize, volatilization ratios of which are no more than 10%.