
Humans are visual animals. They remember pictures a lot better than words. As such, it is useful to use diagrams to quickly display information. Thus, you need a good diagram editor.
The Dia Diagram Editor program is such an editor and is similar to Microsoft Visio .
Diagrams are used for things such as process flow (flowcharts), network layout, organization charts, and maps. In fact, one of the most famous diagrams is of the London Underground tube system. The diagram is considered one of the finest examples of the art, presenting the traveler with the information needed in a clear and concise manner while eliminating irrelevant details.
In this chapter, you will discover how to create simple diagrams and thus distill complex information into a simple visual presentation.
Creating a Flowchart
Download Dia from http://dia-installer.de/ . Run the installer and select the defaults. Once it starts, an initial, blank diagram screen will appear, as shown in Figure 10-1.
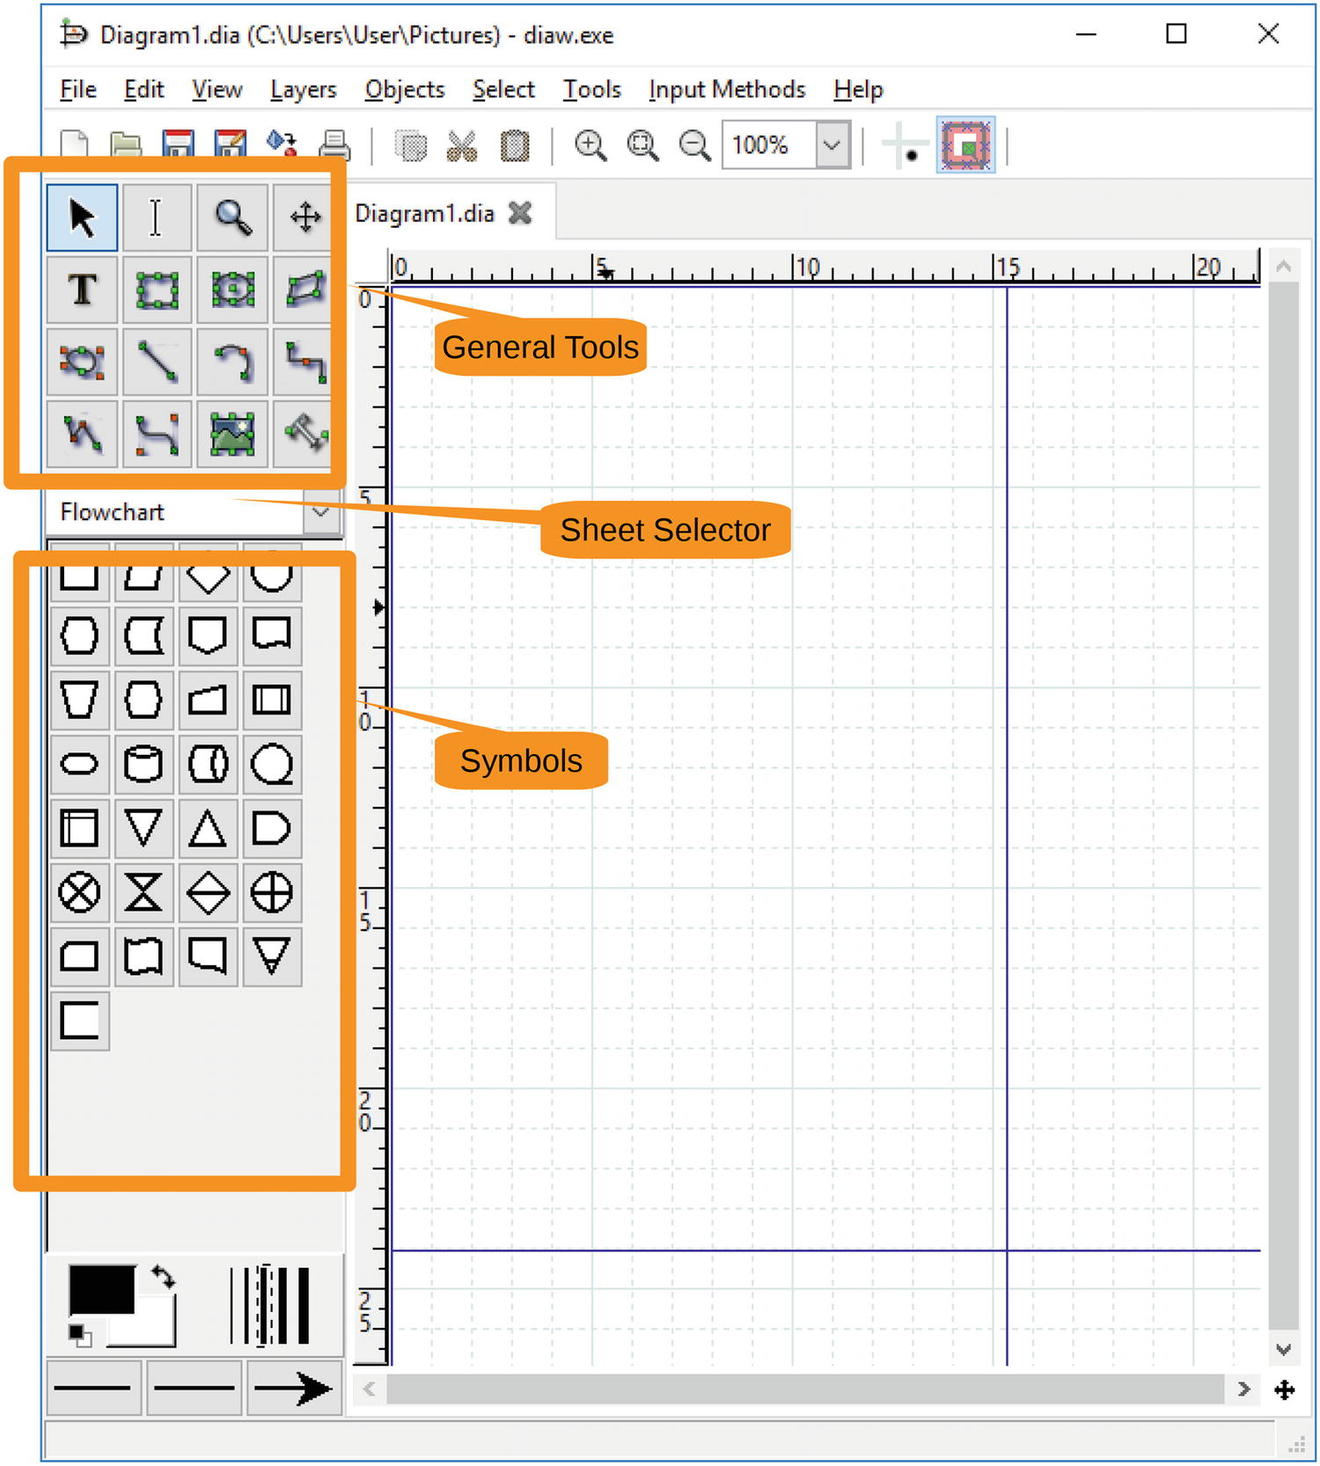
Figure 10-1 Initial Dia screen
On the left side are the tools you can use to make a diagram . Below that is a sheet selector area that allows you to select what symbols to use. Below that are the symbols themselves. The middle of the screen shows the current diagram.
For this exercise, you will create a flowchart telling you what to do in case of fire. (Somehow the letters from the Hilltop Elementary School in previous chapters gave us the idea.)
Let’s start by dragging a start/stop node (the one that looks like a hot dog) from the sheet selector area to the middle of the screen, as shown in Figure 10-2.
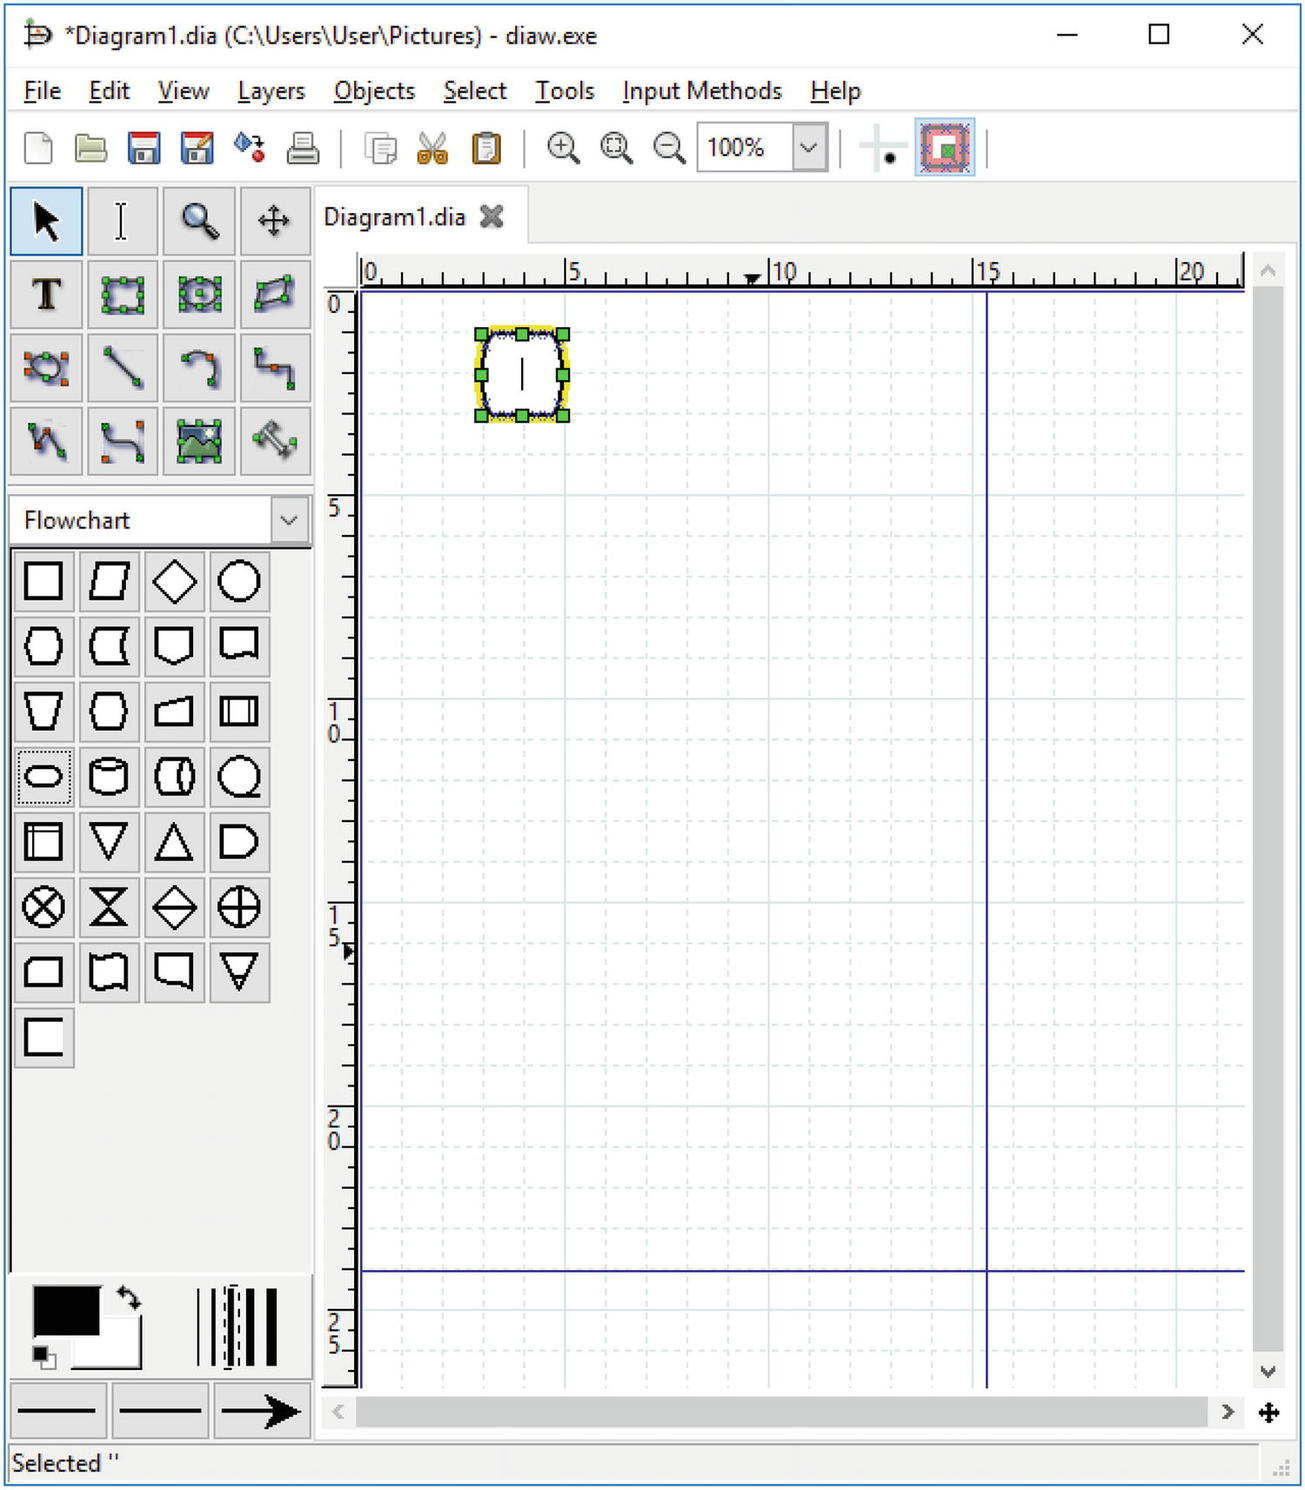
Figure 10-2 Start/start node
Note
The Dia tooltip calls this a Terminal Interrupt, but we think start/stop node is easier to remember.
Drag one of the handles sideways to make the symbol wider and type Start inside it. Figure 10-3 shows the result.
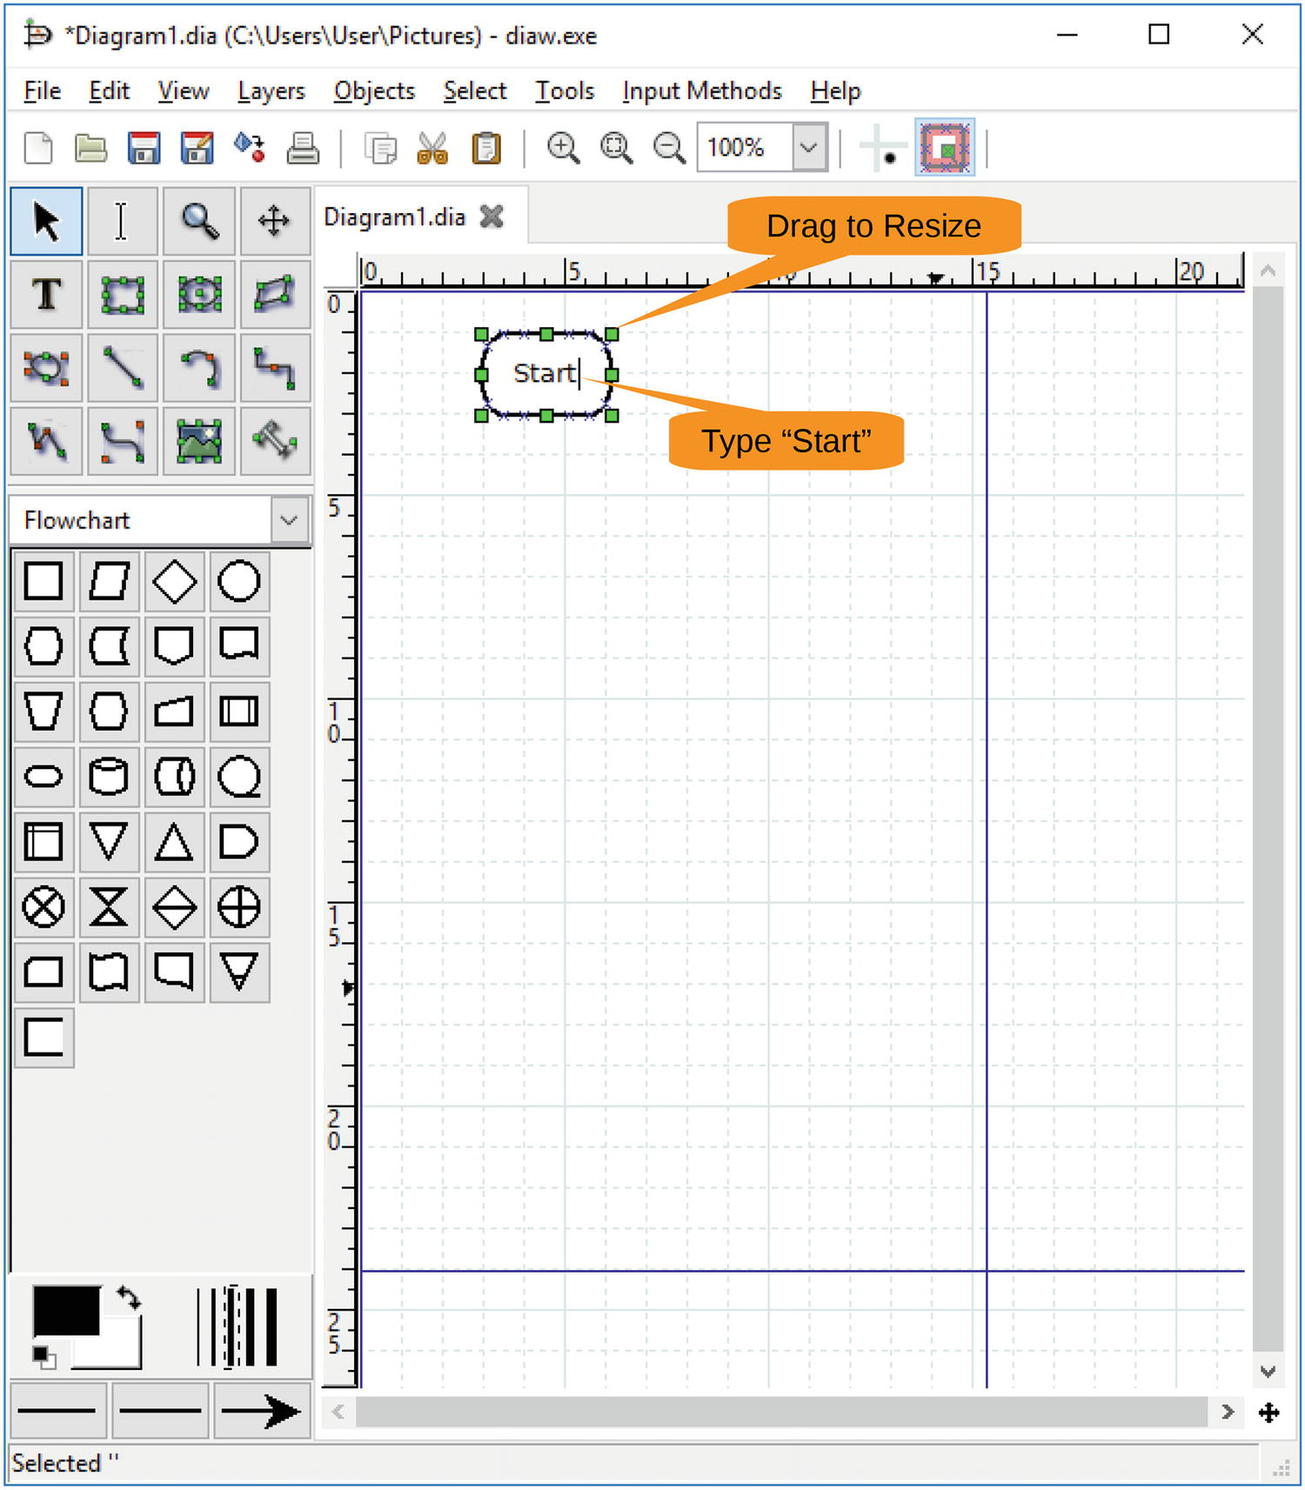
Figure 10-3 Start node in place
Disclaimer
This is not a procedure approved by the fire department or any fire professional. Its sole purpose is to demonstrate how Dia Diagram Editor works, not to describe emergency procedures.
Next let’s add a decision box (the diamond shape) to the flowchart, as shown in Figure 10-4. Enter the text Understand Disclaimer?.
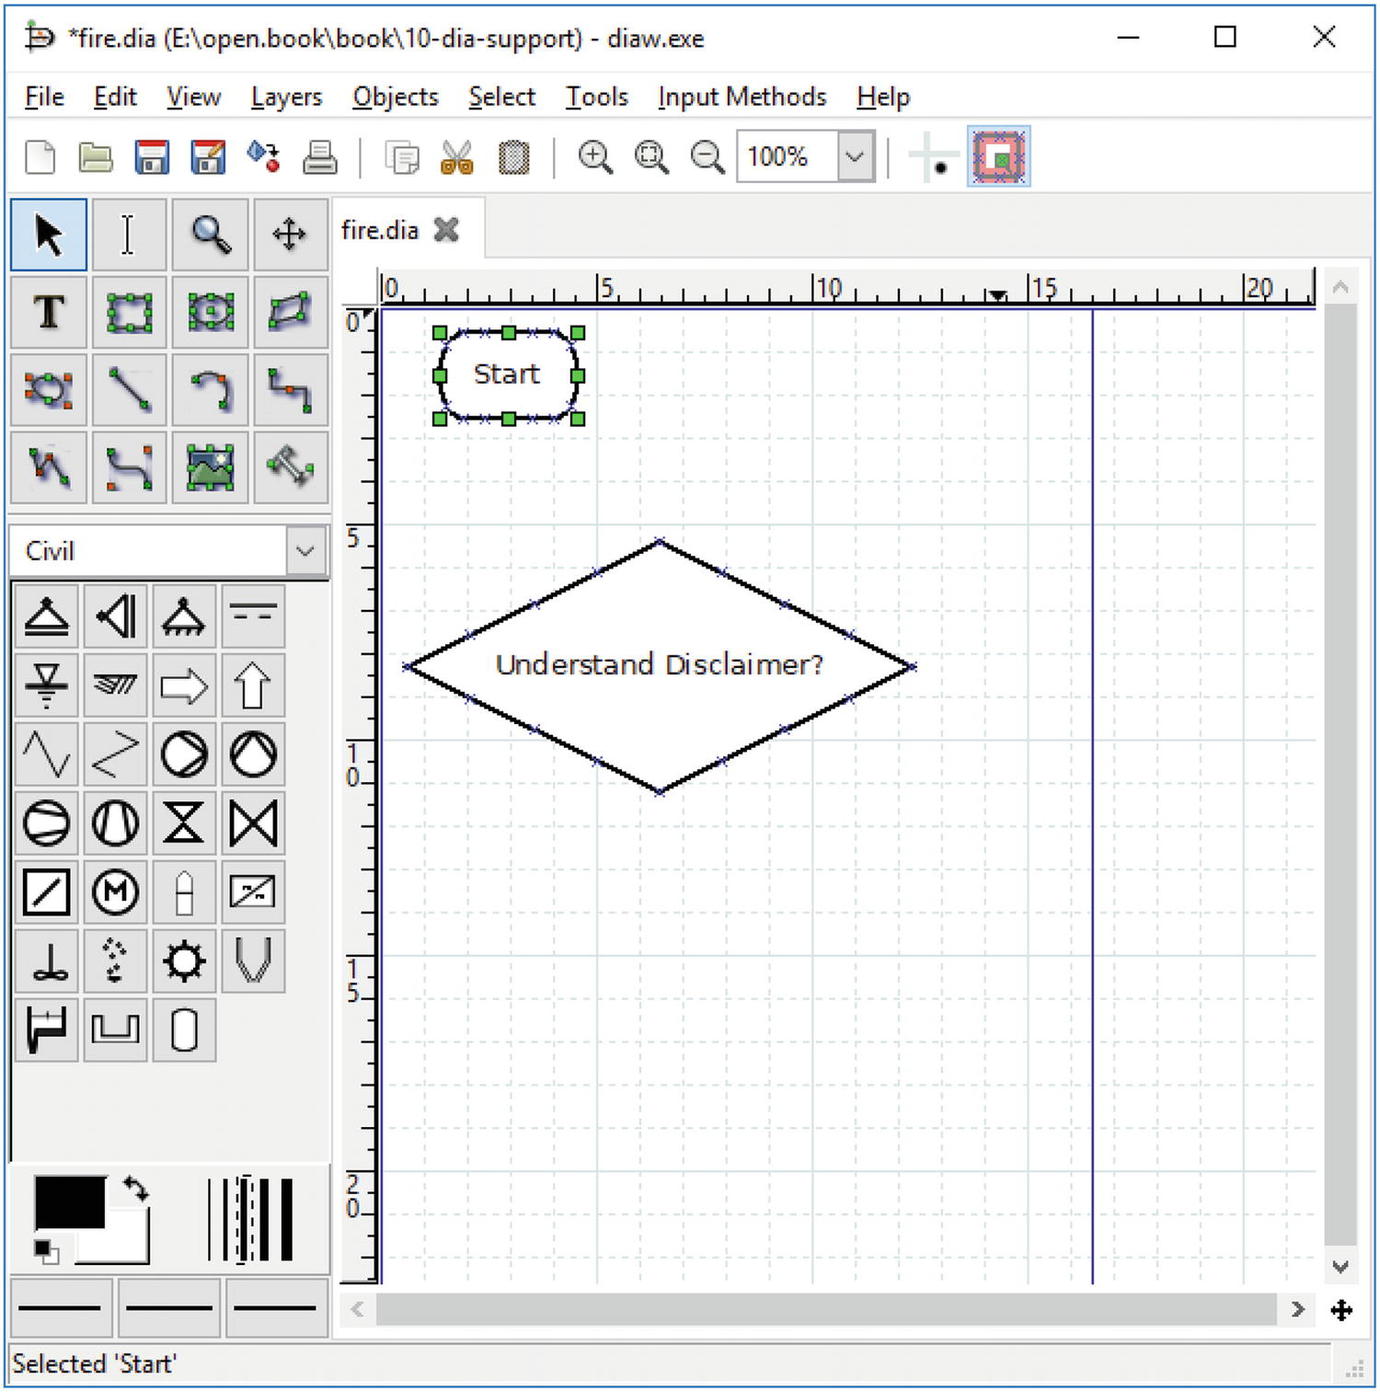
Figure 10-4 Decision box added
Now let’s connect the start with the disclaimer. Click the “zig-zag line” symbol and then click the bottom middle of the start/stop node. The program will start to draw a line. Go down to the point of the disclaimer. There are some subtle things to watch out for.
First, there are connection points on each of the nodes. These show up when the mouse is over the node and look like little green squares. Second, when you are actually connecting to a node, the node will highlight itself. In Figure 10-5, the decision node is highlighted in red, even if you can’t see it in the black-and-white illustration.
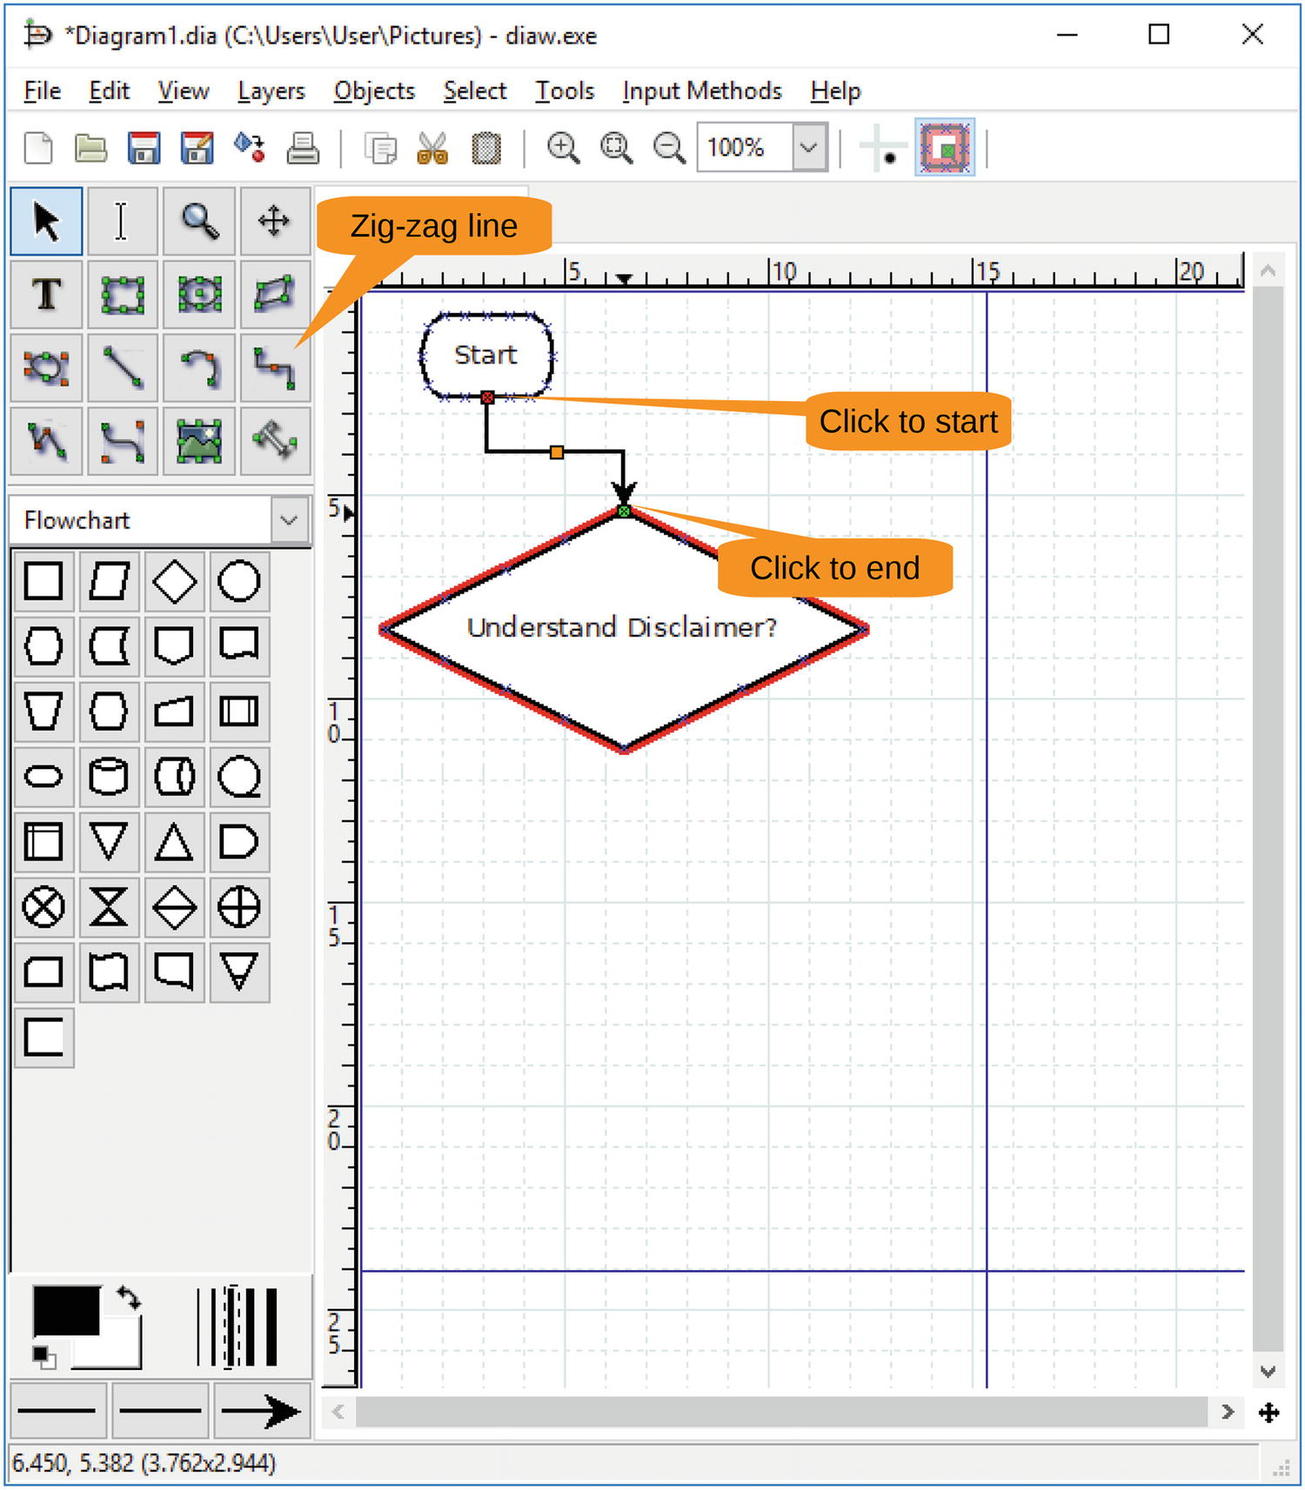
Figure 10-5 Connecting the two nodes
The start/stop node would look nicer over the decision node. So, drag it over to fix the problem. As you drag, you’ll notice that since the two nodes are connected, the connector is automatically adjusted to the new position. Figure 10-6 shows the result.
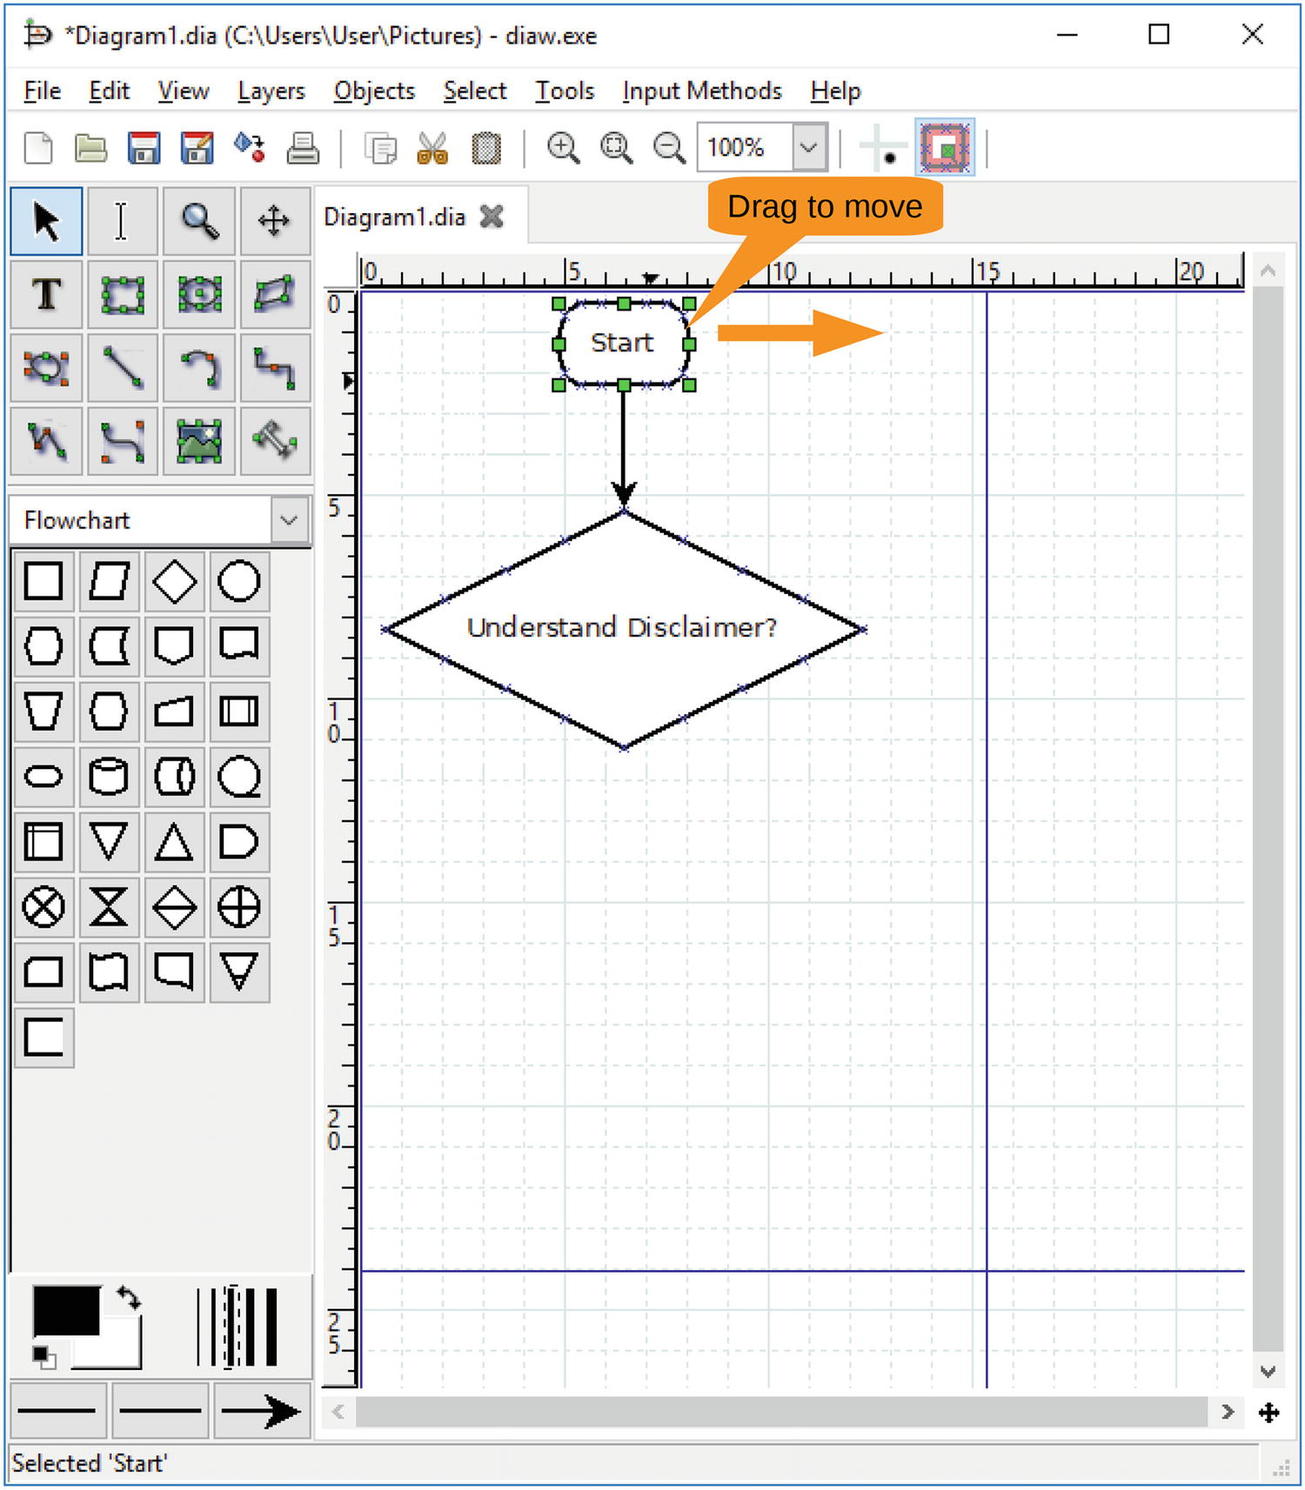
Figure 10-6 Position adjustment
Now let’s add the letter N near the right side of the decision box. Click the Text tool, click just above the right corner of the decision box, and type N. Figure 10-7 shows the result.
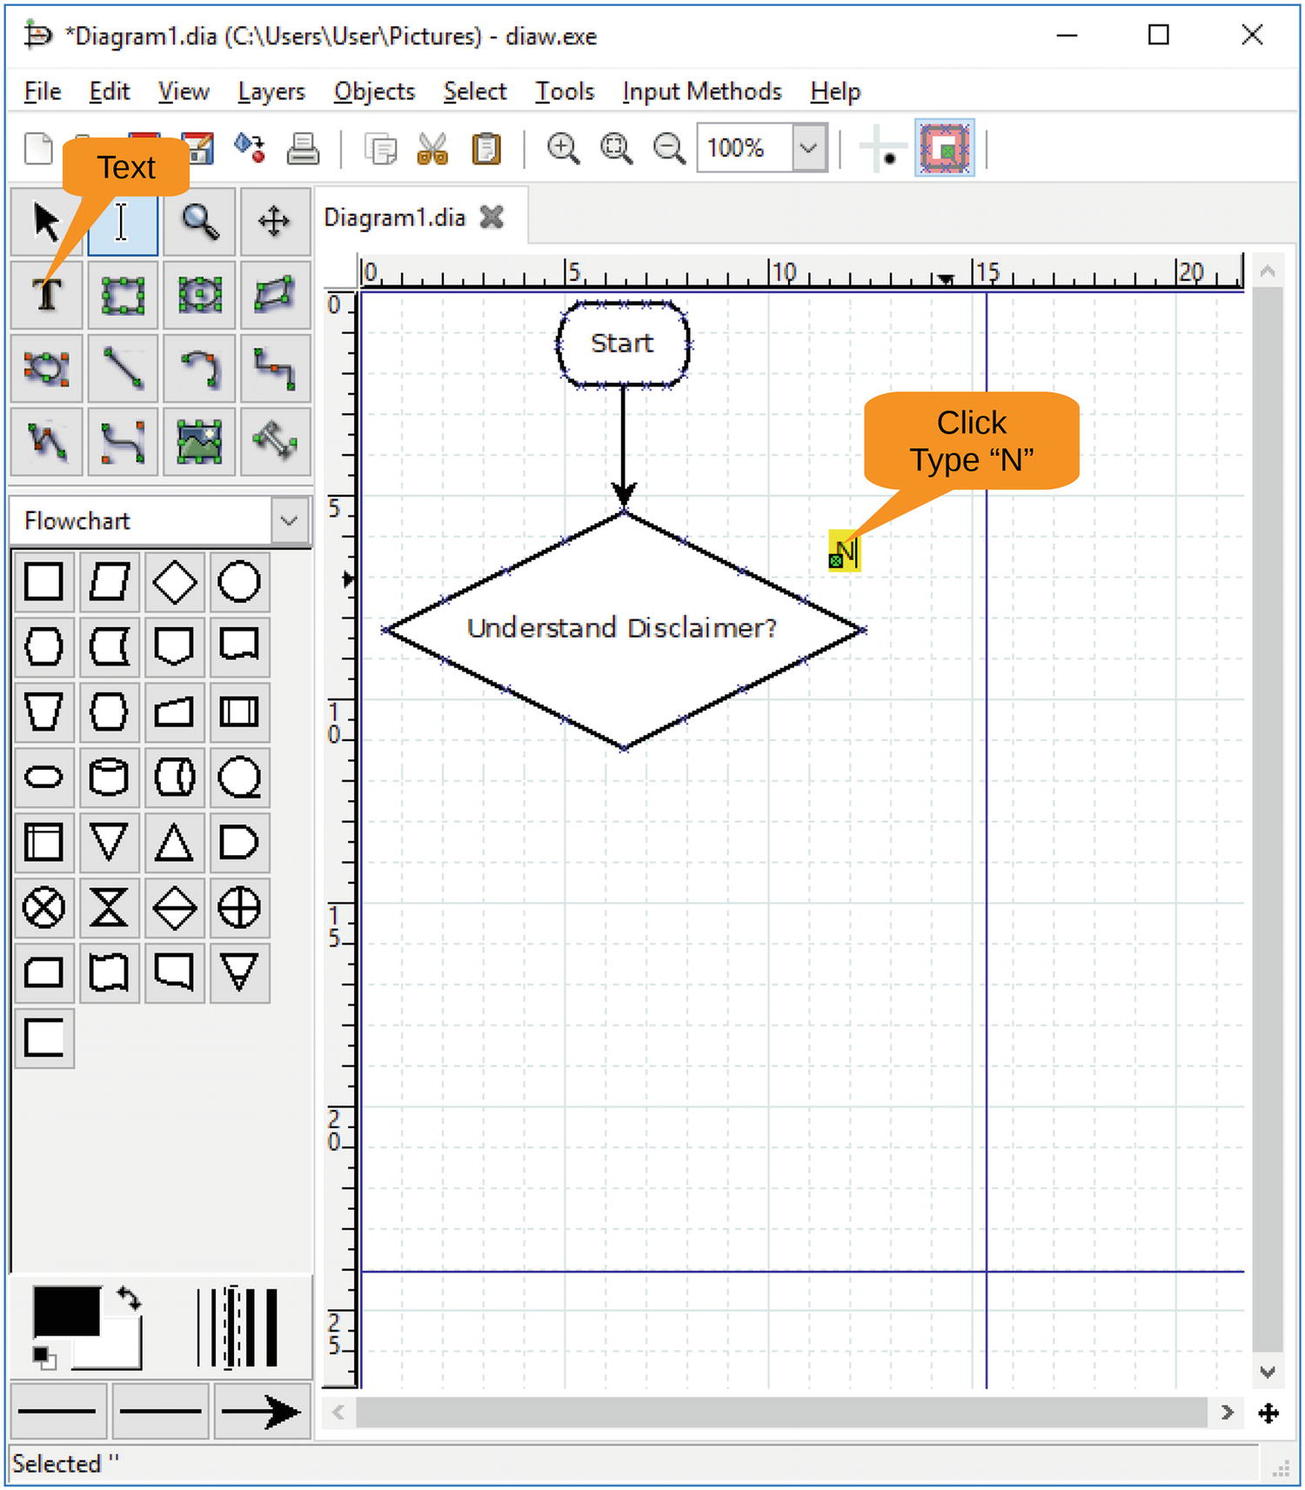
Figure 10-7 Adding “N”
Let’s continue by dragging an operation box over to the right and labeling it Read the disclaimer. Add a connector from our “N” decision to the box. The result should look something like Figure 10-8. Let’s also add a connector from the top of the box back to the line above the decision box .
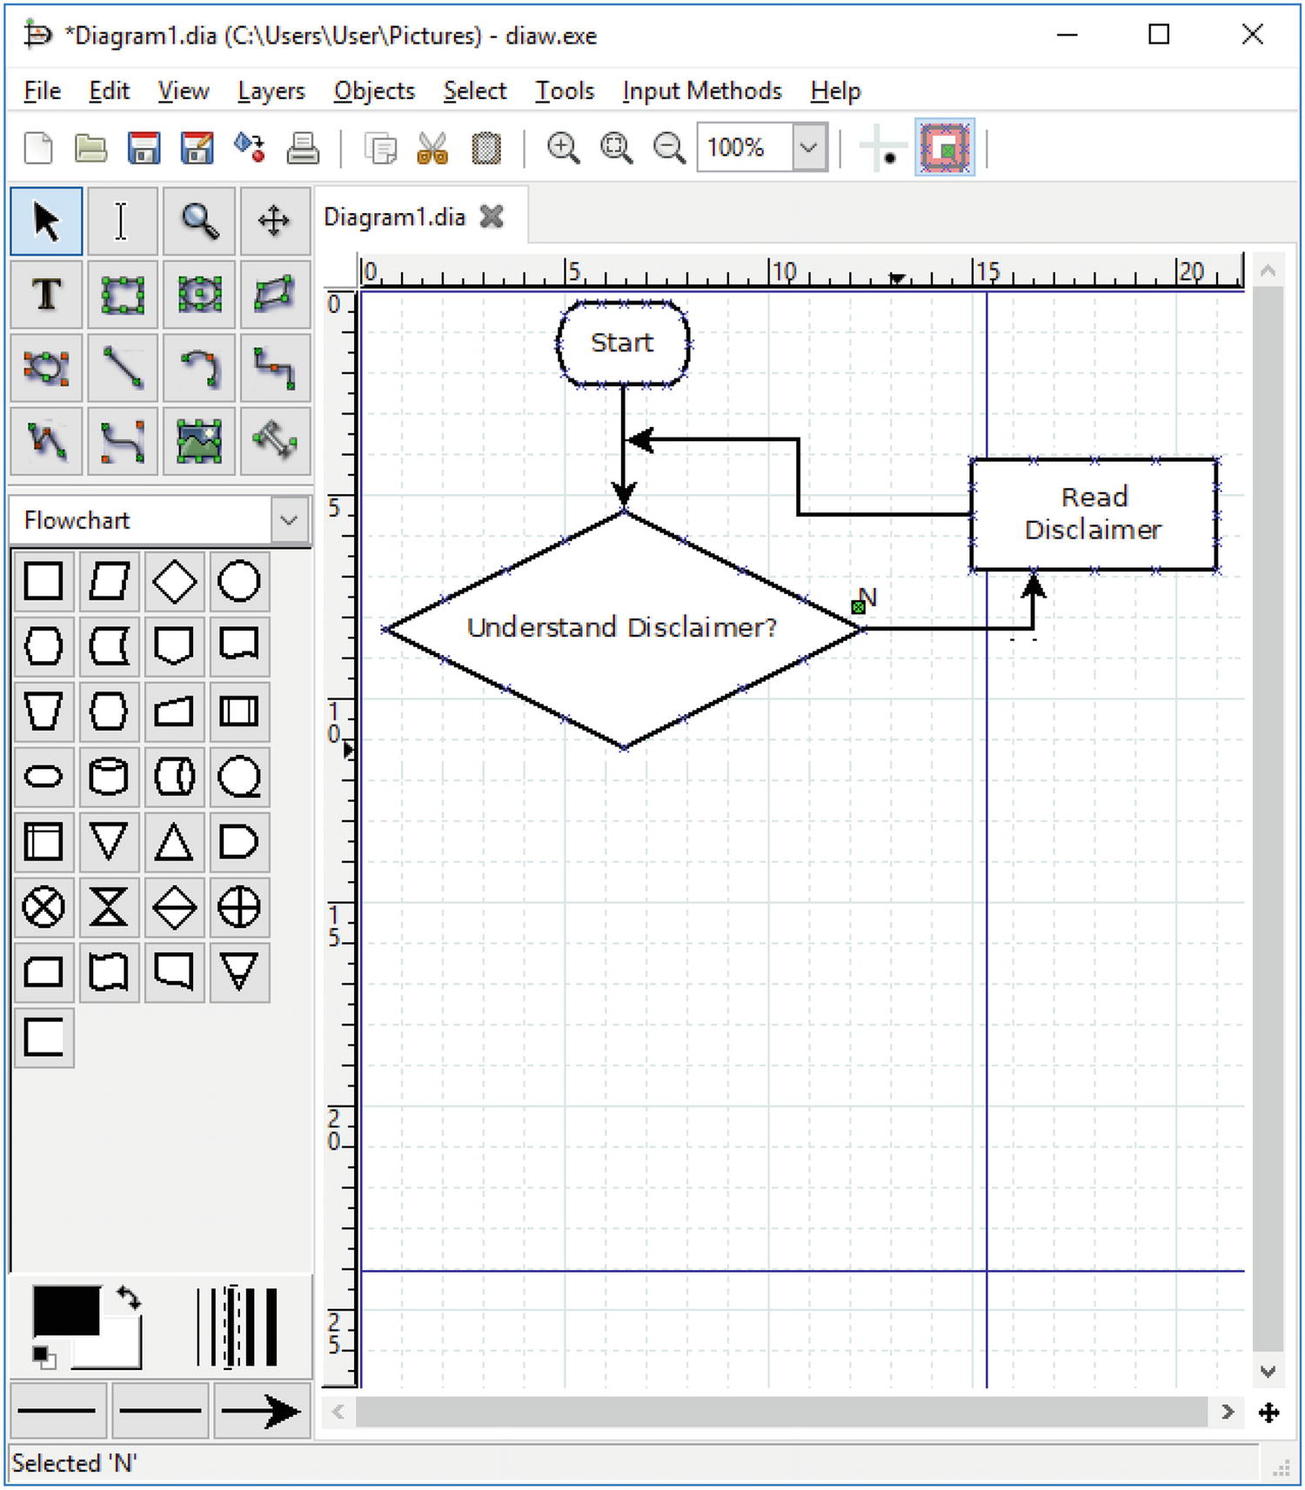
Figure 10-8 Adding an operation node
Now let’s fill in the rest of the chart by following these steps:
Add the letter Y to the bottom of the decision box.
Put an operation box below it with this text: Shout ‘Fire’ in a loud voice.
Add a second operation box with this text: Get out very fast.
Add a final start/stop node that says Done.
Add connectors for all these nodes.
Figure 10-9 shows the result so far.
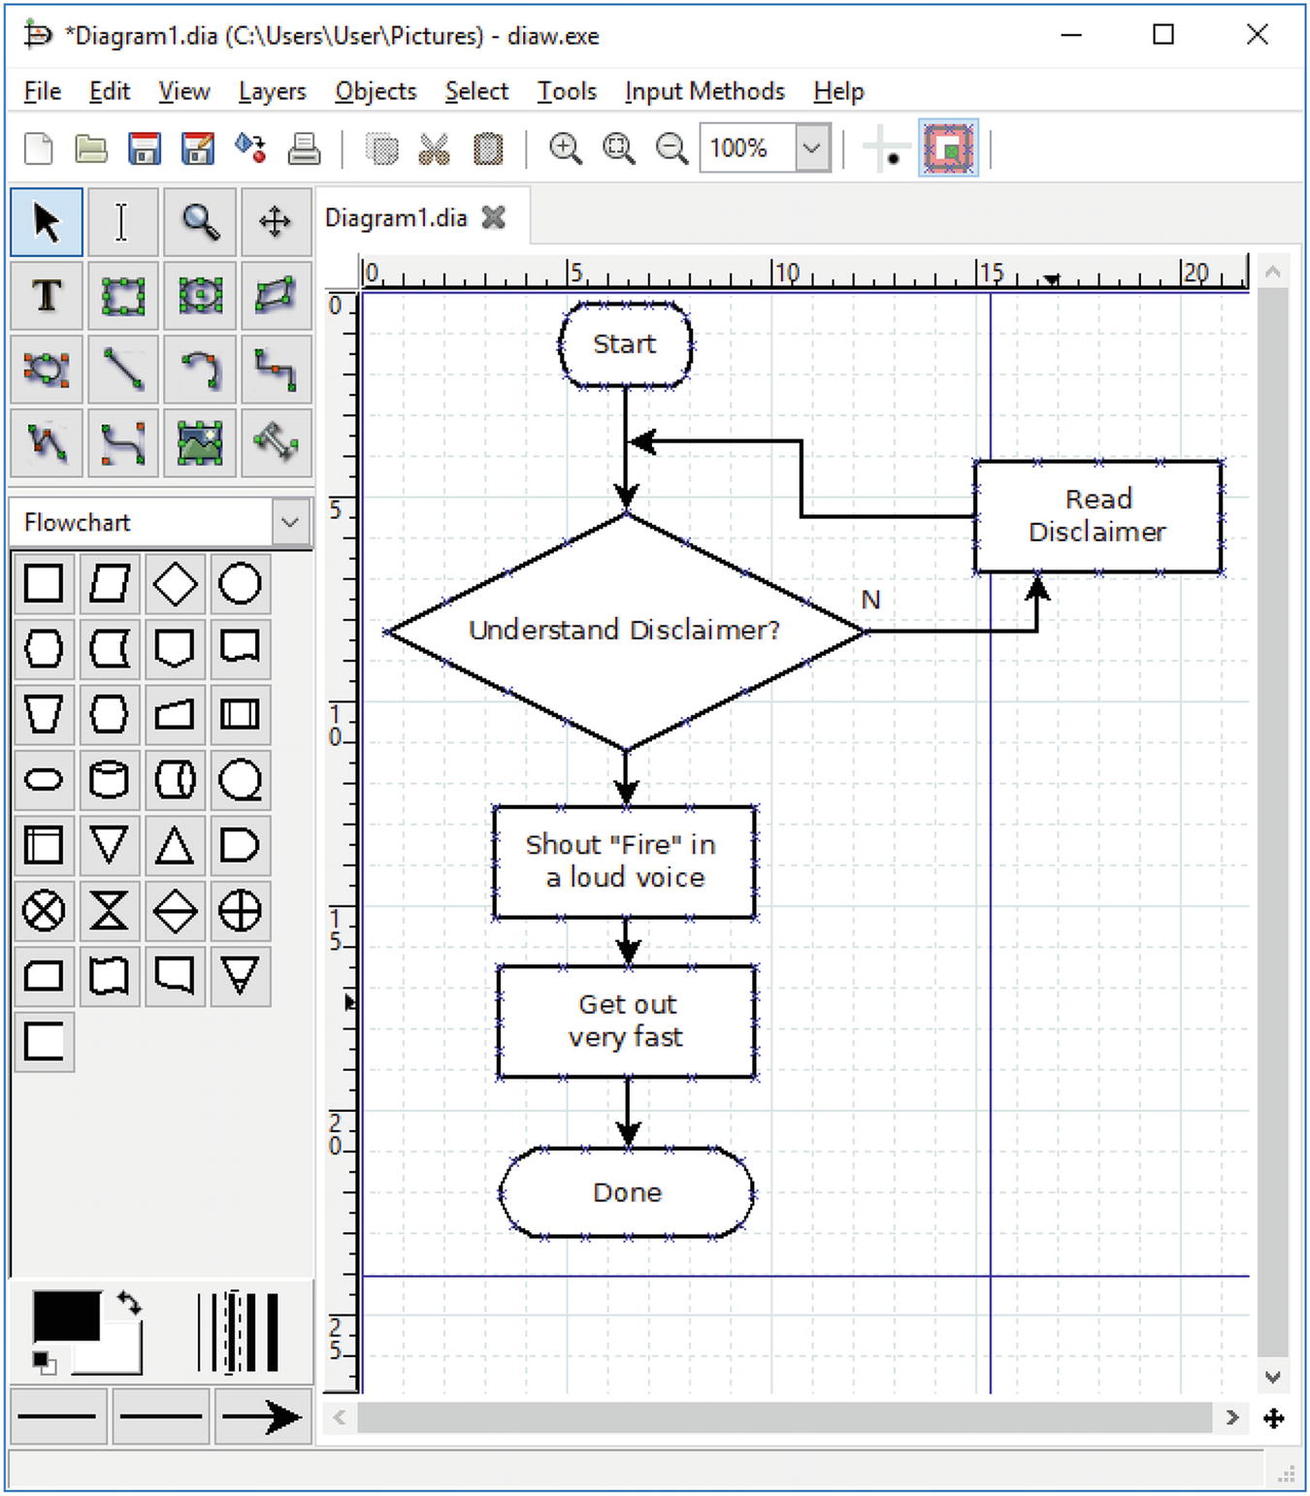
Figure 10-9 Finished diagram, almost
There is just one remaining problem. The blue lines indicate page boundaries, so this diagram takes up multiple pages. You want it on one page. To fix this, let’s select File ➤ Page Setup, as shown in Figure 10-10.
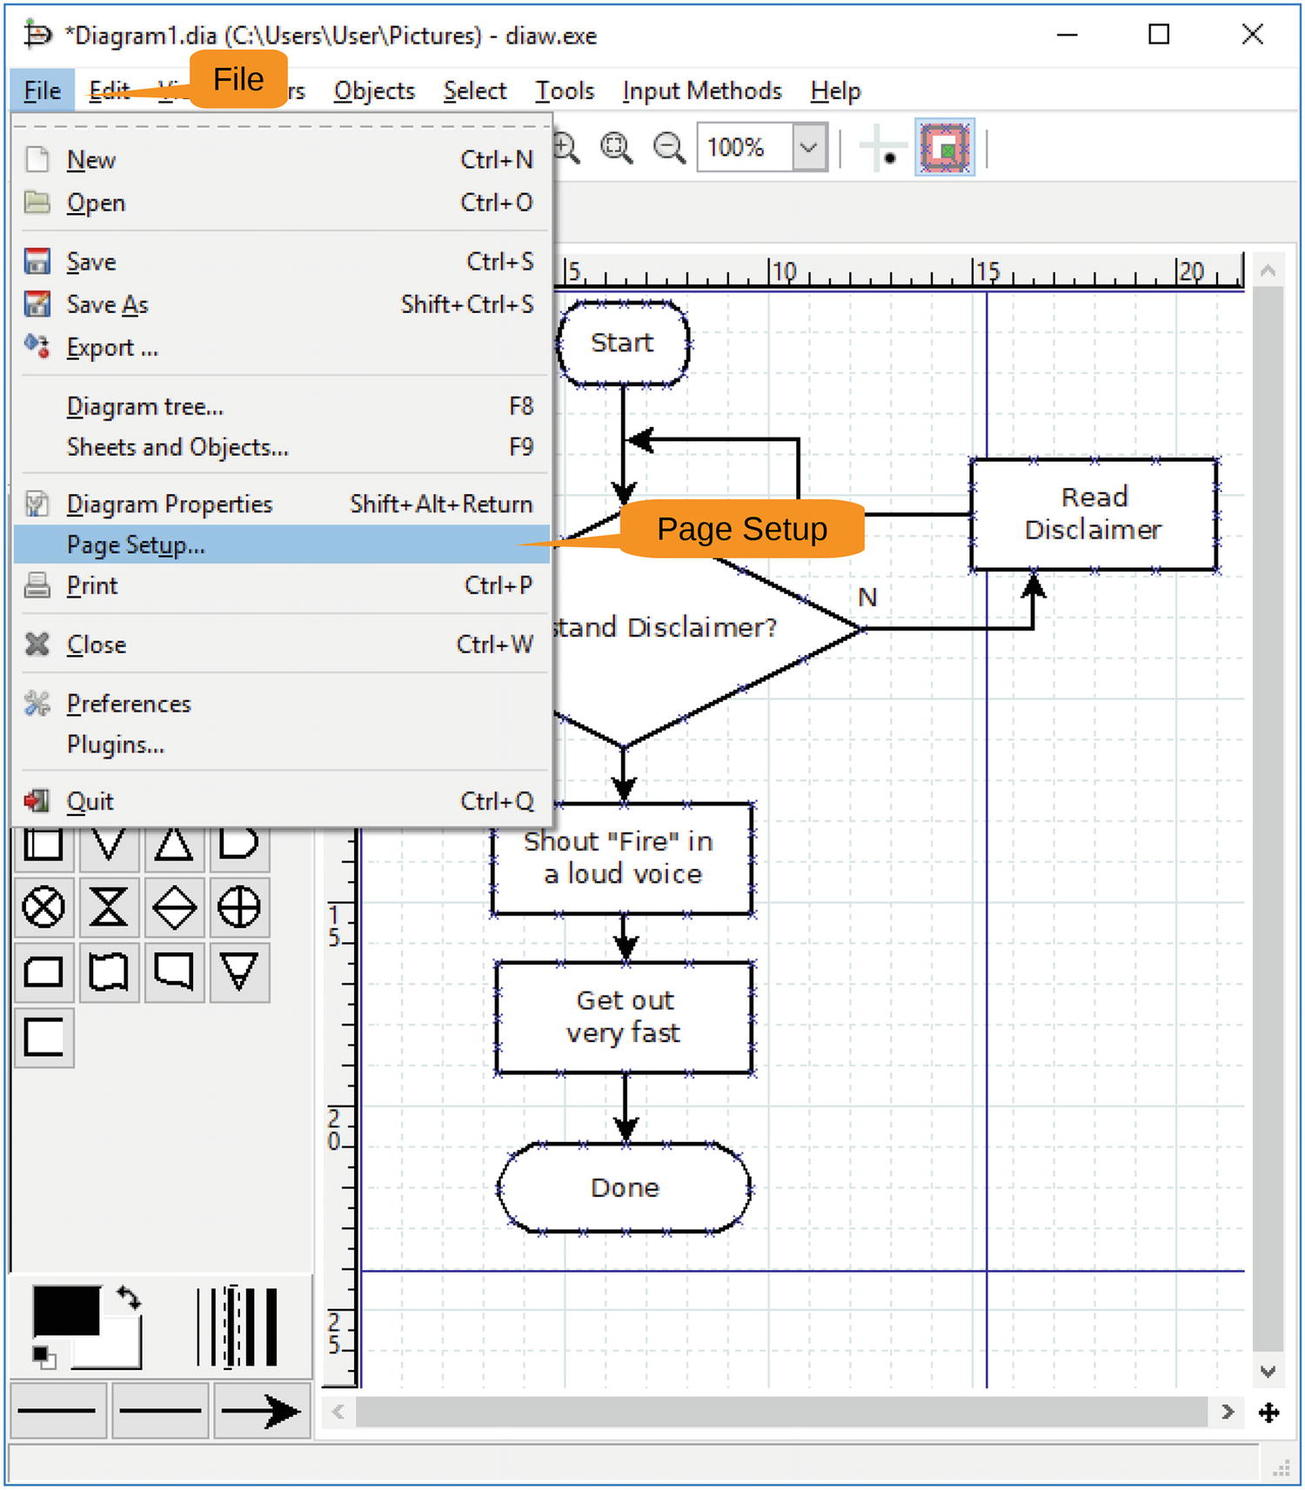
Figure 10-10 Page Setup menu item
The Page Setup dialog appears, as shown in Figure 10-11.
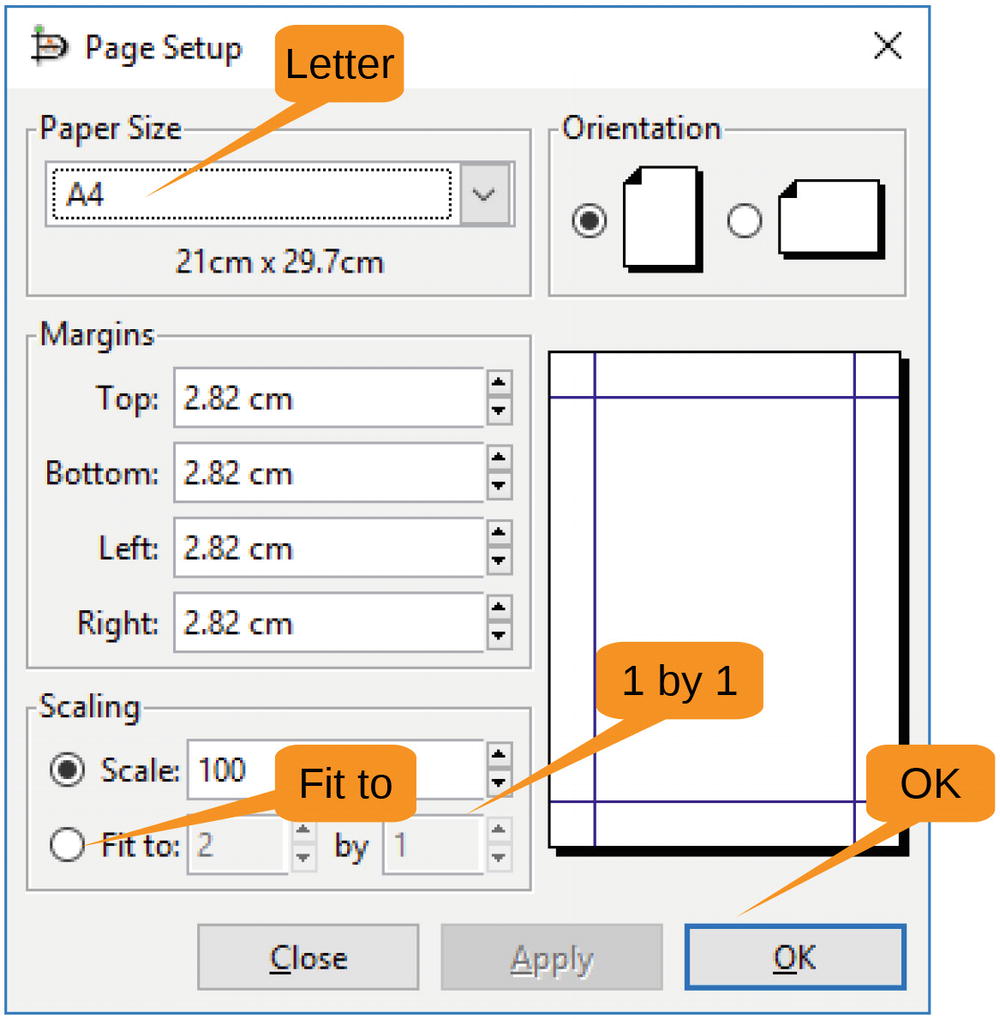
Figure 10-11 Page Setup dialog
We’re in the United States, so first change the paper size to Letter. Next go to the Scaling section, click “Fit to,” and set the parameters to 1 by 1.
Click OK. Notice that the page boundaries have shifted, as shown in Figure 10-12. This diagram is now on one page.
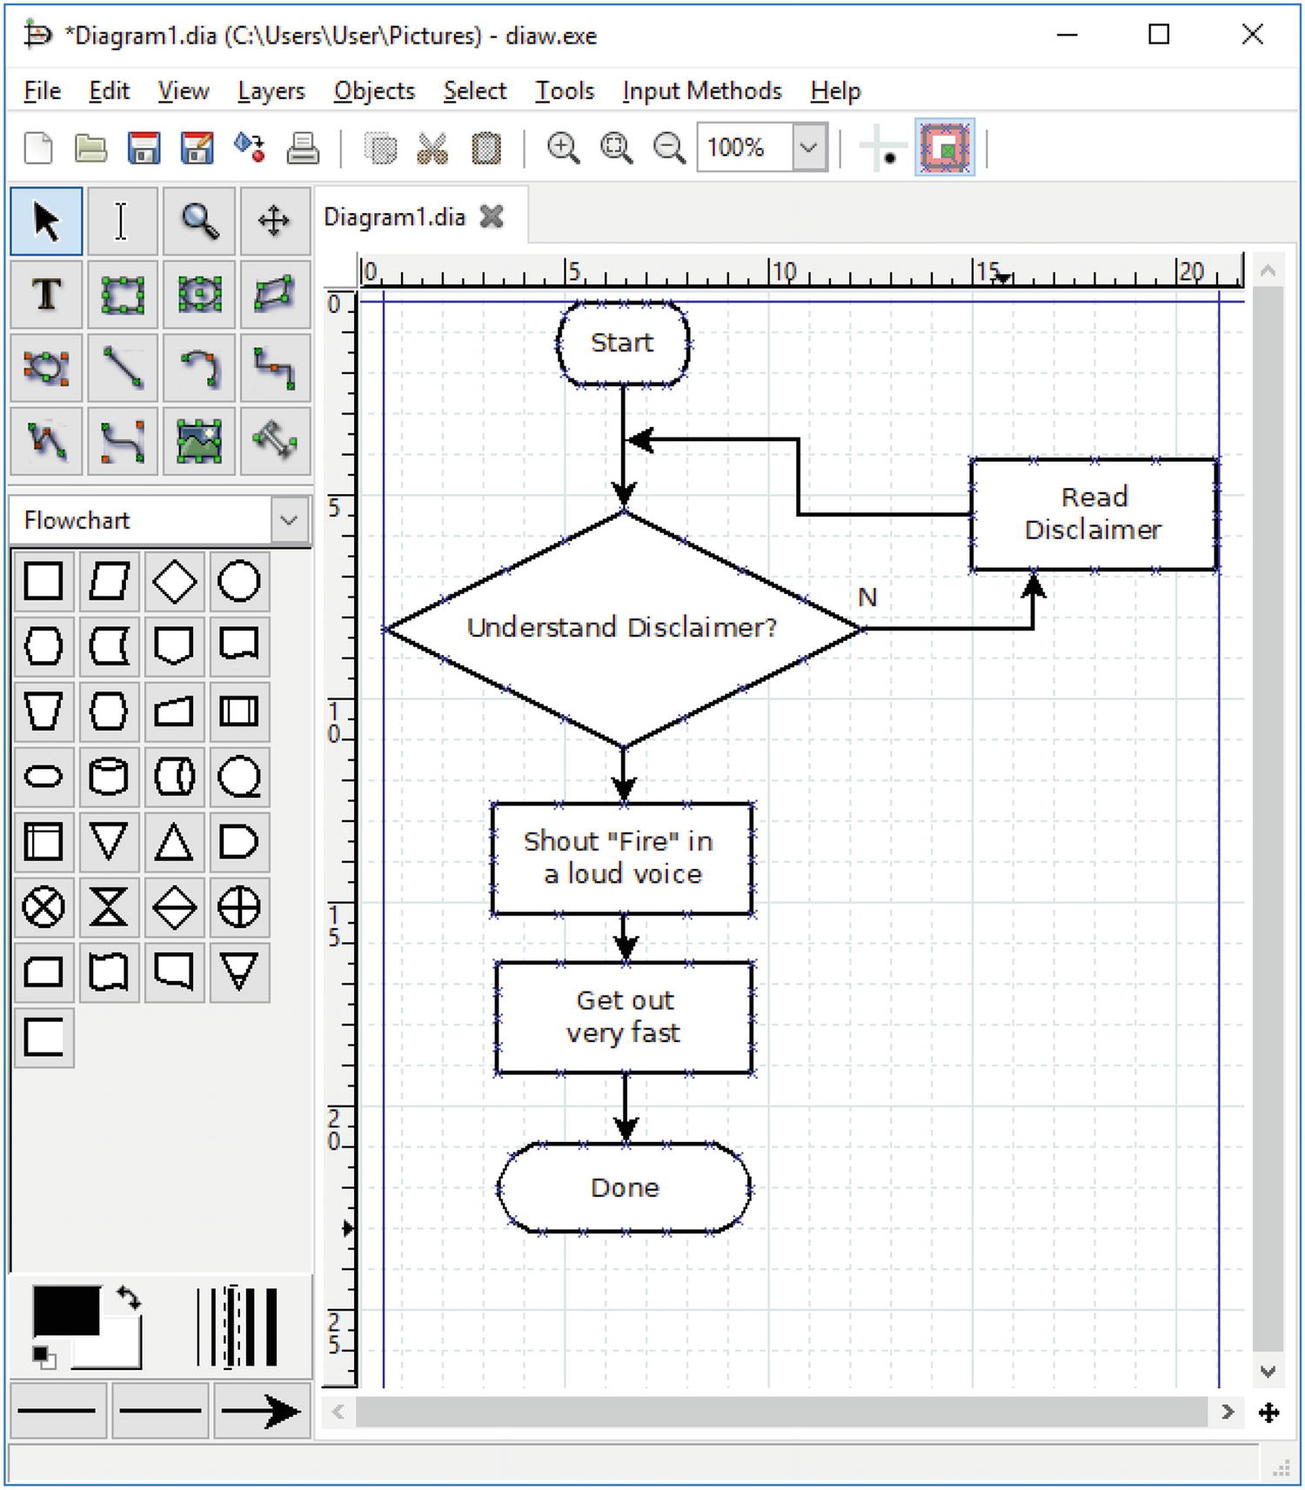
Figure 10-12 Final diagram
Now all you have to do is execute File ➤ Save and you’ve got the procedure for what to do in case of fire. In practice, you probably want to add a few steps, run it by a safety office, and print up some posters. The procedure is the same even if the content isn’t.
Creating an Electrical Diagram
You’ve just completed a flowchart, so now let’s try creating an electrical diagram . Pretend you work as a volunteer signal maintainer at the Orange Empire Railroad Museum and you’re creating a wiring diagram for one of the signals.
You start by bringing up the electrical symbols sheet by going to the sheet selector and selecting Other Sheets ➤ Electrical, as shown in Figure 10-13.
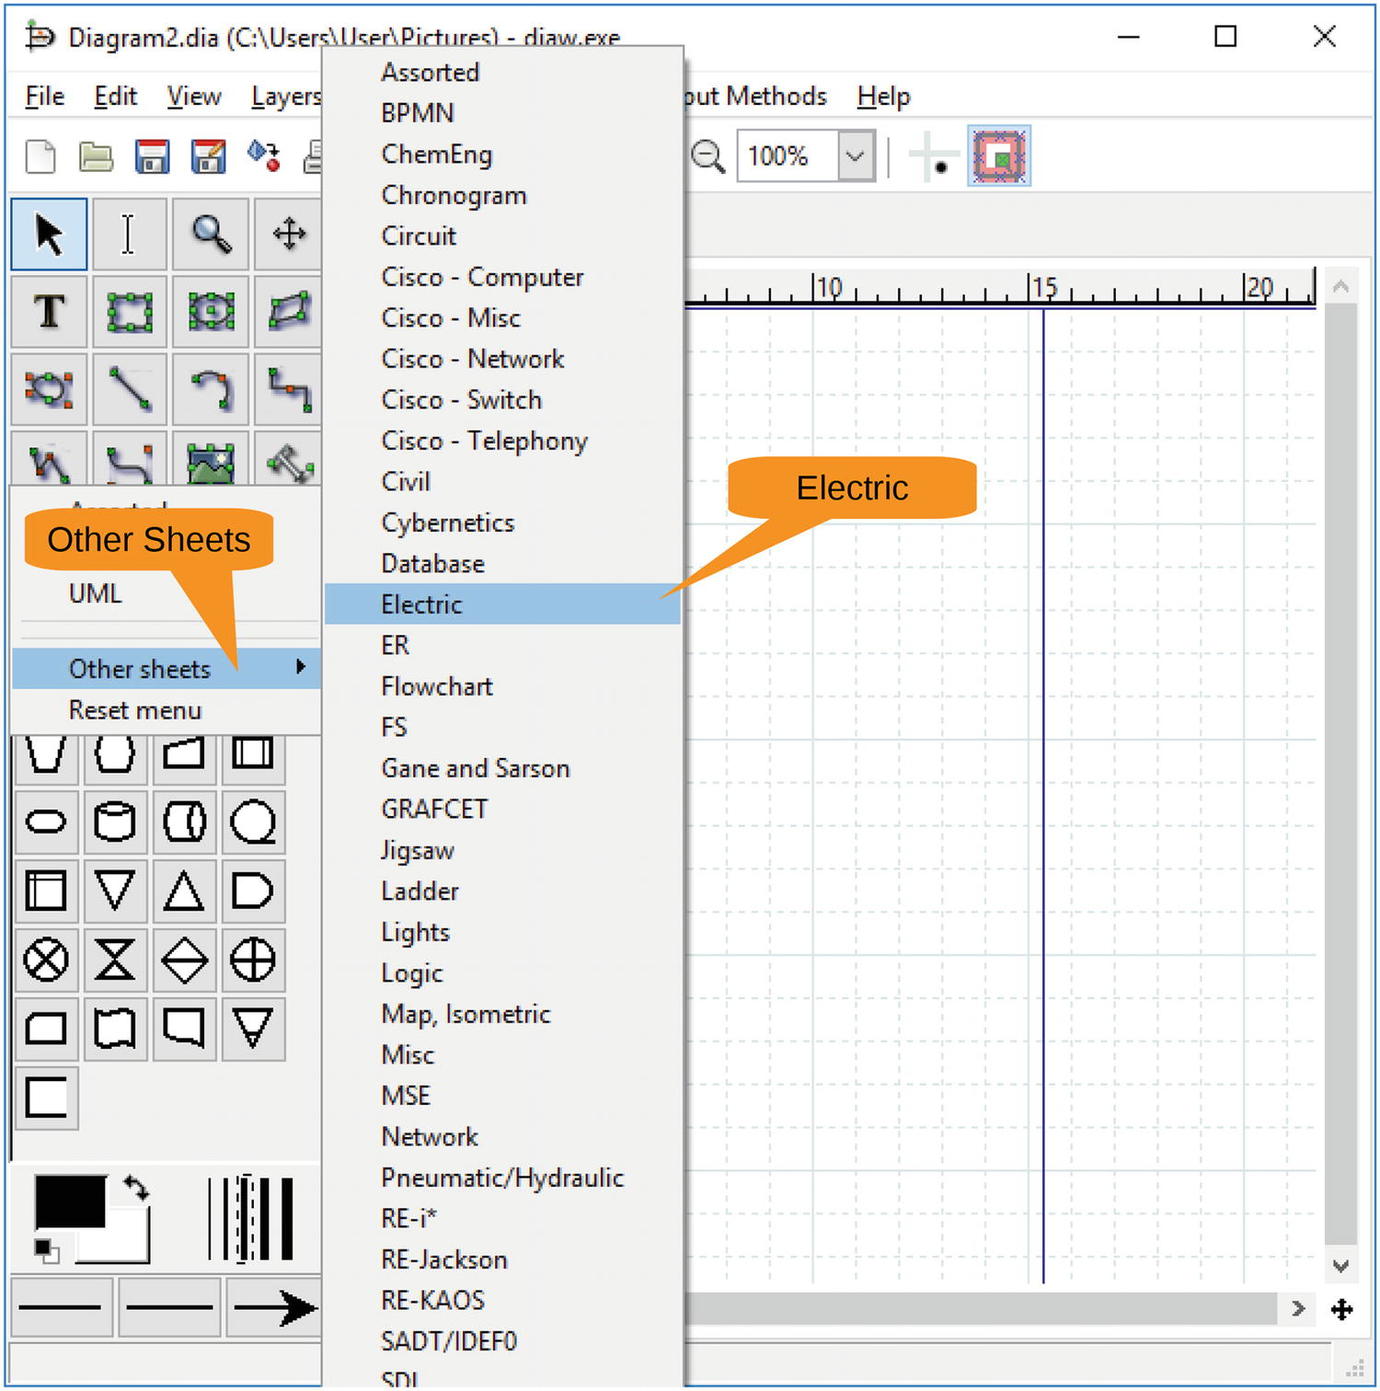
Figure 10-13 Bringing in the electrical symbols
At the center of the signal is a relay. You construct this from a relay command organ (horizontal) and a normally open contact. Figure 10-14 shows the results.
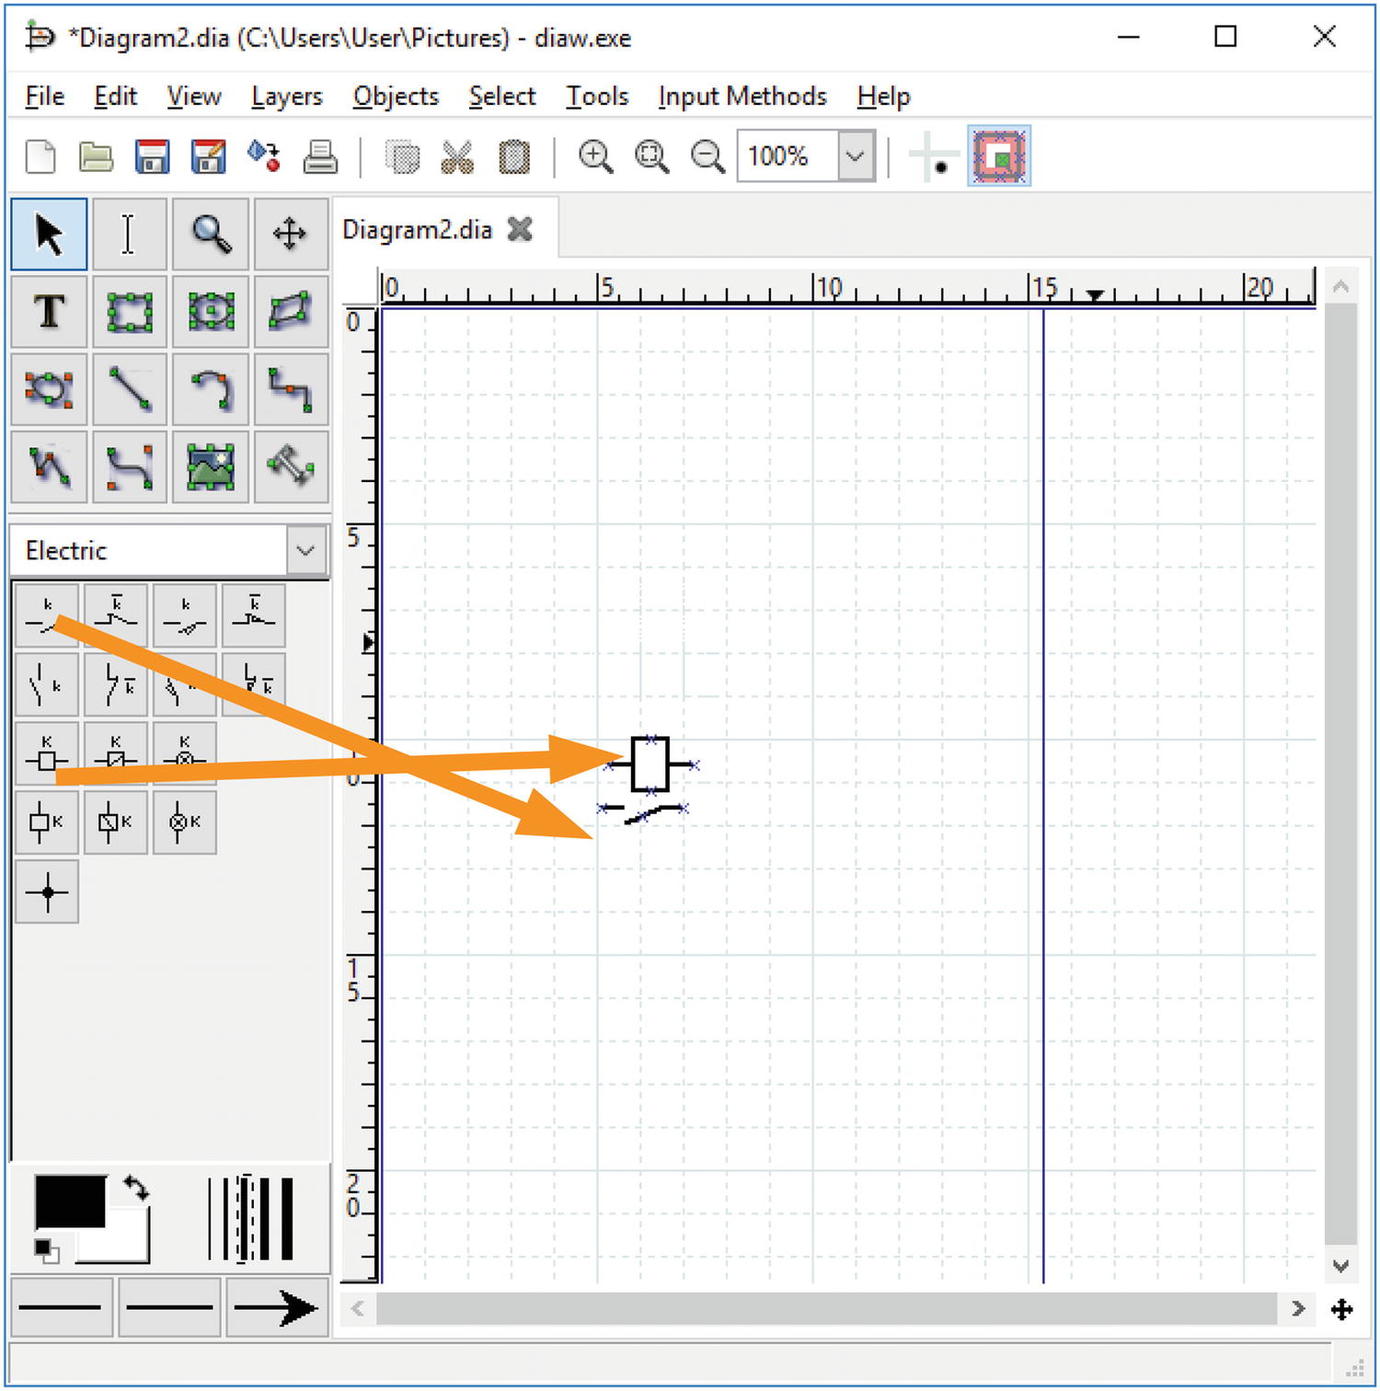
Figure 10-14 Relay
Note
Because of the way railroad relays are constructed, the contacts go under the coils as shown, not on top as would be the case with any other type of relay.
Now you need to connect the contacts with the railroad signal. Unfortunately, Dia does not have a railroad signal symbol set (yet), so you’re going to have to make do. Let’s use a bell.
However, there isn’t a bell in this symbol sheet, and an exhaustive search of the other sheet leaves you without a bell.
So, what do you do? Go to the Internet and search for Dia symbol bell. You found a page with the Liberty Bell on it, so refine your search to Dia diagram symbol bell.
This takes you to an add-on sheet for Dia for electronic symbols, which is displayed in Figure 10-15.
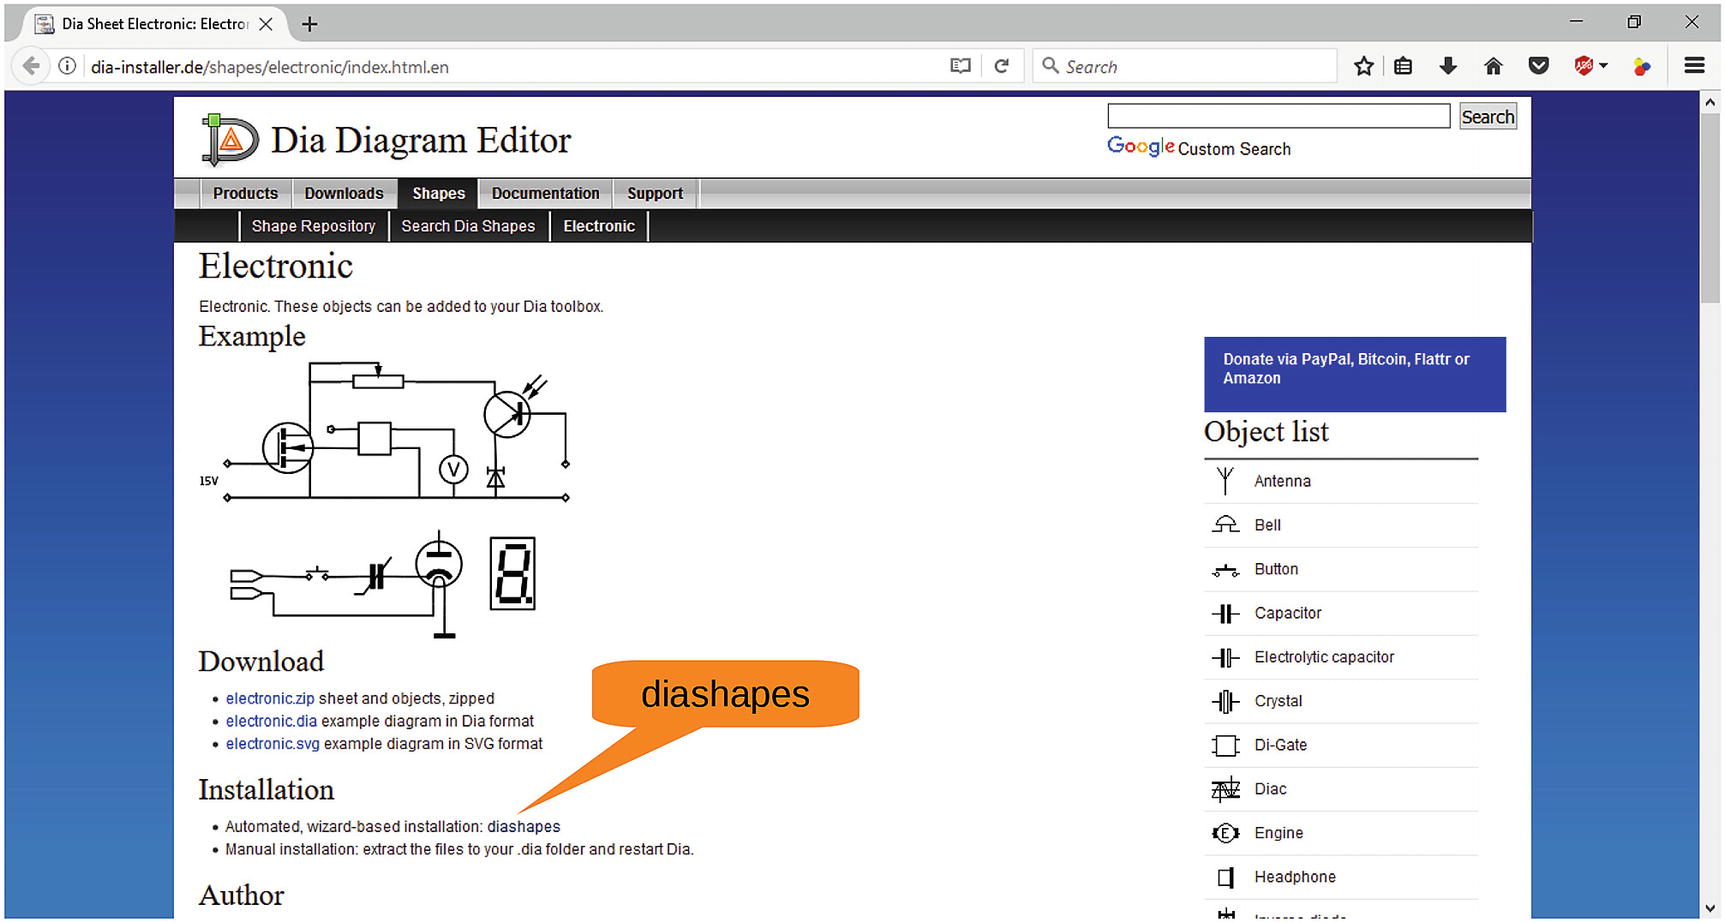
Figure 10-15 Electronical sheet add-on
Scrolling down, you can see that, yes, there is a bell symbol on this sheet. Looking at the text you see that there is a helper program called diashapes that will do the downloading and installation for you.
Let’s click that link and then download and install the software.
When run, diashapes displays a list of all the available shape sheets and asks you if you want to download them, as shown in Figure 10-16.
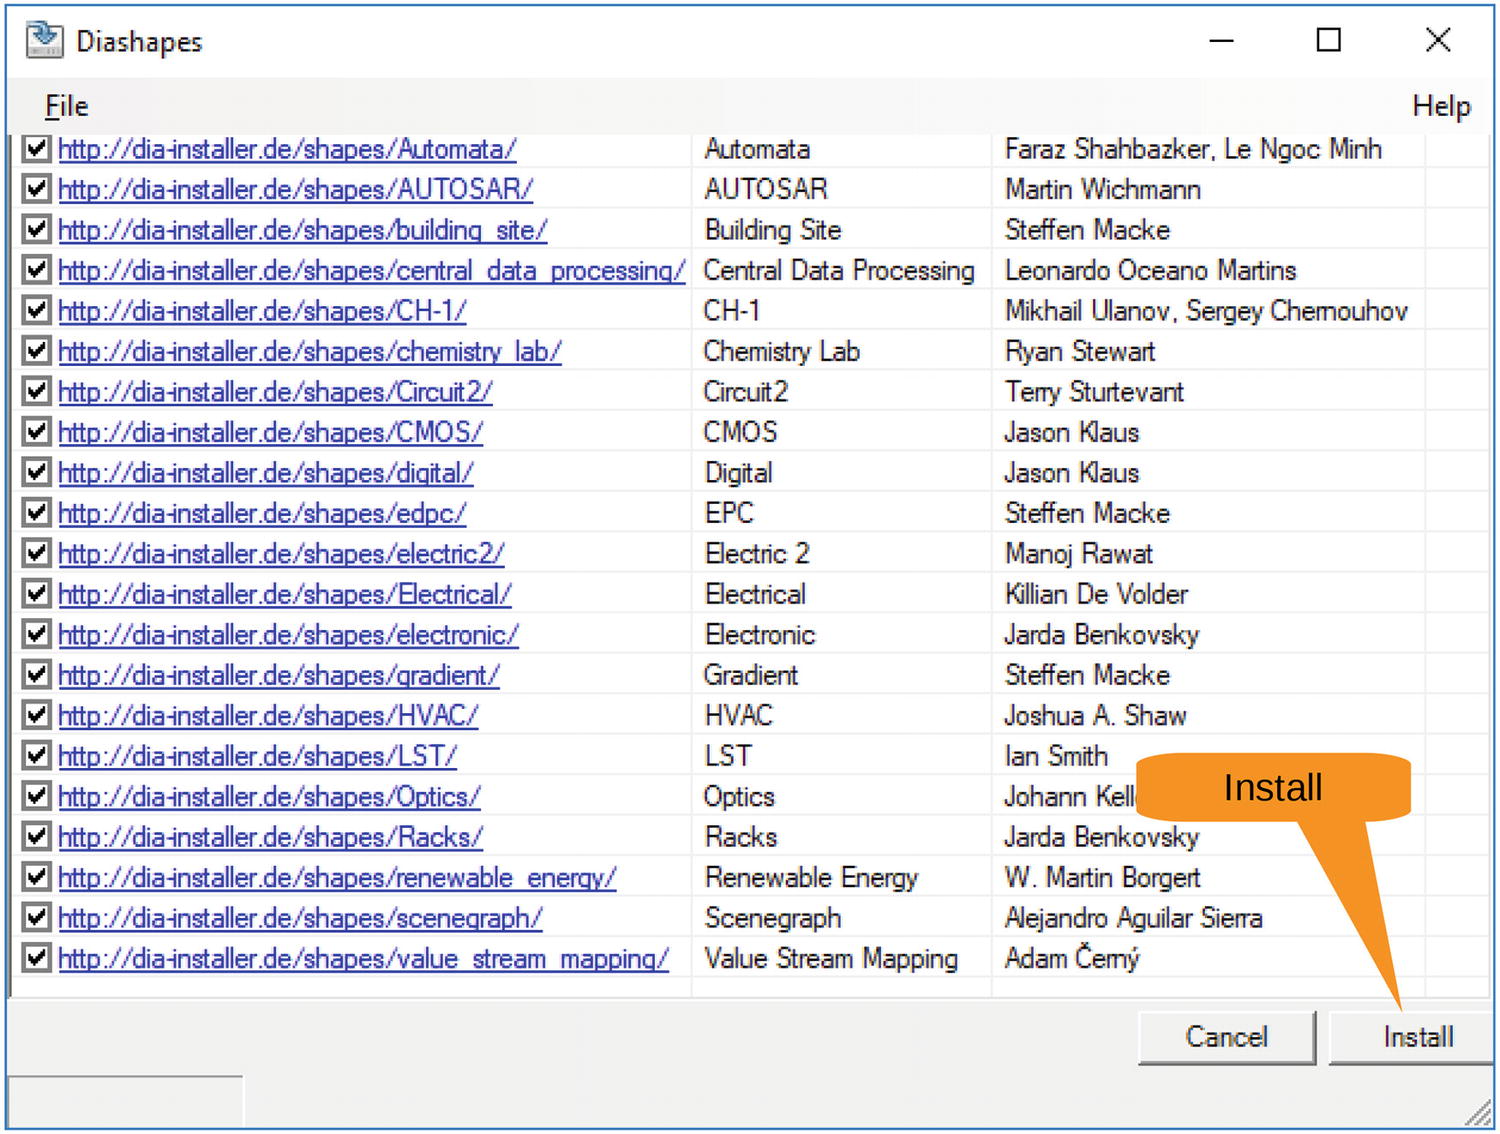
Figure 10-16 Diashapes
Since you have lots of disk space and there aren’t that many shape sheets, you’ll leave them all selected and click Install. When done, the program shows you a dialog telling you it installed 21 new sheets, as shown in Figure 10-17. Your number may vary because there may be more added after the time this book was written.
Figure 10-17 Sheets installed
You have to exit and restart Dia to see the new sheets.
Once you restart, from the sheet selector, select Other Sheets ➤ Electronics. Figure 10-18 shows you that you now have a bell.
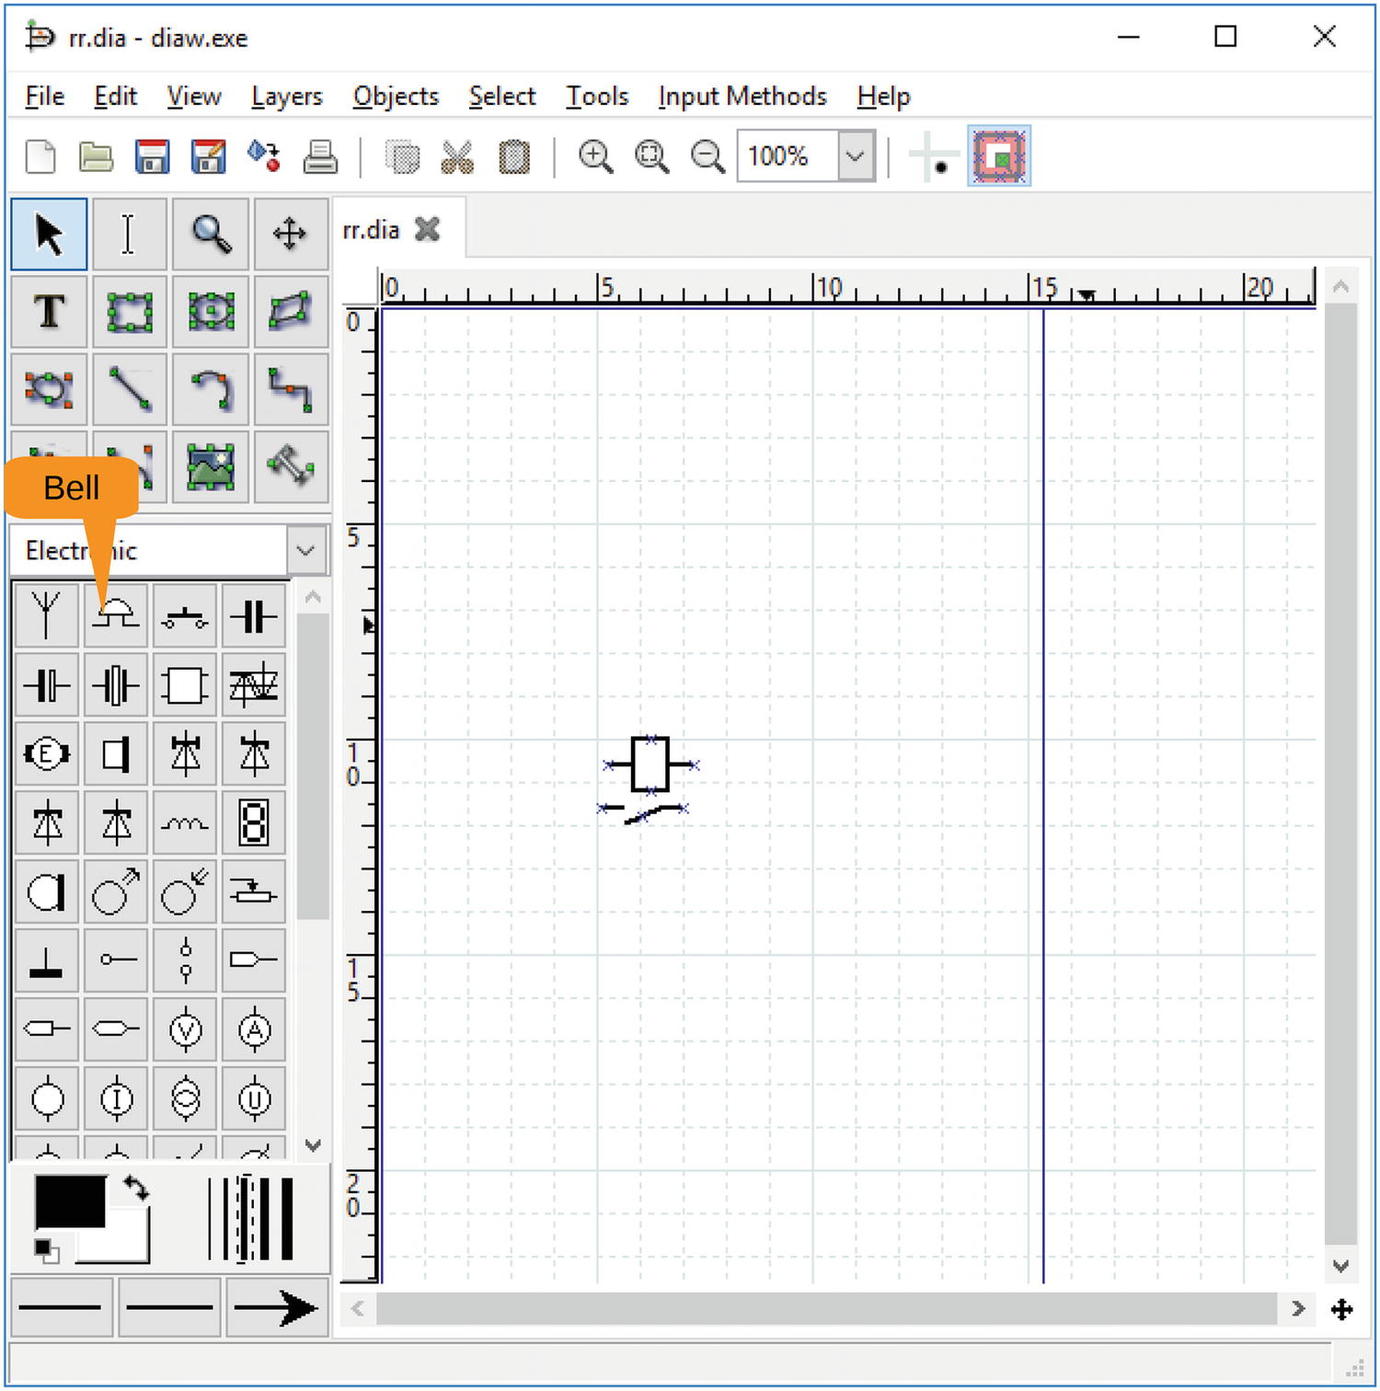
Figure 10-18 Bell
Let’s drag in the bell and a connecting line. From the result in Figure 10-19, you can see that you have a problem. The line has an arrow on it.
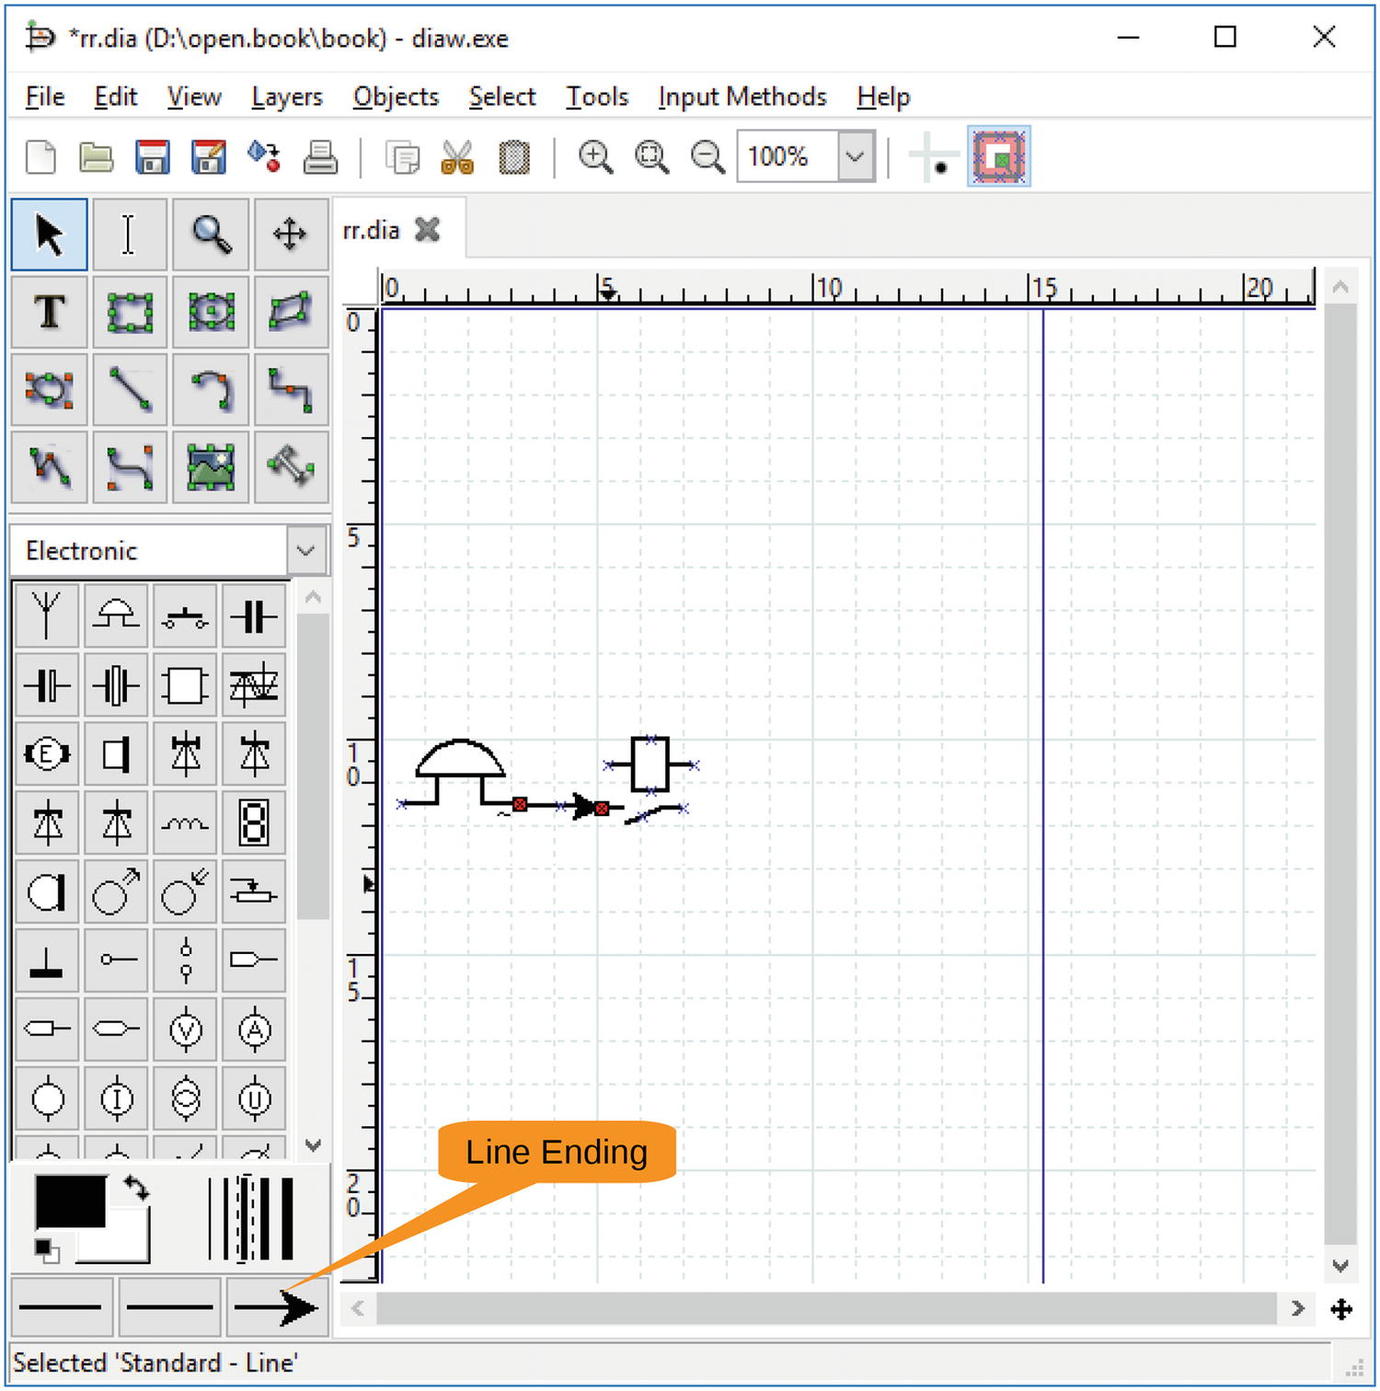
Figure 10-19 Bell with arrow
Right-click the line to bring up the context menu and select Properties, as shown in Figure 10-20.
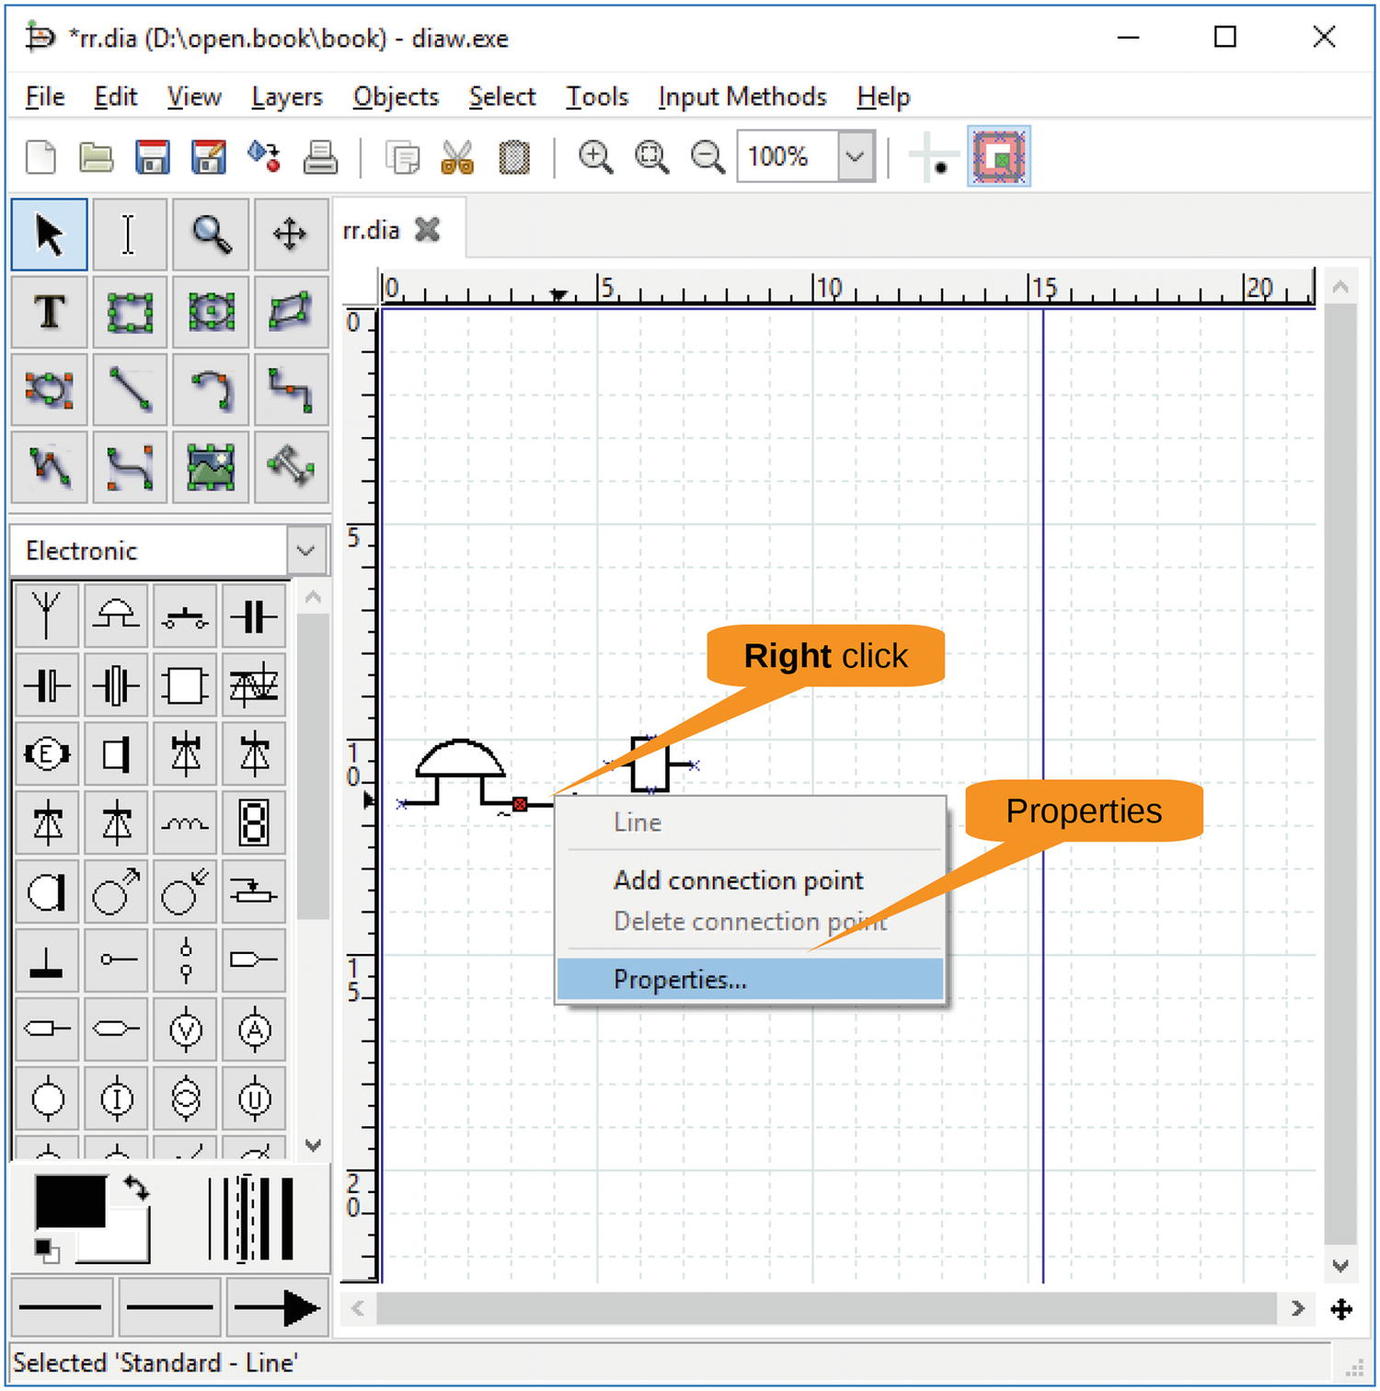
Figure 10-20 Properties
The Properties dialog appears. Change the line ending from an arrow to a line and click OK. Figure 10-21 maps out the controls.
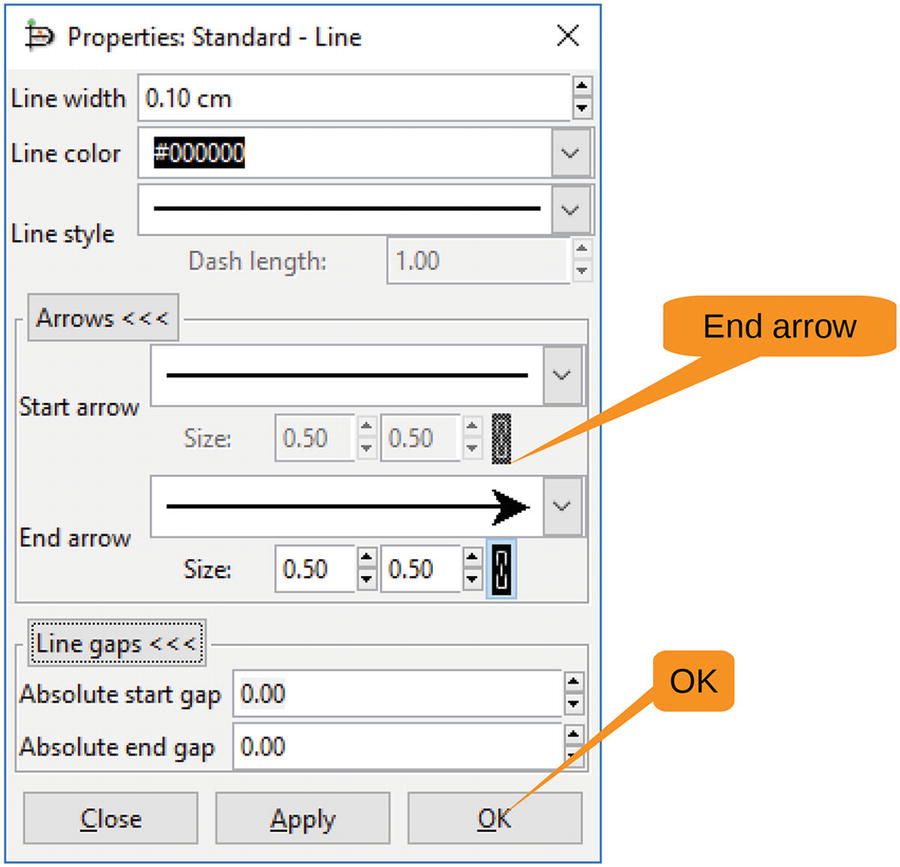
Figure 10-21 Properties
This takes care of this line, but what about the next one you draw? Let’s go to the default line properties on the bottom of the toolbox and change the right line ending to “no arrow,” as shown in Figure 10-22.
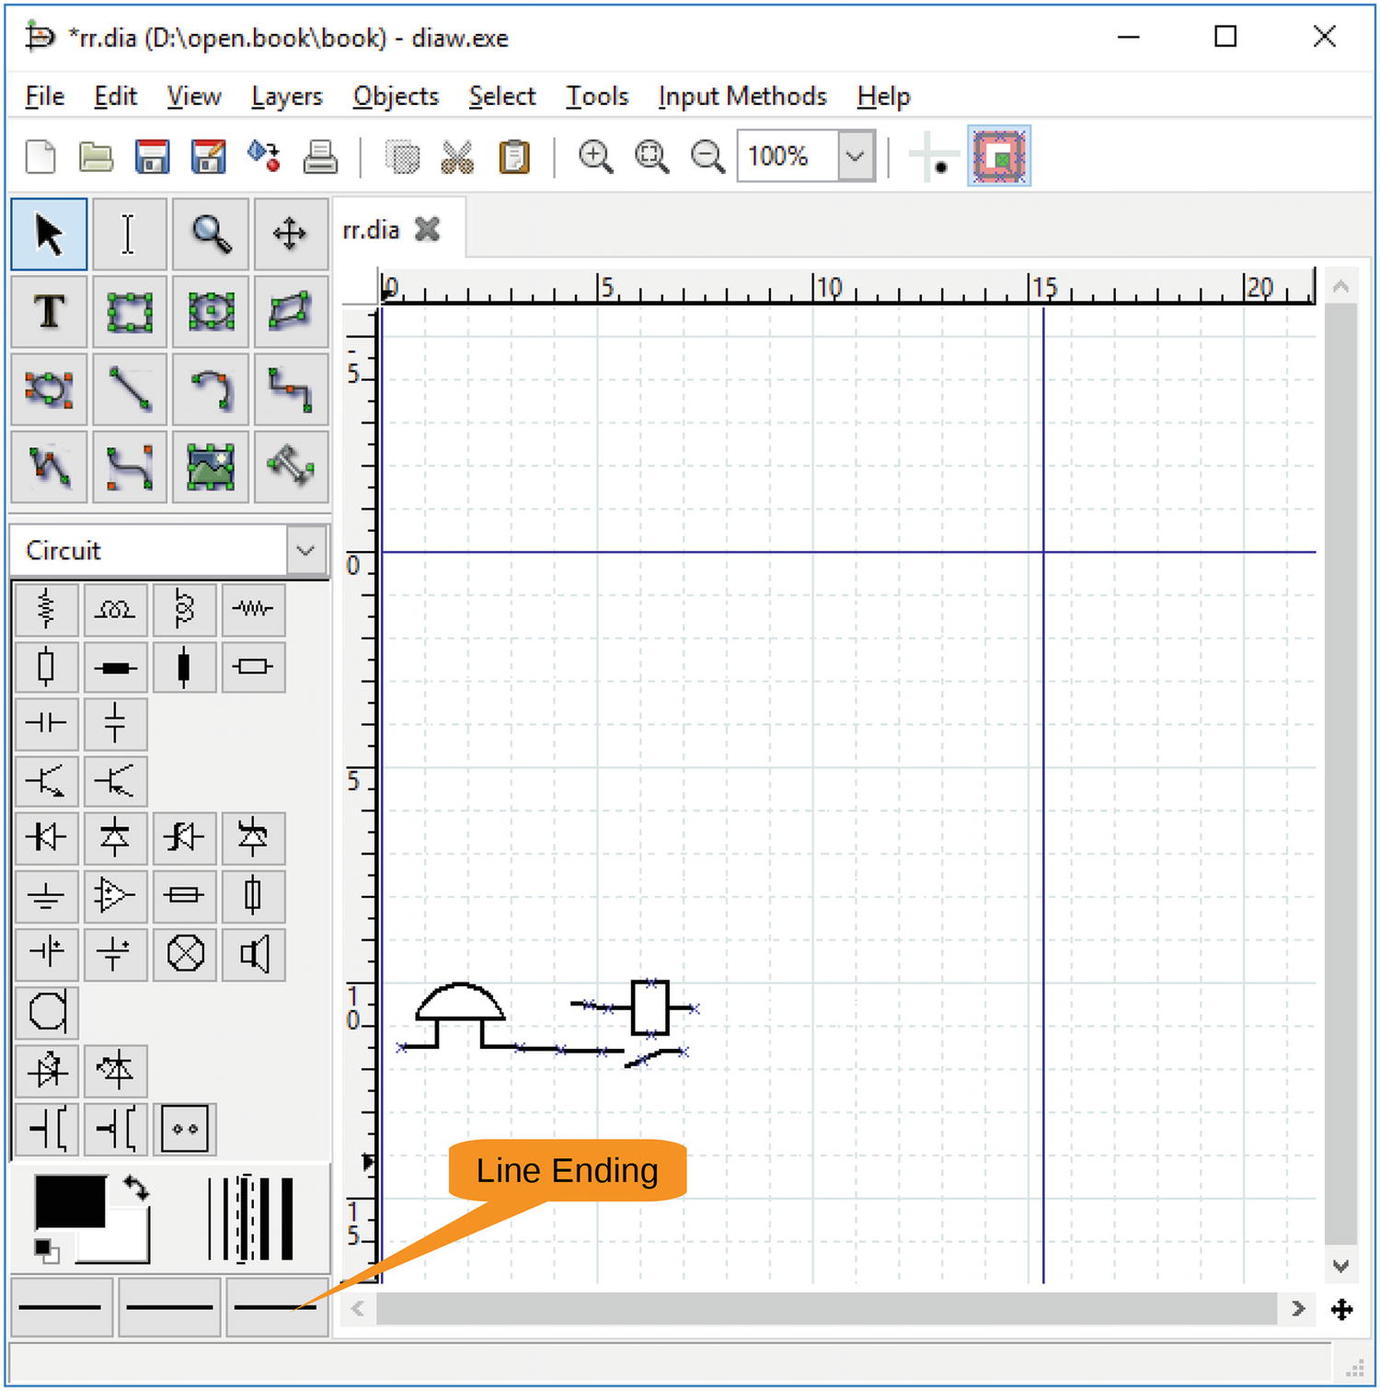
Figure 10-22 Line ending
Now let’s draw the rest of the diagram using the tools and techniques you’ve seen so far. The only tricky part is when you want to add a resistor. That’s in the Circuit symbol sheet. As a final step, you want to put a box around the relay. Draw it in, and you’ll see you get the unpleasant result shown in Figure 10-23.
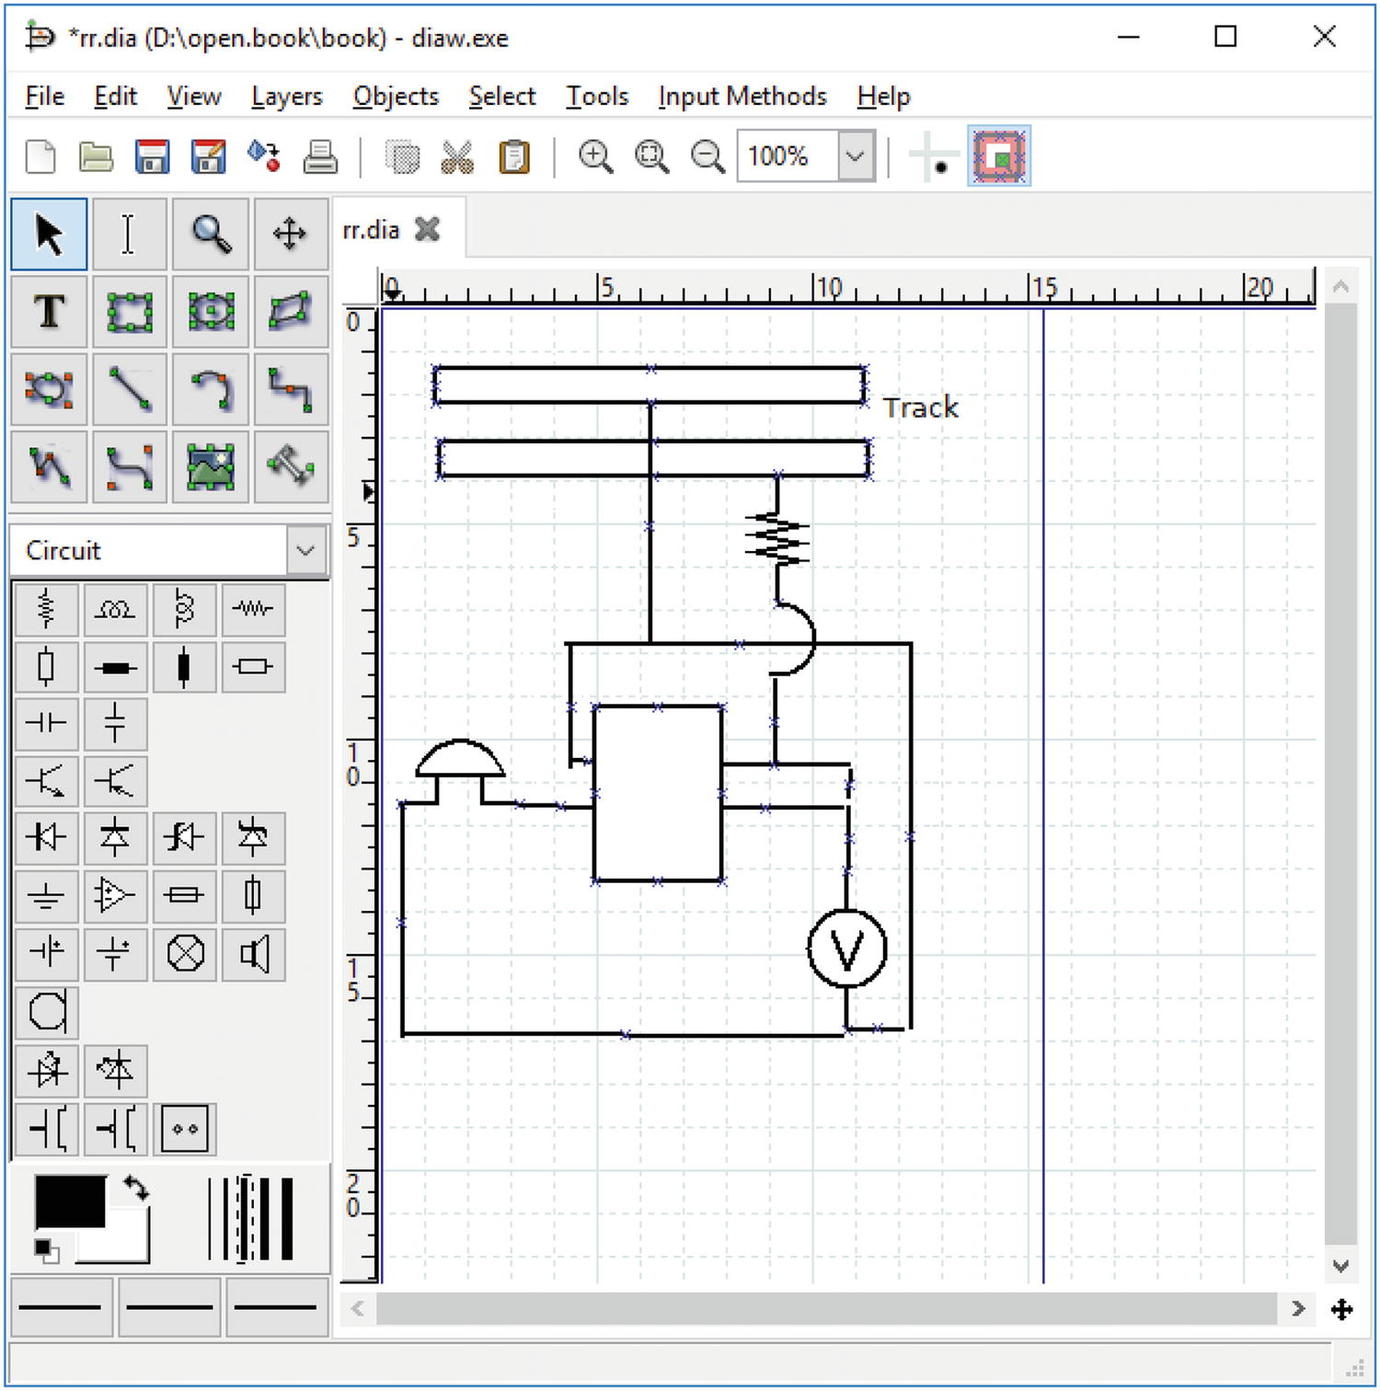
Figure 10-23 Box
You need to make it transparent. Also, you need the line to be dotted. So, by righting-clicking the box, you can go to the Properties dialog, as shown in Figure 10-24.
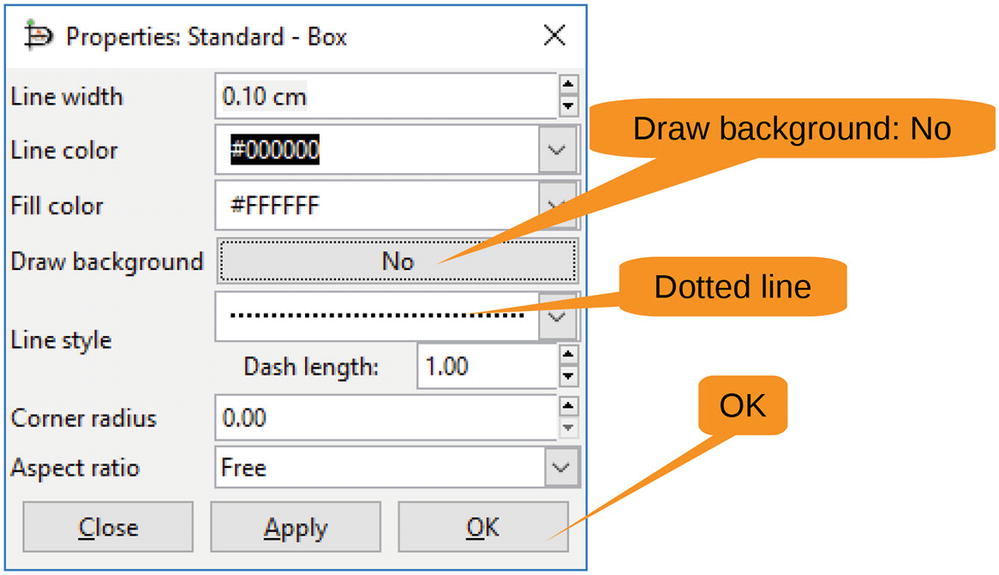
Figure 10-24 Properties
Now the box looks wonderful. Let’s add a few labels to be even more helpful. Figure 10-25 shows the grand result.
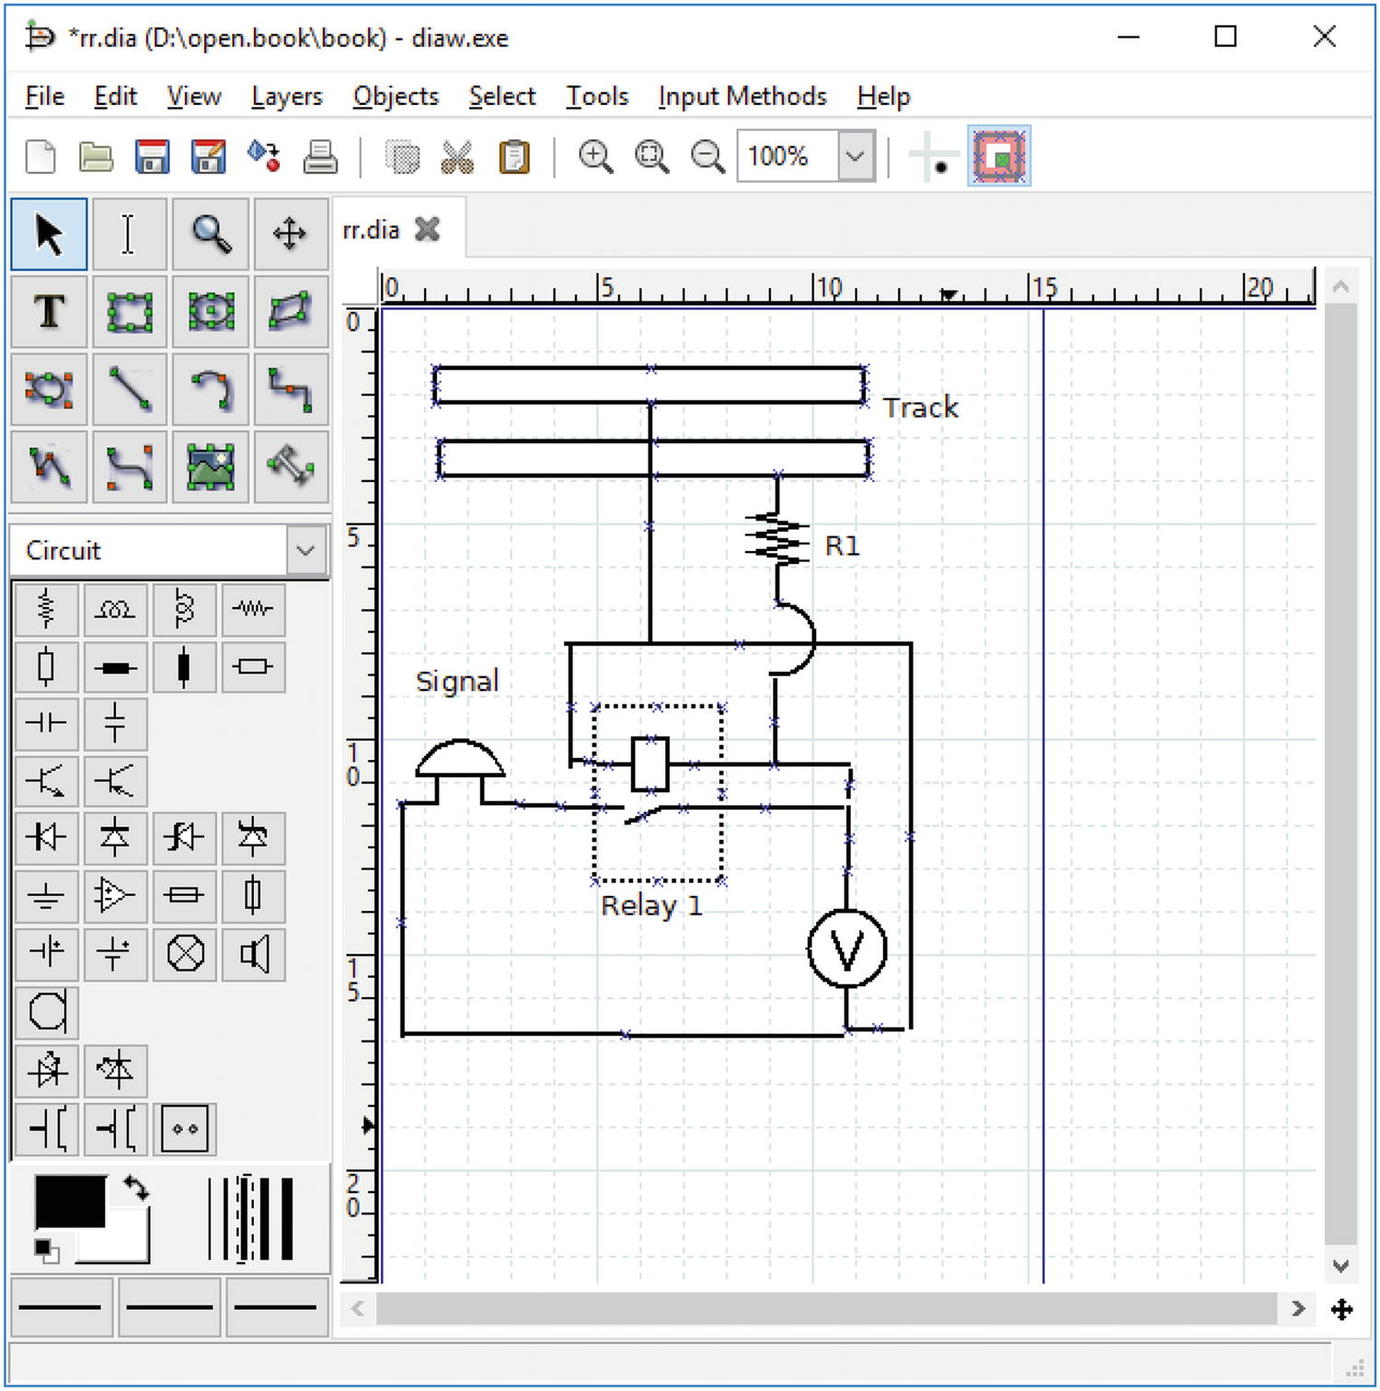
Figure 10-25 Final diagram
Congratulations, the result is a decent-looking diagram.
Summary
Dia comes with hundreds of shapes to support all sorts of diagrams, such as the following:
UML diagrams for program design
Computer network layouts
Family trees
Chemistry diagrams
Civil engineering diagrams
Organization charts
Although a simple tool, Dia can be used to take complex information and present it in a nice diagram that should make things easier to understand.