
Browsers and Add-ons
Use the following tools and browser add-ons to help identify class names and any issues with the performance or display of the SharePoint 2010 site.
Internet Explorer Developer Toolbar
This toolbar is a free tool that is built into Internet Explorer 8 and 9. You can also download and install it for workstations using Internet Explorer 7. To display the IE Developer Toolbar, simply press F12 on your keyboard at any time, or on the menu bar click on Tools ![]() F12 Developer Tools. The first time you display the toolbar it might be unpinned from the browser window, but you can dock it to the bottom of your browser window by pressing Ctrl+P when the window is selected. A Pin icon is located under the (X) Close icon to pin it to the parent browser window as well. Figure 9-9 shows that you can click on the white arrow on the left, and then select any element on the site to show the code for that element in the DOM explorer window. In cases where content is rendered through AJAX or renders after the page has loaded, you may need to click the Refresh icon.
F12 Developer Tools. The first time you display the toolbar it might be unpinned from the browser window, but you can dock it to the bottom of your browser window by pressing Ctrl+P when the window is selected. A Pin icon is located under the (X) Close icon to pin it to the parent browser window as well. Figure 9-9 shows that you can click on the white arrow on the left, and then select any element on the site to show the code for that element in the DOM explorer window. In cases where content is rendered through AJAX or renders after the page has loaded, you may need to click the Refresh icon.
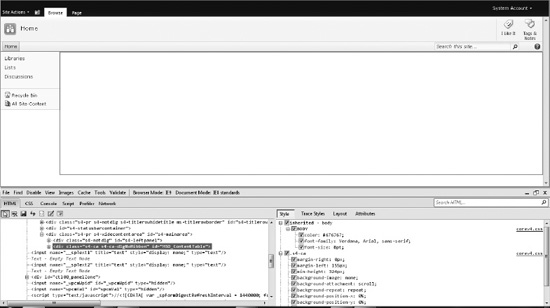
Figure 9-9. IE Developer Toolbar
Other tools within the IE Developer Toolbar allow you to do the following:
- Disable: From this menu you can disable the pop-up blocker and disable CSS from displaying on the page.
- View: From this menu you can view elements on the page such as class and ID information, link paths, link report, and page source.
- Images: From this menu you are able to disable images on the page, view image dimensions, file size, paths, and a full detailed report for every image on the page.
- Cache: From this menu you can specify to only get the latest files from the server, and clear browser and cookies.
- Tools: This menu allows you to resize the browser window in case you want to see how the site looks at different window sizes. There are preset sizes based on common resolution settings. You can also choose a different user agent such as IE6, Firefox, or Opera. The tools tab allows you to use a ruler and a color picker.
- Validate: From this menu you can check the HTML, CSS, links, and other accessibility options with the W3C validator site.
- Browser Mode: This menu will allow you to choose which browser you want the site to render with.
- Document Mode: This menu will allow you to choose between the types of IE document modes that the site will display with. By default, SharePoint 2010 uses IE8.
You can use the IE Developer Toolbar to find a CSS class or update an existing class style property without having to modify your custom CSS file. This helps you make quick changes in your own browser without affecting other users.
Firefox Firebug
Firebug is very similar to the IE Developer Toolbar, as shown in Figure 9-10. It can be downloaded from the following link: http://getfirebug.com/.
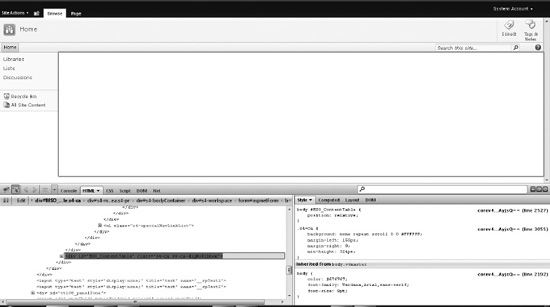
Figure 9-10. Firefox Firebug
Firebug includes a feature that lets you see search results for elements as you type. (This isn't available in the IE Developer Toolbar.) This allows you to easily see the results without having to hit the Submit button. It also changes to red if there are no results for what you have typed. You also have the ability to select the CSS on the right and copy and paste entire CSS snippets within Firebug. However, the CSS viewer is harder to understand, so I usually end up using the IE Developer Toolbar over Firebug when dealing with CSS issues.
There are add-ons for Firebug that take you even further, some of which are shown in Figure 9-11.

HttpWatch
This application is very helpful when you need to view what elements are loading within your site and how long it takes to fully render the page. Download this add-on from the following URL: http://www.httpwatch.com/download/. See Figure 9-12 for an example of what the results would be when using it against a blank SharePoint site.
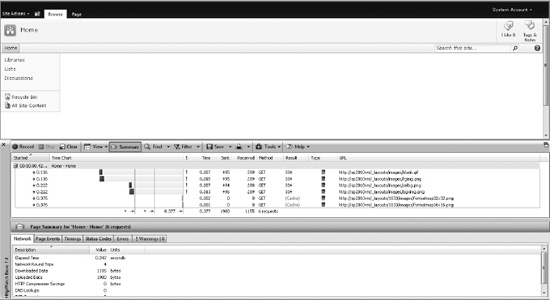
Simply by pressing the Record button and then refreshing the page, you get a time chart indicating how long it took the site to load and which items took the longest to load. For example, if I had a very large image on the page, as shown in Figure 9-13, it would capture that the image took the longest to load.

Figure 9-13. HttpWatch showing the length of time to load a large image
This tool can also be helpful for identifying if any JavaScript or other external files take long to load. The next section lists some additional resources that help with branding and customizing SharePoint 2010.