
![]()
Agile Project Management With TFS
In this chapter we complete a startup of an agile project using TFS. Many of the concepts covered in Chapter 6 are exemplified in this chapter so you can see how we move from planning to implementation. We also look at how TFS can support the agile project management process during sprints.
In this chapter and throughout the rest of the book, we will use a fictitious company in our examples. This way we try to have a red thread1 in the things we present so we can more easily understand the process and how TFS supports our development organization.
This chapter focuses on the project management parts of a project. All support for agile development practices such as continuous integration, test driven development, test automation, and so on will be explained in subsequent chapters.
The main part of this chapter is written from the perspective of the PO, whom we will meet shortly. There will be a personal touch on some parts. The reason for this is that this part of a project focuses so much on collaboration and interaction between people. If you recall, the agile manifesto talks about the left side of the four pillars:
- Individuals and interactions over processes and tools
- Working software over comprehensive documentation
- Customer collaboration over contract negotiation
- Responding to change over following a plan
Case Study
Let’s start with the company we will use as an example. Any similarities to real companies are totally unintentional.
Company Background
Our company is called Kangreen and is located mainly in Sweden, where the headquarters are. The company is about three years old and hence relatively new on the market. Alice Miller, the CEO, got tired of her career as a psychologist and decided to open another business with a friend, Bob Peak.
Kangreen develops software for psychologists and has had a great start. Customers are located all over the world, and sales people travel widely to sell products. The sales organization consists of 12 persons but is growing as demand of the software increases.
Kangreen has about 60 employees worldwide. The development organization consists of approximately 30 people. Of these, 20 are located in Gothenburg, Sweden, and the rest in Seattle, Washington. All development is currently done using Visual Studio 2010, but the company is planning to start using Visual Studio 2012 for all new development. Kangreen uses TFS 2010 today, but mostly for version control. Figure 8-1 shows the high-level organizational chart of Kangreen.

Figure 8-1. Overview of the Kangreen organization
There is a demand for Mac software on the market as well, so Kangreen is setting up a small Java development organization that will use Eclipse as the main platform for development. Recruitment is ongoing.
The great start and ever-increasing demand for Kangreen software hasn’t been without trials. For the development organization the need of a good ALM process is evident. There have been several cases where bug fixes have caused new bugs in the software that have not been found until the bug fixes were rolled out to customers. This lack of traceability could damage customer satisfaction and must be fixed quickly.
Another issue that has been troublesome is the collaboration between the team in Seattle and the team in Stockholm. There is a need for sharing code between these two parts of the organization, and they also need to have updated status reports on the progress in the different projects.
Kangreen development manager, Cindy Crafoord, has decided to implement a pilot project using the ALM features of TFS 2012 to bridge the gap between what they have today and what they can benefit from in TFS 2012. If the pilot is successful, Kangreen will migrate all their development to the TFS platform.
Cindy and Bob Peak have decided to use Scrum as the preferred project management method, and the developers agree on using XP practices to enhance quality of the software and therefore increase business value to the company.
The project Kangreen has decided to use as a pilot for the ALM implementation is an expense reporting application (Kangreen Expense Reporting). In the early days, expenses were handled easily by the admin staff, but since the company has grown quickly and sales persons are located and travelling all over the world, things have been a little more complicated. The admin staff wants an application that will make their jobs easier and at the same time make sure employees will get reimbursement for expenses quickly. The requirements for this application are covered in the section “Requirements” later in this chapter.
Because this project will be using Scrum as a project management process, Cindy and Bob have appointed Fiona Gallos as Product Owner for the application. Fiona is new in the company and has only been working with Kangreen for six months. She is experienced as a Product Owner because her previous employer used Scrum extensively.
Important stakeholders for the project are Bob Peak, Cindy Crafoord, and Karen Guckenheimer. Karen is manager for the admin department and will represent the end-users as well as the admin organization. Because the project aims to be a pilot for an ALM implementation, Dave Applemust from the infrastructure side and Harry Bryan from the development organization are also considered important stakeholders.
The People
- Alice Miller, CEO
- Bob Peak, IT manager
- Cindy Crafoord, Development manager
- Karen Guckenheimer, admin manager
- Dave Applemust, infrastructure specialist
- Eric Parrot, Business analyst
- Fiona Gallos, Product owner
- Guillio Peters, Scrum master
- Harry Bryan, Senior developer
- Mikael Persbrandt, developer
- Petter Ivarsson, User Experience, UX
Scrum TFS Template
Before we follow Fiona as she begins this project, we want to have a look at the Scrum TFS Template. This template is supplied out-of-the-box by Microsoft and is a good implementation of Scrum. For all examples in this book we will use this template for our sample project (Kangreen Expense Reporting).
Work Items
There are five work item types in the Scrum template (see Figure 8-2).

Figure 8-2. The five work item types in the Scrum template
- Bug. Self-explanatory perhaps, but this is used to report bugs.
- Impediment. Based on the outcome of the daily Scrum, we may have one or more impediments blocking the team or a team member. This work item type is used for the impediments.
- Product Backlog Item (PBI). All requirements should be in a user story format and this work item type is used to document them.
- Task. This could be anything that needs to be done. If we use PBIs for user stories we could use tasks for all detailed work that needs to be done to solve the user story based on the outcome of the sprint planning meeting.
- Test Case. Just what it sounds like. Use these for documenting your test cases.
A team portal is created for all new TFS projects (see Figure 8-3). This is a customizable SharePoint portal that provides a useful overview of the project status.

Figure 8-3. The TFS project portal
We can also use TFS web access (see Figure 8-4) if we want to let nontechnical users add bugs or new PBIs. From this we can view reports, create new work items, view builds, and much more. Often the PO or scrum master prefers to use the portal so that they don’t have to use Visual Studio to access these features. If we have a PO or SM who prefers a Mac, web access is the best way to access the power of TFS.
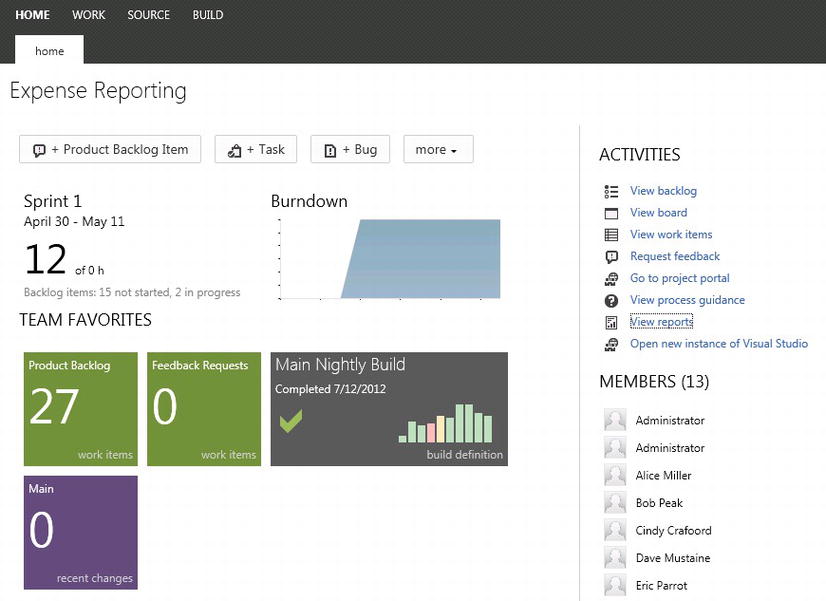
Figure 8-4. TFS web access
We can set access control for the web access in Settings for the project. We can use the web access if we want to let nontechnical users add bugs or new PBIs. By controlling the access to the portal we can let certain users or groups of users only see (and do) what we want them to see. This way we can let customers (if we are consultants) into TFS with limited functionality. The portal is great for different kinds of collaboration.
There are numerous out-of-the-box reports with the templates in TFS. Chapter 9 covers this in more detail. Let’s just say that the Burndown chart (see Figure 8-5) is maybe the most common report that we use. The Burndown shows how many hours are still left in the sprint and is useful to see whether we are on track.
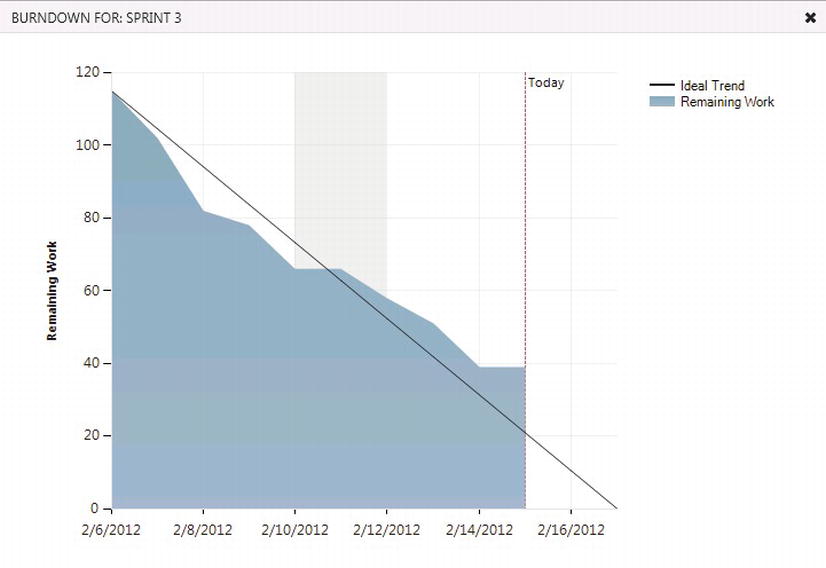
Figure 8-5. The Burndown chart
There are also queries we can use to retrieve information from TFS: One query that is always supplied in the scrum template is the “Assigned to me” query (see Figure 8-6) that shows all work items assigned to me.

Figure 8-6. The Assigned to me query in TFS
Using query language (see Figure 8-7) we can modify or write new queries that suit us better.
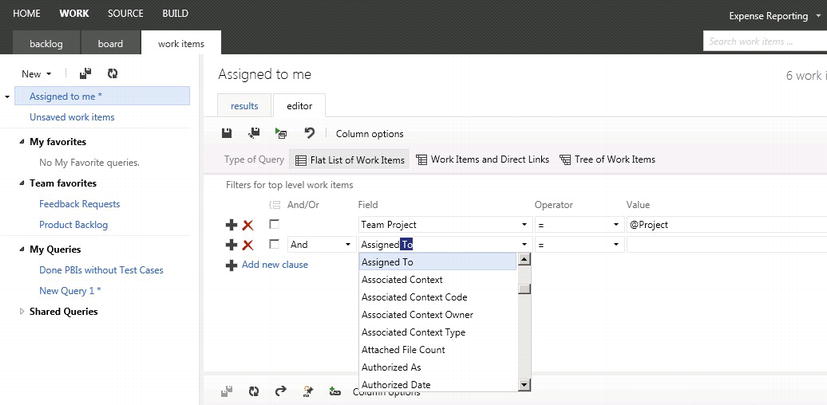
Figure 8-7. Modifying the Assigned to me query in TFS
Another nice addition to TFS is the possibility to have an electronic board showing the state of the work items on the sprint backlog (see Figure 8-8). Here we can see what is done, what is in progress, and so on, instead of using yellow stickers on a wall. Having a big screen on the wall that shows progress gives all team members up-to-date information, not to mention the PO when he or she visits the team room.

Figure 8-8. The task board showing sprint backlog items and their status in TFS
This section follows the product owner, Fiona Gallos, during the startup phase of the project. We will see how TFS is used to insert the information that Fiona collects during this phase.
PO Sets Off to Work
The idea for this project started when Kangreen noticed that bug fixes created new bugs and that the new bugs sometimes appeared in parts of the system considered not to be affected by the original bug fix. Kangreen soon realized that they lacked traceability and had no way of knowing where a bug fix would have its impact besides the actual code change.
Fiona had just attended a conference and learned a great deal about ALM and TFS. She came up with the idea to get a better grip on the ALM process and at the same time start using agile practices at Kangreen. Both these efforts would greatly improve things at Kangreen so they could avoid embarrassing situations such as when customers find new bugs caused by bug fixes.
At the same time, Fiona saw that collaboration between the two developer teams could improve if they started to use TFS. Fiona wrote down a business case and presented it to the management team. After a few discussions they agreed to try this on a pilot. Because the Expense report project was in the pipeline they decided to use it for the pilot.
At this point it was hard to calculate ROI, but anything that could improve how the customers looked upon them would be worth going for.
It is recommended that the PO starts with a small team during initial planning of the project. Fiona selected Cindy Crafoord, Harry Bryan, and Eric Parrot as they were experienced within the company and are also senior persons with experience from other companies as well. They are also available for the whole pilot project, which was an important aspect for Fiona. She knew the importance of having consistency among the team members during a project. Guillio Peters was going to be scrum master for the entire project, but he would join a week later because he was finishing another project at the moment. The rest of the team was going to be selected a bit later in the project. Fiona liked to start with a small team.
Fiona created the project in TFS (see Figure 8-9) from the web portal using the Scrum template. She named it Kangreen Pilot.
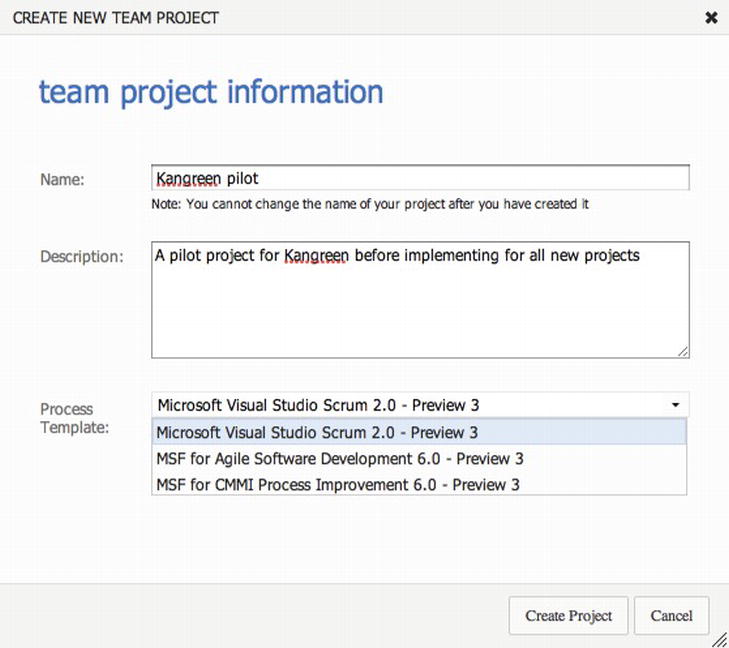
Figure 8-9. Creating the Kangreen pilot project in TFS
Then she started to add the users to the project (see Figure 8-10).
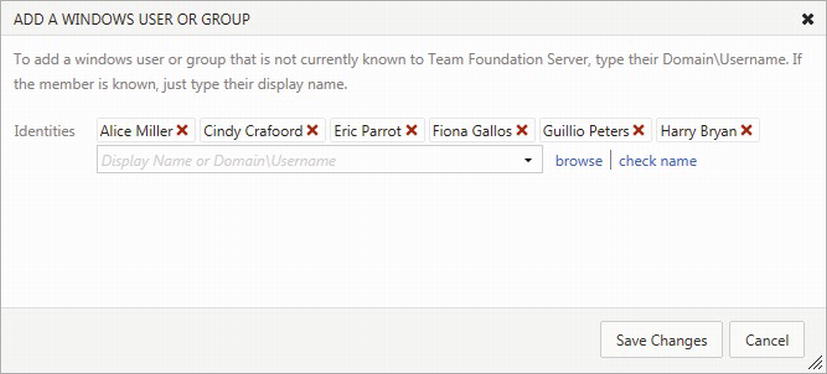
Figure 8-10. Adding users to the project
After adding the users and creating the TFS project, Fiona was ready to go. She had what was necessary to start requirements gathering.
Requirements
Requirements gathering was a fun part in Fiona’s eyes. Discussions with traditional project managers and stakeholders about requirements always came up and she enjoyed that. Traditionally all requirements had to be found at the beginning of the project and it was hard for many persons to accept that it is okay to start a project even without specifying everything. The fact that so many of these requirements were wrong or unnecessary in the end didn’t seem to bother traditionalists. They still went head first into projects that often failed or were flawed.
Fiona had run so many successful agile projects she knew that catching higher-level requirements in the beginning was okay. They could start without all details because they would be clarified at each sprint planning meeting and also during the sprints.
Fiona called the initial team for a requirements workshop. She also added Karen Guckenheimer to the workshop because she was one of the main stakeholders from the business side. Because Guillio (SM) was not present, Fiona explained what they were going to do. She stressed that they should look for higher-level requirements in the sense that they did not have to detail them yet. There was going to be no discussions about solutions or technicalities at this point. That was left for the development team to decide when the sprints started.
To avoid any confusion, she then explained the concept of a user story for the requirements team. Fiona wanted all requirements in this form:
- As a < type of user>, I want < some goal > so that < some reason>
Fiona had calculated three hours for this meeting, and booked a room with a large whiteboard. She also supplied Post-it notes and pens for everyone.
They started by brainstorming user stories and things were a bit slow to begin with. The meeting took off when Harry Bryan came up with two user stories:
- As a sales person I want to manage expense reports over the Internet so I can be more efficient.
- As a manager I want to search expense reports so I can easier get an overview of expenses.
Then suddenly they all started writing. After little over an hour the pace dropped again. They then spent another hour going over the user stories they had and any clarity with any of them was discussed. Fiona felt they had done a great job so far, and had a good foundation for the work ahead of them.
Building the Backlog and Prioritizing It
After the meeting, Fiona went to her desk and wrote down in a spreadsheet what they had come up with. She liked to use Excel, partly because she liked the tool and partly because she knew she could import the user stories into TFS if she wanted.
Fiona then started to order the list. She made an initial prioritization based on some assumptions:
- Initially they cannot know the actual cost of a work item
- All work items cost the same to develop
- Prioritization will be based on importance only
- After initial sprint planning and estimation Fiona will update the list again
It took Fiona roughly 30 minutes to complete the initial sorting. Now she really had something to start with. It was still early afternoon and she wanted to add the user stories to TFS before going home for the day.
Fiona opened the TFS project portal in Safari (see Figure 8-11) and felt a little bit of excitement as she saw the empty project that soon was going to be filled with activities. She had lots of input for the backlog.

Figure 8-11. The project portal
She took a long look at the spreadsheet she had in front of her and started by going to the Work Items tab on the web page (see Figure 8-12). She could also have gone to the Backlog tab, which has a quick-add feature for adding work items (see Figure 8-13) that you can turn on or off.
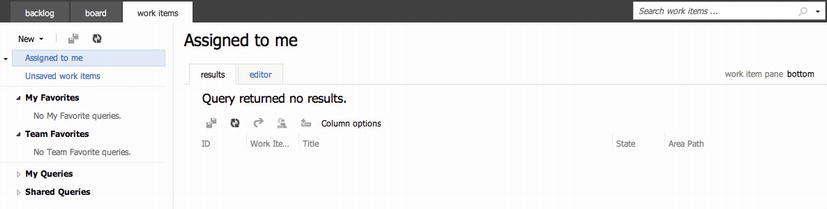
Figure 8-12. The Work Items tab
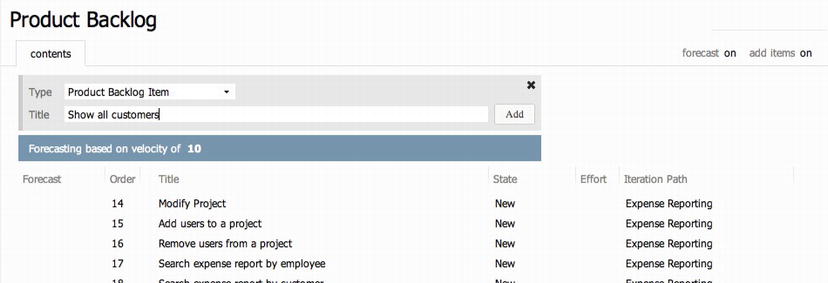
Figure 8-13. Adding a PBI from the Backlog tab using the quick-add feature
From the drop-down menu on the left she selected New, Product Backlog Item (see Figure 8-14).

Figure 8-14. The Work Items tab
This opened the form as seen in Figure 8-15. If Fiona had created a backlog item from the Backlog tab using the quick-add feature, the new backlog item would have ended up at the top of the backlog. Fiona would have had to click on it and then she would have had the work item form seen in Figure 8-15.
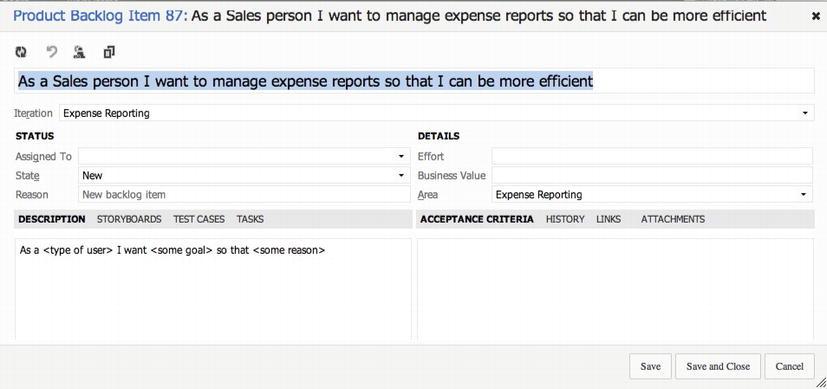
Figure 8-15. The first PBI
She took the first PBI on her backlog and started filling in the fields. She left a lot as it was for now and only filled in the PBI name and description. For example, she needed a rough initial estimation before she could fill in Effort. She also wanted to wait until they had a clear Definition of Done ready and a risk assessment done before filling out things such as Acceptance Criteria and Test Cases.
Fiona then continued with the rest of the higher-level use cases until they were all in TFS.
Definition of Done
Before going home that day Fiona called a new meeting about the Definition of Done (DoD) with the team. She included infrastructure specialist Dave Applemust for this meeting as there are constraints from the infrastructure team when building and deploying new projects.
She wanted to discuss the DoD so that all had a common view on this before starting the actual coding. Many times she had seen the problems not having a DoD could cause in projects and she knew from experience this was important.
Two days later they met for the DoD meeting. Fiona explained the importance of this concept and spoke about issues she had experienced when not using a DoD. There were nods of recognition among the participants as she spoke.
She then let all participants write down the things they wanted to have on a DoD. After some discussion they agreed on the following list for an approved user story:
- All code is written and checked in (including tests)
- Coding conventions fulfilled (these are documented in a separate document and not included here)
- All unit tests passed (must be okay before check-in)
- Code is refactored (improved/optimized without change of function)
- All code has been reviewed by at least two persons (peer-programming or peer-review)
- User story is included in the build (build scripts updated, all new modules included)
- The user story is installable (build scripts updated so that story is included in automatic install)
- All acceptance tests are passed
- Acceptance criteria must exist
- Acceptance tests are implemented (automatic or manual tests)
- Backlog is updated by:
- All tasks remaining time is 0
- User story state is “Done”
- “Actual Hours” is updated
- All tasks are “Done”
- User story is installed on Demoserver
- User story is reviewed by PO
- User story is approved by PO
- Product documentation is updated and checked-in
- User manual is written
- Administrative manual updated
- Administration manual
- Help texts written
The team also came up with the following DoD for when the Sprint is done:
- All user stories in the sprint fulfill the DoD
- Product is versioned (release management/rollback)
- All accepted bugs are corrected
- New bugs that have been identified are closed and/or parked
- 80% code coverage from automated tests is fulfilled
- All chores are done and approved
- All integration tests passed
- Sprint Retrospective performed and actions for improvements identified
- Sprint Review, with PO present has been performed
- Performance test of the complete system has been done
Estimation
After DoD they had what they needed to do some initial estimation of the work. Fiona needed to come up with a rough budget for the project to show the stakeholders and also an initial release plan. She decided to use poker planning for this. She had used it previously and was happy with the result. She called for a poker planning meeting with the initial team.
Again they met in the same conference room they had used before. Fiona had purchased planning poker decks from Mountain Goat Software (www.mountaingoatsoftware.com) for everybody. She started by explaining the rules for everybody and then they began:
- Fiona started by reading the first user story.
- After a short time participants each selected a card without showing it to the others.
- When Fiona asked them to show their cards, they turned them over.
- Cindy and Harry were the furthest apart and they both explained their thoughts on the user story and then the team played again.
- This time they were closer to each other’s points (only one step apart) and the higher value was selected for the story.
- They continued through the user stories until they were finished.
After they were done Fiona went to her desk and started to update the PBIs. She now inserted the story points for each PBI into the work items (see Figure 8-16) in the Effort field. During sprint planning these would be broken down into more manageable pieces and each task would get a time estimate instead of story points.
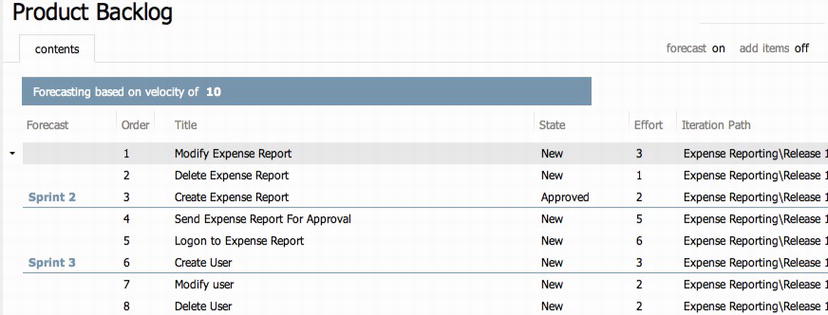
Figure 8-16. Updating the PBIs
So story points are done, but before continuing to sprint planning and time estimates Fiona wanted to do an initial risk assessment.
Risk assessment is part of all estimation in agile projects and should be done during the whole project. If any PBI could be considered as very risky, it might need to be prioritized higher on the backlog. It is always better to address high-risk items as early as possible to avoid surprises later. Fiona knew the surprises would come anyway.
There are different ways of performing risk assessments. We suggest you choose the one you are familiar with. Fiona chose to do a traditional risk assessment by using the following parameters:
- Severity (1-5)
- Probability (1-5)
- Risk
- Risk assessment score (severity x probability)
- Mitigations
- Probability after mitigation
- Risk assessment score after mitigation (severity x probability after mitigation)
For each user story on the backlog they went through this analysis. Fiona ended up with an Excel sheet looking like the following (see Figure 8-17).
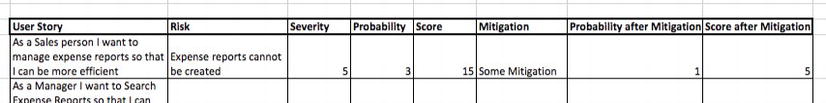
Figure 8-17. Risk mitigation
The team found no risks that were exceptional at the initial risk assessment, so Fiona left the backlog almost untouched. In Figure 8-18 we can see part of the backlog before going into sprint planning.
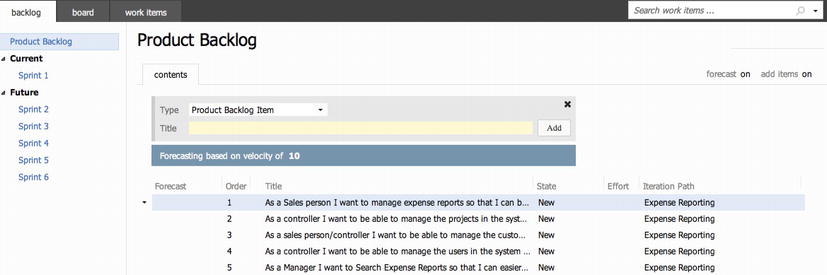
Figure 8-18. Part of the backlog for the Kangreen expense report application
Grooming the Backlog
All through the sprints the PO needs to groom the backlog. The PO does not do this work alone, so the team needs to be part of this as well. This is an excellent way to get the team’s views on the upcoming features and for them to give feedback and new ideas to the PO. Fiona decided to estimate about 10 percent of the team’s time for backlog grooming. This number had worked well in the past.
Building the Team
Now the team was close to getting started. Fiona had Cindy Crafoord, Harry Bryan, Eric Parrot and Guillio Peters in the team so far. She talked to the other team members and they decided they needed three more persons. They selected the following:
- Mikael Persbrandt, developer
- Ingrid Svensson, senior tester
- Petter Ivarsson, UX
Fiona then contacted each person’s manager and made sure they were available for the project. Luckily, they all were and when she approached the potential team members they were happy to come aboard.
Fiona was going to go for two-week sprints because that was a good time box based on her experience. Once she had a team that complained that they could not finish their PBIs during the four-week sprints they used. They always seemed to be late or not deliver everything they had committed to, complaining they needed more days in the sprints. She then said: “Okay, then we use two-week sprints instead.” The team was very confused, as Fiona had decreased the number of days in the sprints, not increased them. Once they started working on the two-week sprints however, they soon found they delivered more in two weeks than in four. The team was more focused and did not postpone anything until the end of the sprint, hence they were more effective.
Initial Velocity
Fiona needed a few more things before she would arrive at the time estimates for the project. She needed to know the initial velocity of the team. The velocity is nothing more than the speed of the team. How much work (user stories) can they take on in a given sprint? She also needed to know how many hours they actually have for work in the sprints.
As usual, Fiona used Excel to calculate the available time of the team. She followed the rules outlined in Chapter 6:
- How long is the sprint? In this case two weeks.
- How many working days are available in the sprint? Fiona would have 10 working days.
- How many days does each team member work during the sprint? Planned vacation or other days off, planned meetings, and so on. She looked at each team member’s schedule and filled out the spreadsheet.
- Fiona deducted the time for Sprint Planning, Review, and Retrospective meetings, which would be eight hours per person for this sprint.
- Excel calculated the result of this. What we get is the capacity before “drag.” Drag is wasted time or unknown activities.
- Because the team was new and Fiona had not worked much with any of them, she used a standard 25 percent as she knew this could be a good landmark. Included in this is 10 percent backlog grooming.
Now Fiona had the available number of hours in the sprint: 289.5 (see Figure 8-19).

Figure 8-19. The spreadsheet Fiona used for calculating available time in the project
You can use TFS for capacity planning as well. In the backlog section, in the current sprint, click the Capacity tab (see Figure 8-20). Here, you can set capacity, activities, and days out of office for vacations and holidays. As you set capacity, activity, and days off, graphical information about hours and capacity is automatically generated in the pane on the right (http://blogs.msdn.com/b/visualstudioalm/archive/2011/12/07/team-foundation-service-preview-get-started-with-agile-planning-tools.aspx).
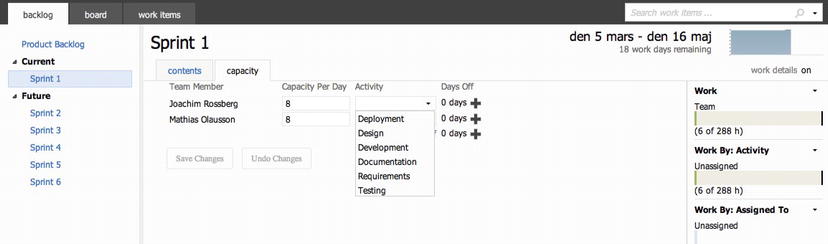
Figure 8-20. Entering capacity into TFS
Microsoft has introduced the concept of team in TFS 2012. We can create several teams if we want. So if we have a scrum project (or any other project of course) that needs to scale to more teams, we can create them and add the designated team members to each team. When calculating capacity we will get summaries for each member, team, and the project. This is a very useful feature, especially for the product owner.
In Figure 8-21 we can see that in the current sprint (Sprint 1) we have two tabs; one for contents and one for capacity. The capacity is shown also in the Contents tab in the far right and can be switched on or off.
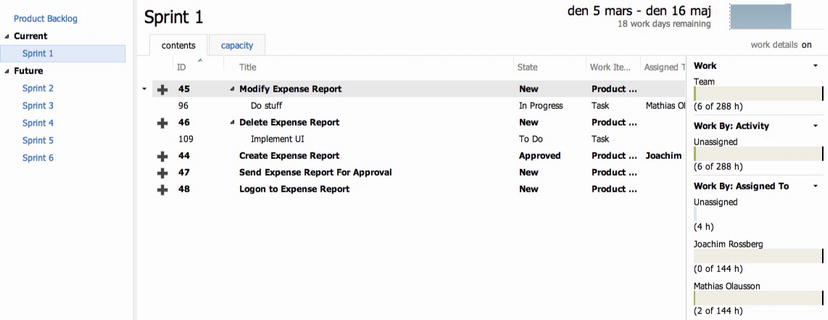
Figure 8-21. Entering capacity into TFS
The sprint planning features in TFS offers three different ways for the team to determine whether they have enough capacity: By person, by role (Activity), or at the whole team level. This is very useful information for the product owner.
To calculate the initial velocity of the team Fiona usually did an initial sprint planning. This was exactly the same as any sprint planning except that it was performed before the actual sprints started. Often this sprint planning was used in the first sprint because they would be very similar.
During this meeting, the team estimates the tasks in hours so that they can plan the sprint and decide on how many user stories they can take on in their sprint. This is the way the Kangreen team performed this:
- Estimate the first user story in detail
- Break down what the team needs to do to deliver the story
- Estimate hours for each activity and summarize
- Deduct the summary from the available time the team has in the sprint
- Is there still time left?
- Take a new user story and repeat the process until no available time is left
- Summarize the number of story points from the stories that were included in the sprint. Now we have a theoretical velocity.
The first (highest prioritized) user story on the backlog was
- “As a sales person I want to manage expense reports so that I can be more efficient.”
The number of story points for this had been five from the planning poker session. This was broken down into smaller pieces:
- Create Expense Report
- Delete Expense Report
- Modify Expense Report
- Send Expense Report For Approval
- Logon to Expense Report System
Together with the team, Fiona prioritized these so they had a beginning for the sprint backlog. The sprint backlog looked like this after prioritization:
- Create Expense Report
- Send Expense Report For Approval
- Modify Expense Report
- Delete Expense Report
- Logon To Expense Report System
For each of these they continued breaking them down into smaller pieces and estimated them in hours. For creating the Expense Report they came up with the following.
- Create GUI
- Create Business Logic
- Fulfill DoD Requirement
- Write User Manual
The estimated number of hours for this user story was 137. With an available time of 289.5 hours they still had 152.5 left in the sprint. This meant that they still had room for more work, so they continued with the next user story on the backlog. This was
- “As a controller I want to be able to manage the users in the system so that I have full control over the users”
and was worth 3 story points.
After breaking this down they had 95.5 hours left so they continued with another user story worth 2 story points. When this planning was done there remained 23.5 hours of available time but Fiona and the team chose to not take on anything more in the sprint. The team was new and if there were problems, they wanted some space. It’s better to finish the tasks than to reach the end of the sprint and not be able to finish some of them. If the team had time left in the sprint, they could take on some more but they left that for later.
The total amount of story points for the sprint was now 10. This is the team’s initial velocity.
The sprint backlog now looked like this:
- Create Expense Report
- Send Expense Report For Approval
- Modify Expense Report
- Delete Expense Report
- Logon To Expense Report System
- Create User
- Modify User
- Delete User
- Create Customer
- Modify Customer
- Delete Customer
Each of these had tasks associated with them that are part of the complete sprint backlog and Figure 8-22 shows an excerpt of this backlog.
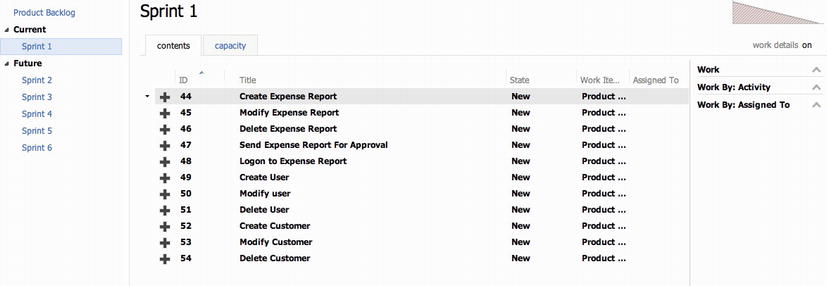
Figure 8-22. Excerpt from the backlog
Updating Backlog/PBI
When the sprint planning was over Fiona updated the sprint backlog and inserted the new tasks into TFS. She associated them with the first sprint (see Figure 8-23). She also added the date when the first sprint would start under Manage schedule and iterations so that TFS was updated with this information.

Figure 8-23. Associating task with sprint
One thing worth considering here is what to do with the epic user stories in the backlog after they have been broken down. Are they still valid in the backlog anymore at that point? In our opinion we can safely remove these backlog items (by setting the status to Removed) as long as we are certain that the content is covered in the broken-down tasks (see Figure 8-24). Fiona removed the epics and got fine granularity of the backlog items at the top of the backlog and larger epics the further down the list she came.
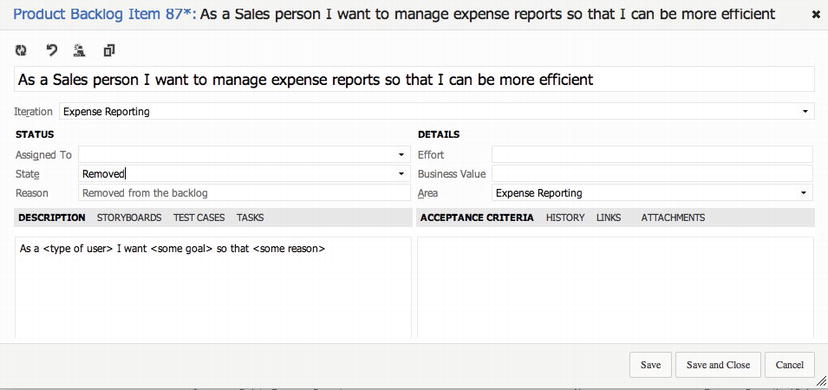
Figure 8-24. Removing a work item by changing its state to removed
![]() Note An epic is a large user story that is so big that it is impossible to estimate how much effort it would take to develop it. You can compare an epic to this user story:
Note An epic is a large user story that is so big that it is impossible to estimate how much effort it would take to develop it. You can compare an epic to this user story:
As a human I would like to have world peace so that we humans will not kill each other anymore.
Even though this example is farfetched, so are many epic user stories—at least until they are broken down into smaller, more manageable, user stories.
There is a nice feature in TFS that will let you create a forecast on how much work you can have in each sprint. It requires that you fill in the effort estimate on each work item. In my example in Figure 8-25 we have story points estimated in effort. We can also see that forecasting is based on the velocity of five story points and TFS automatically draws the sprints and the work items that will fit into each sprint. The forecast can be switched off as well if we do not want to see it, by clicking on or off in the right top of the page.
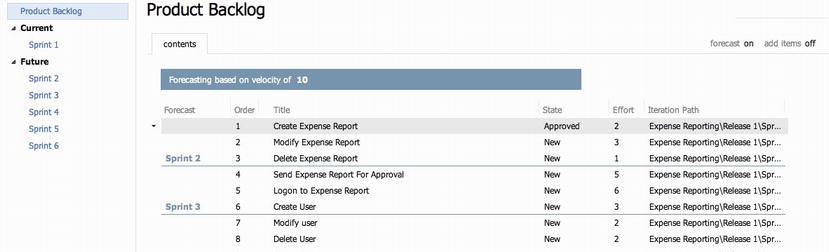
Figure 8-25. Forecast in TFS
We can use the Velocity Report in the upper-right corner of the product backlog to look at the historical velocity numbers and based on that, figure out a good velocity forecast number (see Figure 8-26).
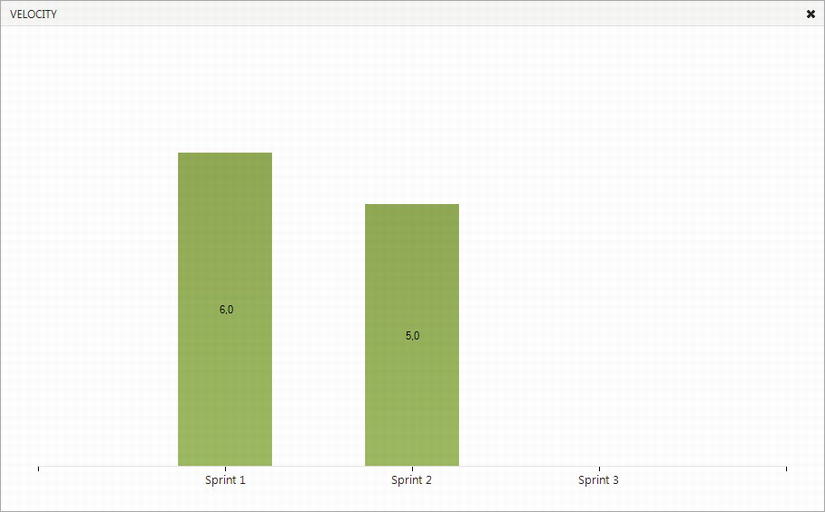
Figure 8-26. Velocity Report in web access
You can also base forecast on hours. Just change the values as you want. TFS uses story points or hours.
Based on the information she knew now Fiona could start planning the releases of the project. She knew the management team would like to know how many releases they were planned and she wanted to give them this information as soon as she could. The first thing she did was look for themes in the user stories.
Themes
Fiona looked at the backlog for quite some time and came up with several themes:
- Expense report management
- Search functionality
- User management
- Customer management
- Project management
- Smartphone availability
She quickly saw that three themes were going to be part of the first sprint. According to the initial sprint planning, Expense report management, User management, and Customer management were all part of the first sprint.
Considering that there were many chores in the first sprint, she knew that all three would not fit in. She aimed on getting the Expense report management theme done.
Fiona also knew the initial theoretical velocity (10 story points), which she used as an input for how much work she could expect in each sprint. With 44 story points total, the project would take 4.4 sprints to complete. She rounded this up to 5 sprints.
![]() Note A chore is just something a team needs to do. It could be setting up a build server, fixing the team room, fixing white boards, installing necessary software, and so on. Chores are never estimated. In the beginning the first sprints are probably filled with chores just to get started. This means that the velocity in the first sprints will be lower than in the coming sprints when most chores are complete. There is just not so much room left for estimated work in the first sprints.
Note A chore is just something a team needs to do. It could be setting up a build server, fixing the team room, fixing white boards, installing necessary software, and so on. Chores are never estimated. In the beginning the first sprints are probably filled with chores just to get started. This means that the velocity in the first sprints will be lower than in the coming sprints when most chores are complete. There is just not so much room left for estimated work in the first sprints.
So, a rough overview would give the following release plan:
- Expense Report Management in Sprint 1
- User Management, Customer Management in Sprint 2
- Project management, Search Management in Sprint 3
- Smartphone availability in Sprints 4 and 5, depending on smartphone
Estimated Time Plan
Fiona then used Excel to create a time plan of the project (see Figure 8-27). She knew this was going to be temporary and could change depending on what happened during the project so she would only show it to the stakeholders and not let them keep a copy of it.

Figure 8-27. The initial time plan Fiona created
After all this was done, Fiona could come up with an initial estimate of the project cost. She knew how many weeks the project would take based on initial estimation, which was 10 weeks. With the help of the admin department she could calculate the weekly cost of each and every one of the team members. She then multiplied the weekly cost with the number of weeks and came up with a cost estimate. On top of this she added the hardware, software, and other costs she knew she would appear. She got an estimated project cost, which she used as input for the management meeting, where she was going to present the time plan and project budget. Luckily the management team approved of the project and she was good to go.
Fiona was now ready to start the project. She began by looking at the startup dates, confirmed again with all managers of the team, and then sent out the invitation for the sprint planning meeting for Sprint 1.
Running the Project
Let’s now briefly take a look at some things where TFS can help us during the sprints. Many of these features have been discussed previously in this chapter, but there are some new things that are handy as well.
During the Sprint(s)
We have gone through much of what Scrum says about sprint work in Chapter 3. In addition, here are some important meetings that the team needs to go through:
- Sprint planning. We have covered this extensively in this chapter. PO, scrum master, and dev team participate.
- Daily scrum. Each team member goes over what they have done since last daily scrum, what they will do until the next daily scrum, and if there are any impediments blocking their way. This is a stand-up meeting a maximum of 15 minutes long.
- Sprint review. This is where we demo the deliverables of the sprint and the PO can sign off on the approved user stories. PO, scrum master, and dev team participate.
- Sprint retrospective. Basically we write down what was good and what was bad during the sprint. Then we select some of the bad things and try to improve them during the next sprint. Scrum master and dev team participate.
Let us start by looking at them again.
Just for repetition, in Figure 8-28 we can see the steps performed during a sprint planning meeting.
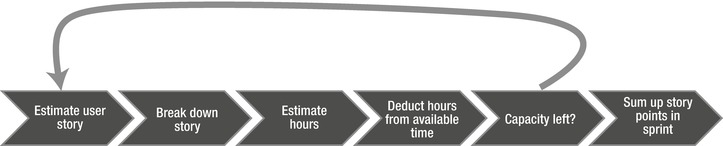
Figure 8-28. The sprint planning process
The outcome of the sprint planning meeting is the sprint backlog, filled with sprint backlog items. We have previously shown how that is inserted into TFS so we will not cover that again here.
Daily Scrum
Each day the team has a stand-up meeting to discuss three questions:
- What have you done since the last meeting?
- What will you do until the next meeting?
- Do you have any impediments stopping your work?
During the daily scrum we should use the task board (see Figure 8-29), which is an excellent way of displaying the work in the sprint and the status of each task.
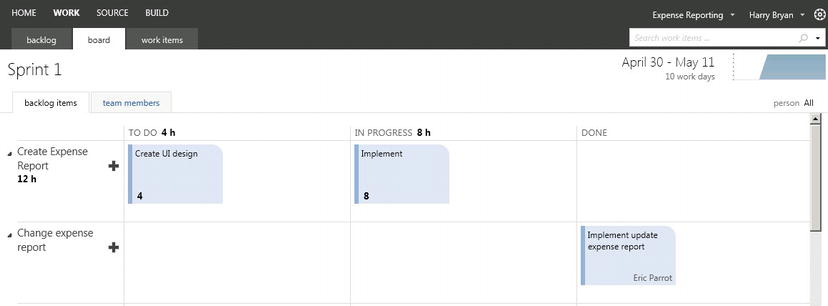
Figure 8-29. The task board in TFS
The agile template in TFS has a work item type for the impediments (see Figure 8-30). We use this to make sure that all impediments are captured and that we do not forget about any of them.

Figure 8-30. The Impediment work item form in the Scrum template for TFS
During the sprint we use the reports and queries that we need. Some of these were shown earlier in this chapter. If there isn’t a report for what we want, we can use Excel or SQL Server Reporting Services to create one. The burndown chart is very much in use in all agile projects, whether or not we use TFS.
In Chapter 9, 14, 19, 24 and 29 at the end of each part of this book we will cover these reports in depth so please refer to those chapters for more information.
As we have seen earlier, during the sprint the PO needs to groom the backlog so that it is in good shape. This means that the backlog should be ordered and that the top backlog items should be broken down into smaller, more manageable pieces. The team helps the PO with this and we estimate roughly 10 percent of available time for the team for this task.
The PO then updates the TFS backlog so it reflects reality. We can easily drag-and-drop items on the backlog to change the order, which is a nice feature.
The sprint review is the meeting where the team shows the PO and any other stakeholder(s) what they have built during the sprint. Any working software should be demoed so that the PO can sign off on the user stories that have been delivered. Nothing of what is shown should be a surprise to the PO. He or she should have been such a part of the sprint that there should be no surprises here.
In the sprint review meeting we can use TFS quite a lot. There are many teams that use TFS for showing the PBIs that they have been working with during the sprint. This way we can see what was done (is everything right?) and what was not. There is also a great benefit using the reports in TFS so we can look at burndown charts and velocity. This information is useful as an input for the next sprint planning meeting.
During the retrospective we look at what was good and what was bad during the sprint. This is by far the most important meeting in scrum. Why? Because this is where we can learn how to improve. Constant retrospective and adaptation is essential for the team if they are to deliver quality software and business value.
We usually execute the sprint retrospective by using a white piece of paper and divide it with a marker pen. The left side is what was good (marked by a +) and the right side is what was not good (marked by a —). The team then calls out what their opinions are and the scrum master documents this on the paper. Sometimes there are very hands-on issues such as writing better comments during check-in, but there can also be softer issues such as “improve communications in the team.”
Based on this retrospective, the scrum master and the team select a few issues from the bad side and commit to improve on these. Issues that need to be taken care of are documented as tasks or impediments in TFS so that we can follow up on them and assign them to the correct person.
Summary
The goal for this chapter has been to show you how we can use TFS for agile project management. The Scrum template in TFS is a very good implementation of Scrum and we can recommend that you try it for yourself.
We have seen how the PO sets off to work on a new project from requirements to the actual start of the project. The focus has been on the PO because that role involves many traditional project management tasks, such as requirements, ROI, time plan, staffing the project, planning the project, and so on.
There are numerous reports and queries in TFS that are helpful to any PO or scrum master and worth the attention of the development team(s). These will be covered extensively in the rest of the book.
1 In Greek mythology, Theseus used a red thread to mark his way through the Labyrinth. http://en.wikipedia.org/wiki/The_Red_Thread.