![]()
Metrics and ALM Assessment for Agile Project Management
After most sections in this book, we will have a short chapter going over the metrics we can get from TFS and also show some examples of the ALM assessment questions in the online assessment Microsoft provides (see Chapter 4) so that you can see how these questions are connected to reality.
This chapter will cover the project management areas, and we will start by looking at some metrics you can use.
Metrics
A Key Performance Indicator (KPI) is a performance measurement and is used in most organizations to evaluate the organization’s success or the success of a particular activity within the organization. Often, KPIs can be used to measure the effects of a change project, for instance, implementing a good ALM process, or they can be used to evaluate the progress of a development project.
You can use the score from an ALM online assessment as a KPI and compare the assessment scores before and after the implementation of an ALM process improvement. This way, you will get indications whether you have improved or not by implementing a new process.
During your projects, you can also use the reports from TFS to see if you are constantly improving your work or not. Continuous improvement, in our opinion, is something to strive for. When it comes to the project management area, you can, for instance, look at the velocity (covered in Chapter 8) of a team and see if it is growing or decreasing. By using reports and metrics from TFS, you can choose the KPIs you want and how to evaluate them.
Standard Reports
To help you to get good metrics about the status of your projects, TFS has many reports available out of the box. The process templates of the reports differ, but when you look more closely at them, you can see that much of the same information is displayed in them. Let’s start by looking at the reports you can use for each process template.
Scrum
Basically, there are four important reports for the Scrum template in TFS:
The backlog overview report lists all user stories, filtered by area and iteration and in order of importance.
We covered the sprint burndown (Figure 9-1) in our agile chapters. This report shows how much work there is left to do in a sprint. Using it you can predict when the team will be finished with the task, within the sprint or after the sprint is finished. Based on this information, the team and the Product Owner (PO) can take actions to make sure they deliver what they have committed to. The release burndown chart (Figure 9-2) shows the exact same thing as the sprint burndown but for the work included in a release.
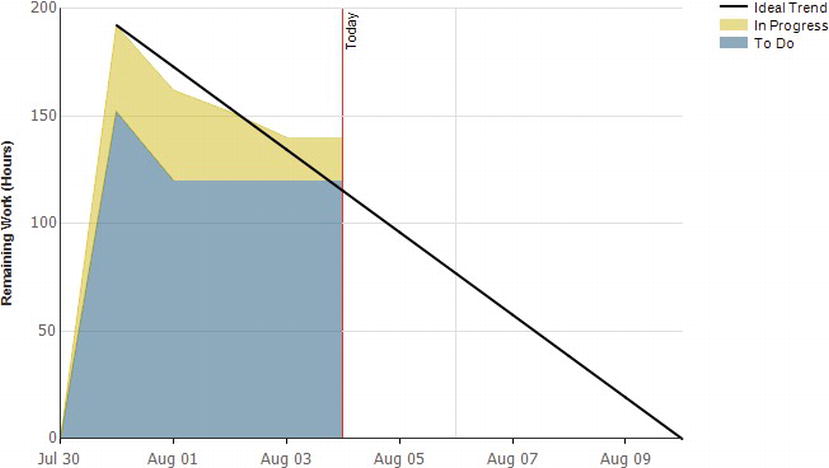
Figure 9-1. Scrum sprint burndown report
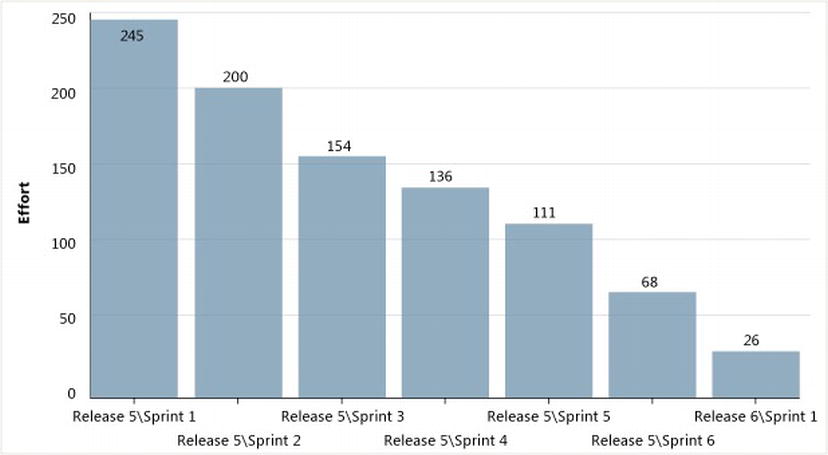
Figure 9-2. Scrum release burndown report
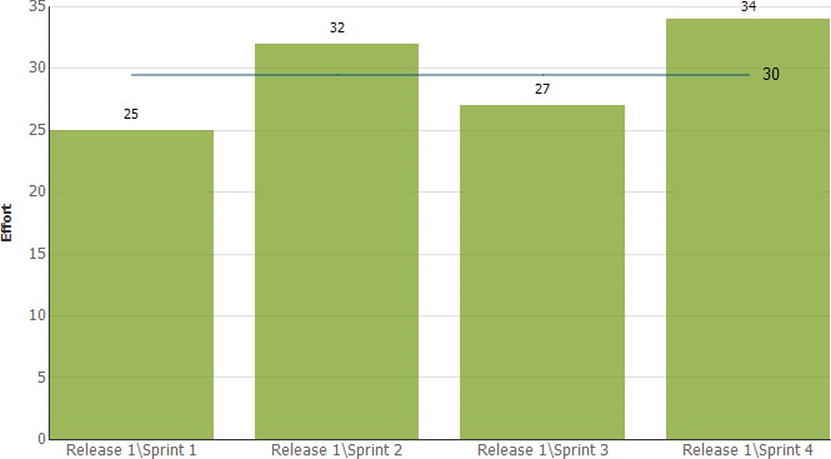
Figure 9-3. Scrum velocity report
Chapter 8 showed that velocity, that is, how much work a team can take on in a sprint, is important. Before any work is started, the PO calculates a theoretical velocity just for being able to start planning. As time goes by, however, this is updated with the team’s real velocity based on how much work they deliver in each sprint. This helps you estimate how much work they can take on in coming sprints. The velocity chart will help you easily retrieve this figure. Here, we will see how much effort the team has delivered for each sprint.
MSF for Agile
The following are the reports for MSF for Agile:
- Burndown and burn rate
- Remaining work
- Status on all iteration
- Stories overview
- Stories progress
- Unplanned work
Burndown and burn rate chart (figure 9-4). No surprises here; this is the same information as for Scrum. The burn rate provides summaries for the completed and required rate of work for a specified time period. You can also see the information for team members as well. You can choose to see the report based on hours worked or number of work items. As users, you must select the start and end date of the report yourselves; you cannot select a sprint like in the agile template.
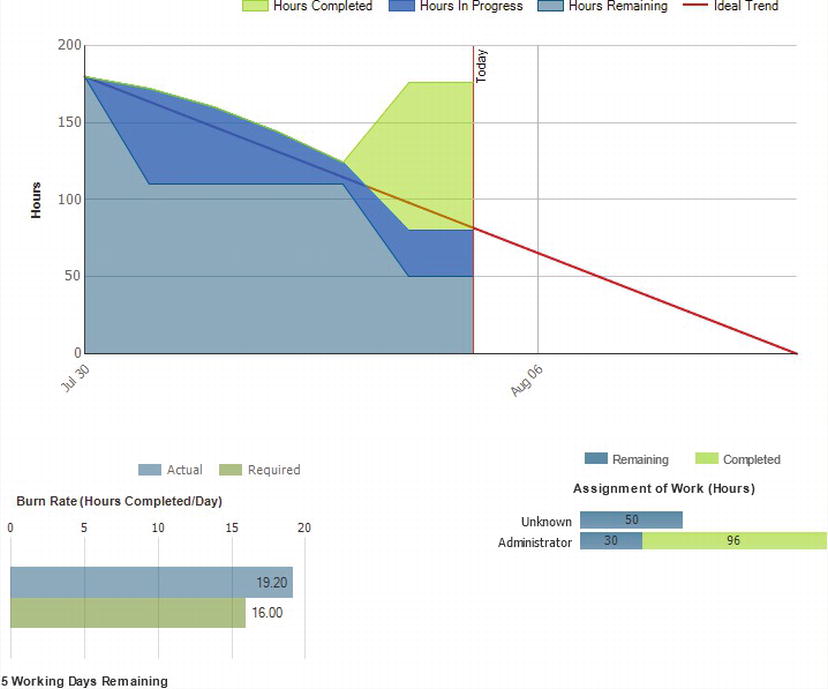
Figure 9-4. Burndown and burn rate report
Remaining work (Figure 9-5). This report can be used to track the team’s progress and identify any problems in the flow of work. You can view this report in either the Hours of Work view or the Number of Work Items view.
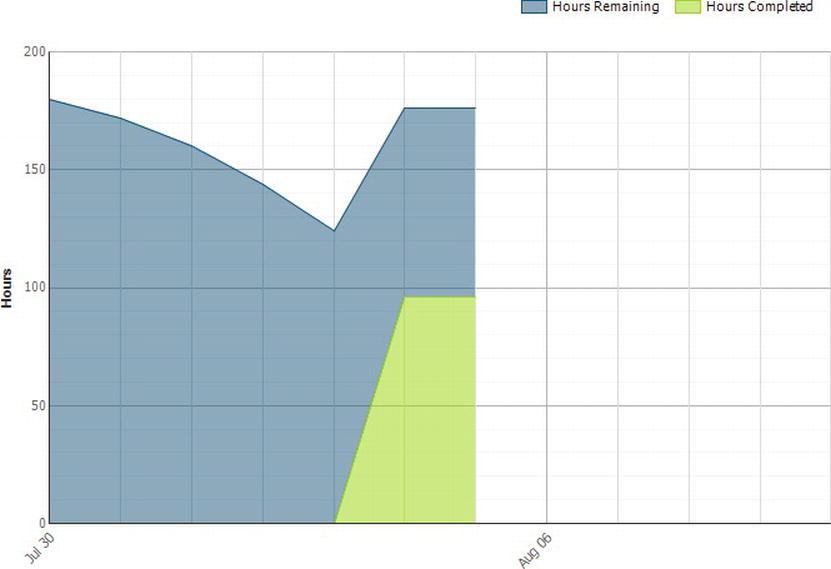
Figure 9-5. Remaining work report
The status on all iterations report (Figure 9-6) will help you track the team’s performance over successive iterations. For each iteration, you can see information on how many user stories you have closed. You can see the progress of the team with information on the original estimate, how much effort has been needed, and also remaining work. This may not be agile in the strictest sense, since only work remaining is important, but it can serve its purpose anyway. This report will also show the bug status (active bugs, resolved bugs, and closed bugs).
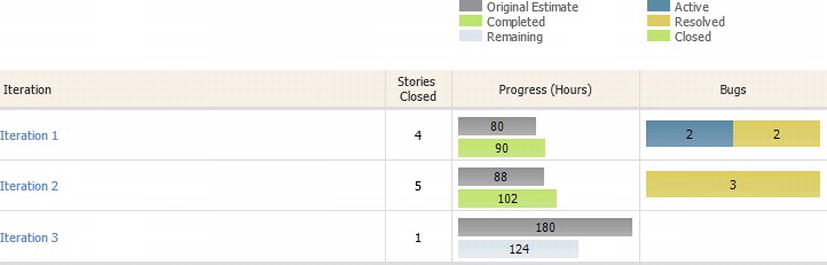
Figure 9-6. Status on all iterations report
The stories overview report (Figure 9-7) and stories progress report (Figure 9-8) list all user stories, filtered by area and iteration and in order of importance. You can see how many hours are completed for a user story and how much work is still remaining.
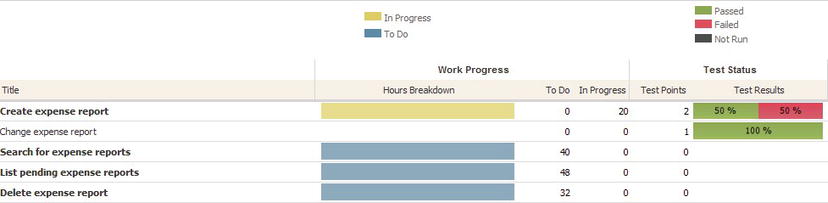
Figure 9-7. Stories overview report
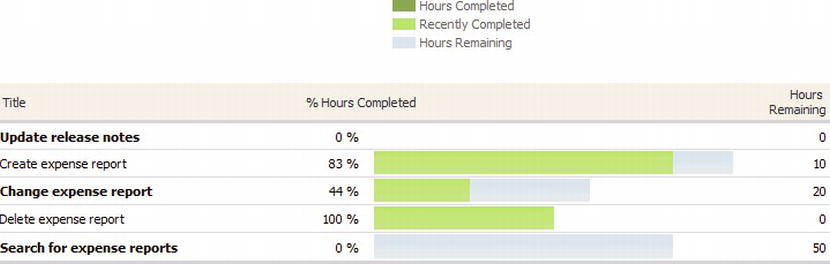
Figure 9-8. Stories progress report
The unplanned work (Figure 9-9) report is useful when the team plans an iteration by identifying all work items that they intend to resolve or close during the course of the iteration. The work items that are assigned to the iteration by the plan completion date of the report are considered planned work. All work items that are added to the iteration after that date are identified as unplanned work.
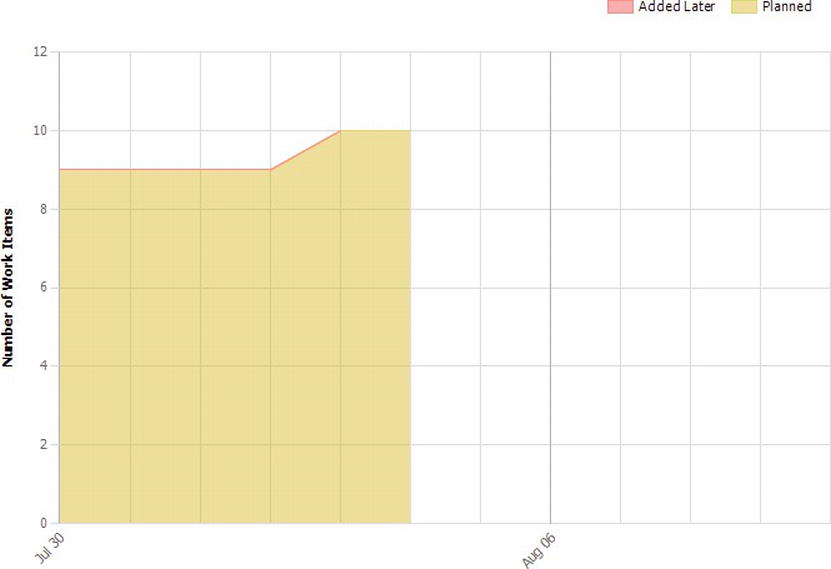
Figure 9-9. Unplanned work report
Most of the same reports are available for MSF for CMMI as for MSF for Agile so we will not cover them again. There are, however, some different reports:
- Requirements progress report
- Requirements overview report
The requirements progress and overview reports list all requirements, filtered by product area and iteration in order of importance. You will see how much work is planned and how much is still left, very much like the user stories reports from MSF for Agile.
![]() Note The reports in this section are mapped to the particular process template it supports. If you find a report you like, it is possible to customize it to work with another template. In Chapter 32, we describe how to customize an existing report to do this among other things.
Note The reports in this section are mapped to the particular process template it supports. If you find a report you like, it is possible to customize it to work with another template. In Chapter 32, we describe how to customize an existing report to do this among other things.
All the reports for all process templates that we have described in the preceding section will help you through the development projects, giving you the information you might need when you need it based on the project management process you have chosen. If you have customized your process, you need to make sure the reports are updated as well.
Custom Reporting
The reporting capabilities in TFS give you access to most of the information you manage in your ALM process. In the previous section, we showed how standard reports give you metrics for your project at a general level. By customizing, extending, and creating new reports, you can really get the intelligence to know what works well in your projects and what does not.
In this section, we will go through the relevant data warehouse models which you can use to create custom reports for project management. Understanding of these models is essential if you want to be able to gather metrics for your reports, so we recommend spending some time investigating the models.
![]() Note In Chapter 32 we will look at the details of reporting in TFS, including how to create custom reports based on the data models described in the following section.
Note In Chapter 32 we will look at the details of reporting in TFS, including how to create custom reports based on the data models described in the following section.
The data warehouse for around-project management is mostly work item data and relationships to information such as associated changesets and test results. In the following sections, we will look at how these tables can be used to give current information as well as data1 for trend analysis.
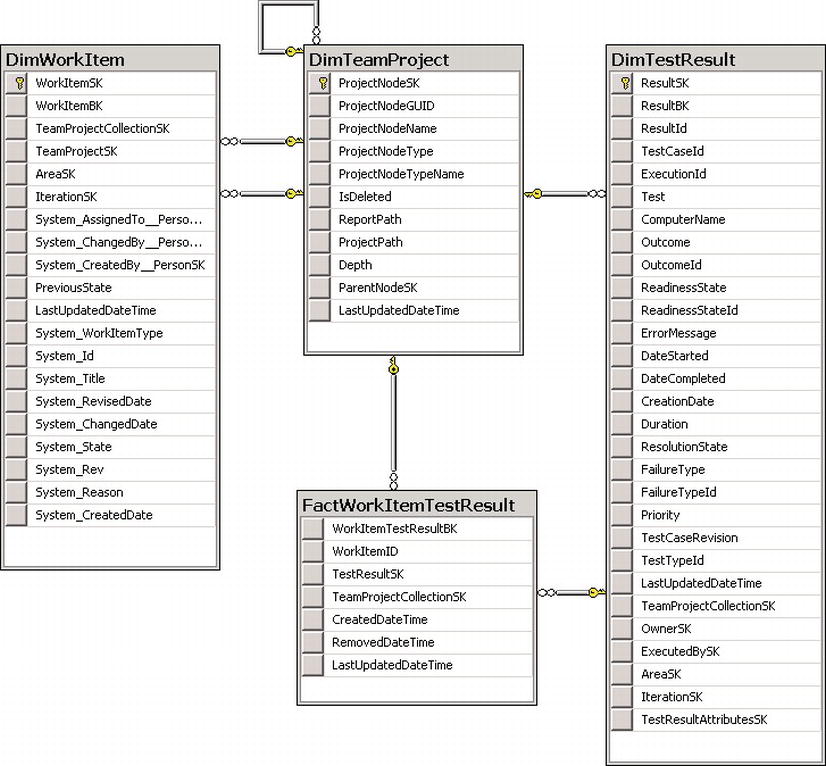
You can use the current work item tables to query for data about the current states of requirements, bugs, tasks, and other work item types.
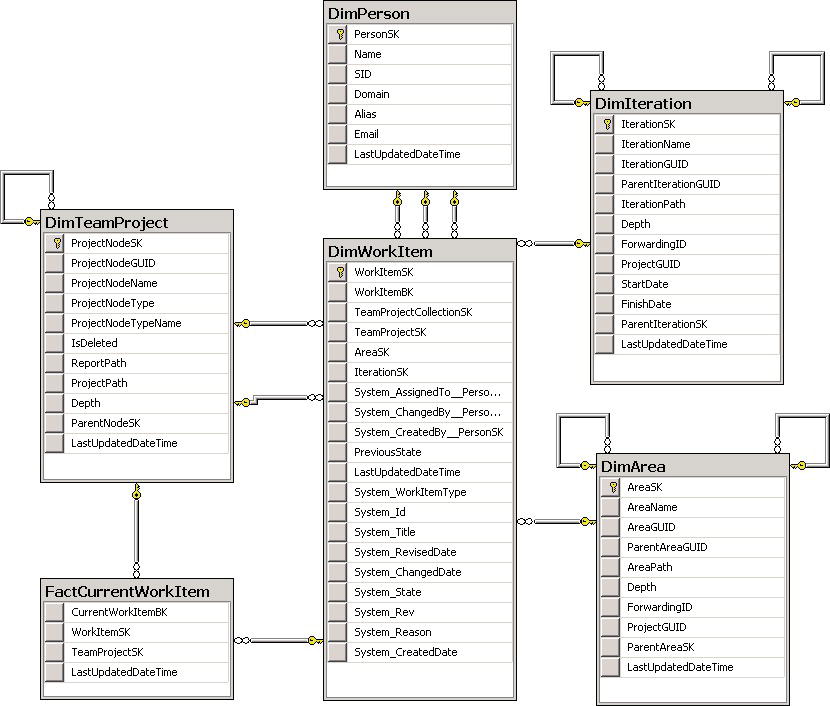
Figure 9-10. Current work item data model
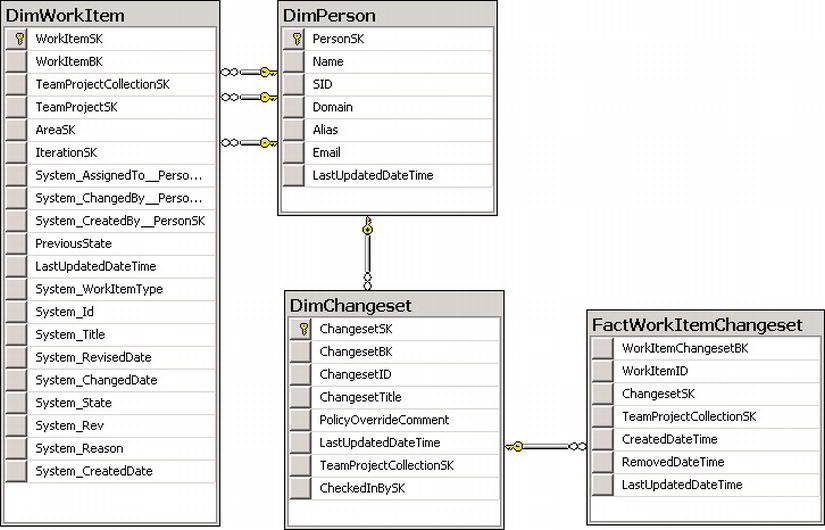
The work item history tables give information about historical data about the different work item types. You can use these tables if you want to create a report on how a field has been changed over time (for auditing purposes, for instance) or to create progress and burndown charts.
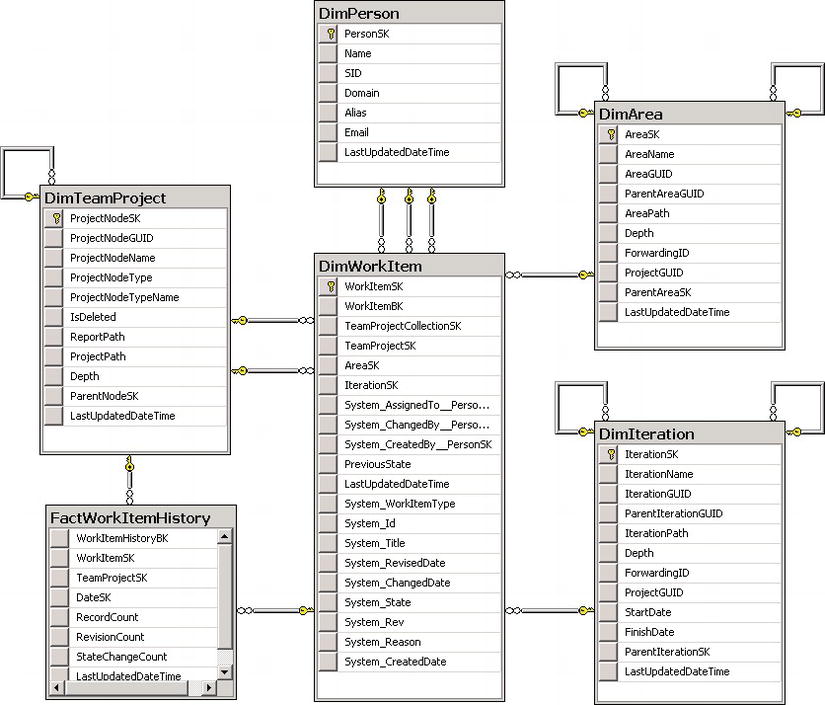
Figure 9-11. Work item history data model
You use the work item link tables to query for relationship information from the work item warehouse, for instance if you want to create a report over the status of tasks for a give product backlog item.
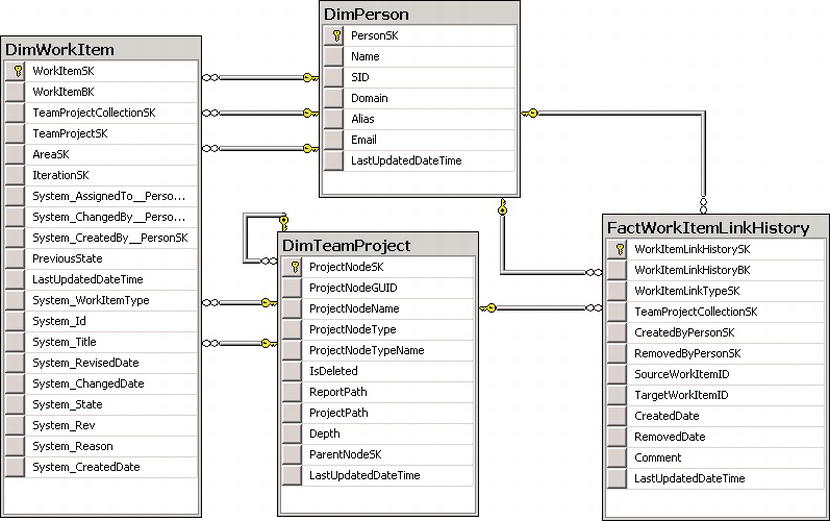
Figure 9-12. Work item link history data model
These tables can be used to query for data about work item categories.
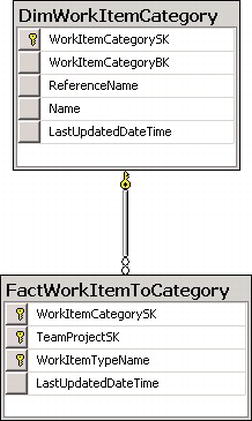
Figure 9-13. Work item category data model
Assessment Questions
In order to help us evaluate an organization’s maturity in different ALM areas, Microsoft has developed their ALM assessments, which may be read about in Chapter 4. Based on the score of the assessment, we receive a maturity level for a specific area. There are four levels:
- Basic, which means that the organization has brittle, disparate applications and platforms. Much is homegrown and processes are not documented. Much is performed ad hoc.
- Standardized, which means the organization has standards-based flexible business applications. Processes are starting to come into place but not every department follows them.
- Advanced, which indicates more adaptive application platform driving core applications and business processes. Here, processes are followed and maintained, best practices are used; this is what most companies might strive for.
- Dynamic, which is a fully dynamic application platform. Very few companies reach this level, but maybe it is not necessary to either.
So, based on the score, you can help the organization reach the maturity level they need for these areas. The following table (Table 9-1) list questions that can be used as a basis for an ALM assessment in the project management planning phase. These questions are taken from the online assessment. Keep in mind that some of these questions are asked based on a Waterfall approach to development. These are useful questions no matter if the organization uses an agile method or not.
Table 9-1. ALM Assessment questions
These tables also feature some input from us for some questions. We have chosen not to comment on all questions but will focus on some of the most important ones for each area.
Summary
In this chapter, we have looked at the concepts of metrics and assessment for agile project management. We have seen how you can use TFS to retrieve information for KPI assessment and also how you can see the project status using standard reports from TFS.
We have also shown how many of the assessment questions from the Microsoft online assessment can help us plan for successful implementation of project management practices.
The next section of this book will cover the architecture and design topics of development using TFS.
1 If “data” not correct here, please clarify “as well as date for trend analysis.”