CHAPTER 6
![]()
The Utility Database
Time and time again, I have been able to use my own custom database, named the utility database, to solve problems. This has shortened troubleshooting times by supplying additional insight into what the system has been doing historically, and what the system is doing now. The utility database has reduced my repetitive and time-consuming tasks, such as reviewing the error logs, by automating and using SQL Server Reporting Services (SSRS) to send reports on a daily basis to my e-mail. When you are able to record database history, it makes it much easier for you to identify certain database patterns, such as growth. The additional data eases the ability to forecast key issues, such as performance degradation or the volume of disk space required when new hardware needs to be ordered.
When you are responsible for the well-being of a database or a server, there are a number of key factors that you must pay attention to or your long-term system health and performance will be at risk. Some of these tasks require much time and manual effort to verify that the systems are behaving as expected.
As a consultant, one of my first experiences with a client had me diagnosing an error they received when the transaction log backups would fail overnight. The error message they were receiving indicated they didn’t have enough disk space to store the backup file. There were some serious concerns as to why this happened each night, because when they came in the next morning and started to research the failure, there was plenty of disk space on the drive for the file. In addition, subsequent transaction log backups would complete without any problem.
My suspicion was that a file was being created on the drive, that would consume the required free space. Long before the morning shift would start, the file would be removed, leaving the space open and the appearance that the error message they received was incorrect.
I was able to create a utility database to track the disk free space to solve the issue. The process reviewed the amount of free space on the drive, and the results were then inserted into a table every five minutes. I then built a report off those results, which provided visibility as to what was happening.
It quickly became apparent that my hunch in this situation was correct. I was able to narrow down the time when the space was consumed, and again when the space was released, along with the list of files on that volume. With this data, we were able to find the source of the error, correct it, and give the client new visibility into the disk space usage.
Over the course of this chapter, we will review some of the strategies used to create the utility database and leverage the use of it, allowing you more time for necessary project-oriented tasks. The information in this chapter is designed to give you the fundamentals of how to retrieve, store, process, and report the information. This, in turn, allows you to move your work strategy to a proactive style rather than a reactive style where workers feel as if they are only there to chase down problems after they occur. Think of this as a style to work smarter, not harder.
Start with Checklists
The key aspect to the utility database is that it is a collection of data that is designed by you, and contains data that is important to you and your environment. A way to look at a utility database is as a custom monitoring utility designed just for you, by you. I’ll make a series of recommendations in this chapter on some of the trackable items that you might consider storing in your database. The examples can be used as is and should provide additional insight into the databases and database servers that it gathers data from. However, the usefulness is multiplied when the data is meaningful to the individual user or organization. Keep this in mind as you read through this chapter, and consider aspects of different information that might be critical to your database. As you review the examples provided, take note of the strategies we use to gather the information on those databases, and then think about how you can apply these strategies to your utility database. A strong argument can be made that the utility database should never stop gaining new features, and I urge readers to take this stance. If there is a task that you perform more than once, you should consider whether this is something that your utility database can automate.
Recently, while boarding a flight, I observed how the pilot walked around the plane. He looked at the engine, the wheels, and some other key components. He then entered the cockpit, retrieved a clipboard, and began to check off items while assessing the instruments on the control panel. As a nervous flyer, I was comforted by his due diligence in making sure the craft was ready for flight.
In like fashion, you should review the health of your servers each day. Check the backups to make sure they executed properly, and review the error logs to look for any looming issues, along with many other key points. Likewise, the company will be comforted in knowing that the database is ready for the upcoming operations. For the pilot, this was a lengthy process that included many people looking at multiple aspects of the plane. For a database administrator, many of these tasks can be automated after they have been identified.
Each server may utilize different features of SQL Server 2012; for example, some systems require AlwaysOn, while some do not. Some of your required features might need different checks on a regularly scheduled interval; for instance, if you’re using AlwaysOn, you might want to validate the latency each day to ensure the network and the databases are performing to standards. The checklists that follow identify tasks that you might require for success with SQL Server 2012, including tasks that ensure the ability to recover your SQL Server. Each installation and feature usage may change the items that you require.
Daily Checklist Items
The following items should be checked daily:
- Backups—Recovery means that a backup is required. Without a proper backup, the database could be lost for good. A backup plan is the best place to start, but ensuring it is running each time without failure is critical for long-term success.
- Automated Restores—The most effective way to validate a backup plan is to exercise it, but that can be time consuming and often forgotten about when staff is busy. Automating restores is common, but not complete unless the restore is being monitored for success or failure.
- Error Logs—Many issues present themselves in the error log, but similar to the automated restores, checking each one of these daily in a busy environment can quickly consume a large portion of the day. This check is often skipped to complete tasks that might be considered more pressing.
- SQL Server Jobs—SQL Server 2012 gives the user the ability to schedule jobs. These jobs could be maintenance or tasks that are critical to the operations of the business. The completion of these jobs needs to be reviewed each day.
- Disk Space/Database Growth—Databases should be checked to ensure they have plenty of space to accept new data. Depending on the options of the database, this could mean internal checking of the database to make sure the files have enough free space, or it could mean validating that there is enough drive space for the database to grow.
- Integrity Checks—The health of the pages inside the database can be verified by running a number of integrity checks. You must make sure that these checks yield error-free results each time they are executed.
- Index Health—Indexes to databases can be compared to an index of a book. As more pages (i.e., information) are added to the book, the index will need to be adjusted. Likewise, more information added to a table may result in adjustment to its indexes. The performance of the database relies on this task being done. If performance is critical to the SQL Server, you must review the indexes and their efficiency.
- Security—It is common to log failed attempts to access the databases. Logging is good, but it is equally important that you review the log so that you can take any necessary corrective action.
- Key Business Indicators (KBI)—Many organizations have indicators in the data that determine not only the health of the database, but the health of the business. For example, if the database was for support of an emergency 911 system, a KBI could be the number of calls in queue that need to be answered. Even though the number might not be directly related to the performance of the database, a high number of calls could indicate that the database cannot keep up on logging the information.
Longer-Term Checklist Items
The following items don’t need to be checked daily, but should be done periodically. Each environment (e.g., a nonprofit vs. a public company) has different requirements that could determine the frequency. I recommend completing these items no less then once a quater.
- Audits—Audits are starting to be required by more organizations each day. Even if it is not required, it is a good practice to audit your servers regulary. It might be as simple as a quick inventory audit, or you could need an in-depth security audit.
- Patches/Service Packs—SQL Server 2012 is a stable platform and is proving to be very reliable, but on occasion it might need a patch or a service pack to remove potential errors in the code or enable some features. Keeping track of what version the database server is and when these versions have changed can be critical in troubleshooting issues.
- Configurations—Validating the configuration of the SQL Server is as important as ensuring the configuration is correct the first time. In environments where more accounts are able to access and change the configuration, it is crucial to continually check that the proper configuration is in place.
- New SQL Servers—SQL Server has many versions, each with different features, prices, and licensing. Many applications install a version of SQL Server for the database support that they need. Checking to make sure that you are licensed correctly and that each of the servers is being maintained can be a difficult task to do once. Doing this task on a repeated basis can be overwhelming and time consuming, but critical.
What might appear to be an extensive checklist of tasks is really only a scratch on the surface. The items are too numerous to list, and as you work with SQL Server 2012 in your environment, new items will become obvious. The addition of other repetitive and time-scheduled tasks should fit into your utility database structure using the same design with some slight adjustments.
Utility Database Layout
The structure of the utility database is key to the long-term ease of use; enterprise use of the utility database begins here. A good understanding of the structure eases the addition of new features and customization to ensure useful data is collected in each environment. Without a defined structure, upgrades and the organization of the database becomes complex. The utility database we will be working with in the examples is separated into the following three major categories:
- Category 1—Core installation specific
- Category 2—Feature specific
- Category 3—Domain specific (KBIs)
The first of these categories is the data that must be collected on all the SQL Server installations that will use the utility database. Data such as SQL Server version, inventory of SQL Servers, and index fragmentation fit into this category.
The second category is data that is dependent on features that may be implemented on the SQL Server, such as AlwaysOn and SQL Server Audits. This category of data provides a layer of history and monitoring that might not be available in other methods. For example, a table that I include in here often is the cluster node history; this provides information as to what node of a cluster was hosting the SQL Server historically.
This third category has been extremely helpful to me as a consultant. As discussed in the previous checklist section, each business has different key business indicators. Data that does not fit in a core install of SQL Server, and does not fit into the features of SQL Server, fits into this third category. For example, if we reuse the previous 911 call list queue example, a table in this category would store the date and time of how many calls were waiting in the queue. This data does not have to do with SQL Server core install nor SQL Server features; instead, it falls into the third category of domain-specific data.
Data Storage
The data in your utility database fits into many different groups. Organizing the data based on the intent of how it will be used in the future, and how long the data is retained, helps in the determination of how the tables are designed.
- Group 1—Data in which historical content is being analyzed
- Group 2—Data that is reviewed for current health
- Group 3—Archived data
Data that is reviewed for historical trending, such as database growth, should be retained long term. An example of the benefits of grouping like data can be seen with database growth as the measured value. The primary benefit is to determine what the growth rate is and to measure that growth rate over the course of time. You could draw secondary benefits from this historical information as well; for example, the data footprint after a major release, or when a database growth pattern stopped or started, add valuable information when troubleshooting.
Data that has no long-term value, but might be part of a daily checklist report, might not need to be retained longer than 24 hours. An example of this data group could be the SQL Server error log. SQL Server error logs can be imported and then filtered each day by the utility database. When this data is reported, the report can include only the data that is relevant. The filtered data might not be relevant after the initial report of the data, and might not need to be kept. In the example of SQL Server error log filtering, the original source of the data (the error log), is not altered; therefore, keeping the data would create duplicate information.
There is a slight difference between archived data and historical data. The historical data is being kept around to identify long-term trends (such as growth). The archive data group gives you the option to log information that was sent in a report, but then removed. In the case of the SQL Server error log, there might be no need to keep detailed data because of the duplication of data, but a user might want to see what data was sent in a previous report. The archive data, if you choose to use it, would be the data that was sent in a report, but then deleted. This allows you to re-create reports that were sent in the past. Keep in mind that this might not be useful in each utility database implementation.
Figure 6-1 shows how a category can have one or more groups. The core install category (Category 1) collects information about the basic install, such as database growth and SQL Server error logs. After reporting, the SQL Server error logs table (filtered data) can be truncated, making it a Group 2. The database growth table would be retained long term for historical trending, making it a Group 1.
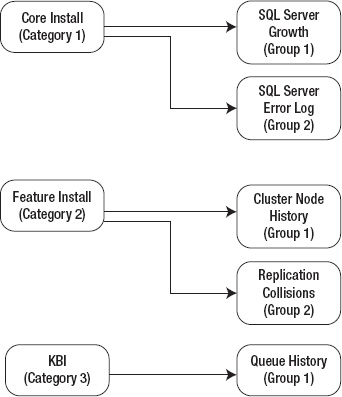
Figure 6-1. Data grouping
Using Schemas
When creating the objects that will reside in the utility database, consider using schemas to keep the tables organized by categories. In the past, I have found this helpful when I use the same Category 1 collection on multiple servers, but only use the relevant Category 2 collections on SQL Servers where the feature is installed. For example, if I am logging data about mirroring, I create a schema named Mirror. In addition, when working with KBI data, I use the company name as the schema name. You will see this practice being used throughout this chapter.
Using Data Referential Integrity
Good database designs incorporate the proper use of data referential integrity (DRI) (i.e., the proper use of foreign keys and primary keys). This can also include default values or other constraints in the database to ensure that your data follows all the rules that are required.
Proper DRI is not difficult to implement, but with each deployment of a utility database, being flexible and custom to the environment that it is being deployed alters the requirements slightly. Don’t let this be a reason to not use the proper DRI in your implementation.
For the purpose of the examples in this chapter, there might be places where you will see that some of the DRI is not being used when it should be. I might have excluded it in the examples to save on space, or to simplify some of the examples. In the examples where the data referential integrity is critical for the operations, it has been added in the example.
Creating the Utility Database
The initial step in creating a utility database is creating the actual database itself. The configuration options of your individual database will depend on your environment. The options that I tend to use when creating my utility database include leaving the database on Full Recovery mode. Many times, KBI stored in the utility database can be extremely helpful for troubleshooting, so I tend to backup the database aggressively to allow for the least amount of data loss, in case of a restore.
If you are following along with the examples listed here in the rest of this chapter, they will be using the database named dbUtilities. The following create script will create the database in the default data and log directory that has been configured on the server. Make sure to test this and all other code in a test environment before pushing it to production servers.
USE [master]

GO


CREATE DATABASE [dbUtilities]

 GO


ALTER DATABASE [dbUtilities] SET COMPATIBILITY_LEVEL = 110

GO


ALTER DATABASE [dbUtilities] SET RECOVERY FULL

GO
After the database has been created, and the options have been set, the next step is to start gathering data. The next section will discuss some of the strategies that can be used to gather data, store data, and manage data.
Table Structure
Categorizing and grouping the data that the utility database is going to be collecting will drive the design of the table that you will use to store the data. Predefining how the tables should be organized will ease the implementation of adding watched items to the utility database.
Historical Data Tables
Historical data tables store the data that provide trends. A good example of this type of data collected is the standard baseline information you might want to review before the purchase of new hardware. Processor performance, disk space, database growth, and memory usage are just a few items where historical information can greatly impact decisions in the future. A standard table format that can be used for historical information can look like this:
USE [dbUtilities]

GO


CREATE TABLE [dbo].[Sample_Historical_Data](

    [PrimaryKeyID] [int] IDENTITY(1,1) NOT NULL,

    [Measureable] [varchar](100) NOT NULL,

    [MesuredItem1] [int] NOT NULL,

    [MesuredItem2] [int] NOT NULL,

    [MesuredItem3] [int] NOT NULL,

    [MesuredItem4] [int] NOT NULL,

    [ReadingDate] [datetime] NOT NULL,

CONSTRAINT [PK_PrimaryKeyID] PRIMARY KEY CLUSTERED

    ([PrimaryKeyID]))
A few items to note: each one of these tables should have a primary key, but depending on how you access the data, additional indexes may be required for the quickest database access. All the values in this example will not accept null values, and this might not always be appropriate for each of the historical table measures. The date that the data is gathered can be important for viewing proper trends, even though in this example, a sort could be done on the primary key. The reading date might not always be the date that a measure occurred. For example, when querying the stored procedure execution times, an average might be recorded for the prior week. The reading date could present the data of when the information was gathered and inserted into the table, and additional dates might be required.
Current Health Tables
When creating the current health table, the purpose of the table is to keep information long enough so that an action can be taken on that data. This action could include tasks that should be completed, such as calling a stored procedure or even a report. Data that resides in the current health tables should be treated as temporary. An example of using a current health table to store data, until which time the collection is complete and a report is executed, is a daily checklist report. With these tables, the columns in the tables are not always specific and can represent many different items. Take a look at the following example:
USE [dbUtilities]

GO


CREATE TABLE [dbo].[Daily_Report](

    [ReportRowID] [int] IDENTITY(1,1) NOT NULL,
    [EventStatus] [varchar](50) NOT NULL,

    [EventDate] [datetime] NOT NULL,

    [EVENT] [varchar](2000) NOT NULL,

 CONSTRAINT [PK_Daily_Report_ReportrowID] PRIMARY KEY CLUSTERED

    (

    [ReportRowID]))

GO
The EventStatus is a value that I often use for grouping data in the right collection with the Event storing the data. Multiple rows in this table could contain the EventStatus of database growth, but the Event value would be different for each row of data, such as “Database 1 growth is 10%,” and the next row containing “Database 2 growth is 2%.” A report could group on the EventStatus so all of the database growth information is reported together.
Archive Tables
A common use for the archive tables is to view a historical representation of a current health table as it was before the next collection of data was executed. Before each collection of data begins for a time frame, the current heath tables can have the content moved to the corresponding archive table.
USE [dbUtilities]

GO


CREATE TABLE [dbo].[Daily_Report_Archive](

    [ReportRowID] [int] NOT NULL,

    [EventStatus] [varchar](50) NOT NULL,

    [EventDate] [datetime] NULL,

    [EVENT] [varchar](2000) NOT NULL,

CONSTRAINT [PK_Daily_Report_Archive_ReportrowID] PRIMARY KEY CLUSTERED

    (

    [ReportRowID] ASC

    )) ON [PRIMARY]

GO
An item of note: in this example, the identity attribute to the ReportRowID was removed. The following is an example of how to move data from the current health tables over to an archive table:
USE [dbUtilities]

GO


CREATE PROCEDURE [dbo].[Archive_Daily_Report]

AS

    INSERT INTO Daily_Report_Archive

    SELECT * FROM Daily_Report

IF @@error = 0

    BEGIN

       Delete dbutility..Daily_Report

    END

GO
Gathering Data
Without understanding the options for data collection, the utility database is limited in what data is collected. As new versions of SQL Server are released, the inner workings of SQL Server become more accessible, providing further information that allows users to make more critical decisions than with the previous versions. In this gathering data section, we will look at some of the options available. In the last part of this section, examples will show how to take advantage of these options, maximizing the usefulness of the utility database.
In the earliest versions of SQL Server, a seasoned professional would spend time diving into the system tables, not only in the system databases, but the user databases as well. SQL Server 2005 introduced us to dynamic managed views, which have been expanded with each new release. In the most recent version, SQL Server 2012 extended events are easier to use than ever before. A key component to keep in mind when creating the utility database is the right method to collect data for the version of SQL Server that the utility database will be collecting data for.
If the utility database you are implementing supports multiple versions of SQL Server, a piece of code that could be helpful checks the version of SQL Server that is actively connected, like so:
SELECT @@Version
Or, you might find that checking the version of the database by using the serverproperty function provides a little more information. The serverproperty expression provides much information about your SQL Server and can be extremely helpful.
SELECT SERVERPROPERTY('productversion') AS 'Version Number',

    SERVERPROPERTY ('edition') AS 'Edition'
The results of the script will be similar to this:
11.0.2100.60

Developer Edition (64-bit)
System Tables
Older versions of SQL Server used a number of system tables to manage the databases. Over the course of time, many of these tables have moved, or have been renamed. The amount of system information data has grown, as well as the need to access that data. The process that is implemented in the examples shows how the system tables can be queried. Keep in mind when looking at system tables that many of them have had system views added that provide more information.
Extended Stored Procedures
Extended stored procedures are stored procedures that can make DLL calls outside of SQL Server to retrieve information. For example, using xp_cmdshell in older versions of SQL Server was the best way to complete tasks such as getting a directory listing, running batch files, or reading the error log. Be aware when using extended stored procedures that some of them are listed as deprecated, so they might not appear in future releases of SQL Server beyond 2012. For the extended stored procedures that are being deprecated, a replacement may be made with CLR.
![]() Note IA list of deprecated features can be found on Microsoft’s web site at
Note IA list of deprecated features can be found on Microsoft’s web site at http://msdn.microsoft.com/en-us/library/ms143729.aspx. Keep in mind that each version of SQL Server has a new list of deprecated features, and that most features that are being removed have a new feature that improves upon the older deprecated feature.
CLR
Common Language Runtime (CLR) integration provides an environment that enables SQL Server to execute managed code that, traditionally, Transact-SQL was not designed for. This CLR integration adds flexibility to SQL Server by allowing SQL Server to utilize the strengths of other programming languages. CLR can often be tricky to implement, and is not in the scope of this chapter; however, the example on collecting processor utilization uses this method. In some cases, altering processes to run in the CLR environment greatly improves the performance of that process.
DMVs
Dynamic Management Views (DMVs) give the user a view into the current SQL Server state. Many features of SQL Server, such as replication, file stream, extended events, wait times, and AlwaysOn, have DMVs associated with them. When gathering data for the utility database, the DMVs are one of the more powerful sources of data because of the completeness of the data and the ease of access. DMVs are installed with the standard installation of SQL Server; because of this, it is easy to find ways to access the information. To find more information on DMV best practices, refer to Chapter 4.
![]() Note ISQL Server MVP Glenn Berry (the author of Chapter 15) has a collection of DMV queries that have proven to be extremely helpful time and time again. Many of the examples in this chapter are based on accessing data thought the DMVs, either in part or completely on the code he has written. Glenn’s blog can be found at
Note ISQL Server MVP Glenn Berry (the author of Chapter 15) has a collection of DMV queries that have proven to be extremely helpful time and time again. Many of the examples in this chapter are based on accessing data thought the DMVs, either in part or completely on the code he has written. Glenn’s blog can be found at http://sqlserverperformance.wordpress.com.
Storage
The amount of free space remaining on your database storage device and the amount of space that a database occupies are two pieces of information a database professional should be aware of. These two different and distinct numbers are not always related.
Database File Sizes
The size of the databases on a SQL Server instance is a measurable quantity that should be tracked on each individual instance of SQL Server. Having the historical growth information over a long period of time will increase the odds of accuracy for future storage requirements. Defining the data as such helps determine a table structure that is logical for the utility database. Create the table with a model that is aimed at long-term retention of the data.
USE [dbUtilities]

GO
CREATE TABLE [dbo].[File_growth](

    [FileGrowthReadingID] [int] IDENTITY(1,1) NOT NULL,

    [Physical_Name] [nvarchar](200) NOT NULL,

    [Size_in_MB] [int] NULL,

    [Reading_date] [datetime] NULL DEFAULT GetDate(),

CONSTRAINT [PK_FileGrowth_ReadingID] PRIMARY KEY CLUSTERED ([FileGrowthReadingID]))

GO
To populate the table with data that accounts for each file associated with each database on the managed server, perform a simple query of the system table. This will provide a page count for each file. Each page stores 8k worth of information. Therefore, to calculate the total size of a file (in megabytes), multiply the total page count by 8k pages. Divide the total size of the file by 1024 (the number of kilobytes per megabyte) to determine the file size in megabytes. There is more than one database on each instance (system databases), so to measure the size of each file in each database, the sp_MSforeachdb stored procedure can be used.
The stored procedure that retrieves this information can be created and compiled in the dbUtilities database, in the same schema as the table it is populating.
USE [dbUtilities]

GO


CREATE PROCEDURE [dbo].[Get_File_growth]

AS

DECLARE @RETURN_VALUE int , @command1 nvarchar(1000)

SET @command1 = 'Select

                Physical_name,

                Size_in_MB = (size * 8 / 1024)

                from ?.sys.database_files'


INSERT INTO File_growth (Physical_Name, Size_in_MB)

    EXEC @command1 = sp_MSforeachdb @command1 = @command1

GO
After the table and the stored procedure have been created, execute the stored procedure to gather all the current database sizes.
EXECUTE [dbUtilities].[dbo].[Get_File_growth]
The results can be seen by selecting the rows from the table.
SELECT * FROM [dbUtilities].[dbo].[File_growth]
The remainder of the examples in this chapter will not include the execution of the collections or the validation of the result statements because they are simply statements with different object names. The collection of the database file growth information is collected only when the stored procedure executes. Later in the chapter, methods and timing of the data collection will be reviewed.
Finding the Amount of Free Space
Understanding the file growth rate of your databases is an important fact, but without the space to grow into, trouble can quickly arise. Understanding the amount of space that is left on a storage volume can be not only historically relevant for planning, but an alerting or monitoring point as well. When considering these traits, this data category matches the definition of a Category 1. The grouping of this data fits in both historical and current health. To keep track of the historical information, the table design echoes that of the database file growth table, discussed in the previous section.
USE [dbUtilities]

GO


CREATE TABLE [dbo].[Free_Drive_Space](

    [DriveSpaceReadingID] [int] IDENTITY(1,1) NOT NULL,

    [Drive] [char](1) NOT NULL,

    [MBFree] [int] NOT NULL,

    [ReadingDate] [datetime] NOT NULL,

 CONSTRAINT [PK_Free_Drive_Space_ReadingID] PRIMARY KEY CLUSTERED

    ([DriveSpaceReadingID]))

GO
Tracking this data is not only relevant to the historical health of the database; it also provides a point where the current health of the database can be reviewed. If the amount of free space decreases to a point where action needs to be taken to ensure future database stability, then the attention of the administrators needs to be raised. The results from the following stored procedure can be inserted into not only the Free_Drive_Space table for historical reference, but also into the current health table, Daily_Report.
USE [dbUtilities]

GO


CREATE PROCEDURE [dbo].[Get_Drive_Space_Free]

AS

DECLARE @driveSpace TABLE (drive CHAR(2), MBFree int)

    INSERT INTO @driveSpace

        EXEC sp_executesql N'xp_fixeddrives'

INSERT INTO [dbUtilities].[dbo].[Daily_Report]

        SELECT 'Drive Space', GETDATE(), 'Free space on ' + drive +

' is ' + CONVERT (VARCHAR(20), MBFree/1024) + ' Gigs'

            FROM @driveSpace

INSERT INTO [dbUtilities].[dbo].[Free_Drive_Space]

        SELECT Drive, MBFree,GETDATE()

            FROM @driveSpace

GO
The Get_Drive_Space_Free stored procedure is an example of using extended stored procedures to gather information outside of SQL Server, and how to store that information.
Processors
Understanding how hard the processors are working is also an important key data point, but accessing this information is not easy. One option to retrieve this information is to review the DVMs. This information, however, includes statistics on how SQL Server is using the processors, not the actual processor utilization numbers that you might need.
One method that can retrieve processor information from the operating system level is Windows Management Instrumentation (WMI). A great resource for WMI can be found in Microsoft’s Script Center (http://technet.microsoft.com/en-US/scriptcenter/default.aspx). The compiled code that is used in this example was provided by a developer willing to help. Inside the .dll that was provided to me is a WMI call that starts monitoring the processor utilization, waits 10 seconds, and then determines the average over that time period. The utility database can call this .dll by enabling CLR and then addressing the information by a user-created function. As complex as it sounds, the code is not too difficult to put into place.
The first step is to create the table that will store this information. The table format will match other Category 1 tables as a core part of the utility database, and the retention of the data matches that of other data that should be retained historically.
USE [dbUtilities]

GO


CREATE TABLE [dbo].[Processor_UTI](

    [ProcessorReadingID] [int] IDENTITY(1,1) NOT NULL,

    [ReadingDate] [datetime] NOT NULL,

    [ProcessorUTI] [int] NOT NULL,

CONSTRAINT [PK_Processor_UTI_ID] PRIMARY KEY CLUSTERED

([ProcessorReadingID])) ON [PRIMARY]

GO
Retrieving the information includes a number of steps that will adjust some of the server’s configuration settings. The first step to enable the processor utilization collection is to enable CLR on your server.
sp_configure 'show advanced options', 1;

RECONFIGURE

GO

sp_configure 'clr enabled', 1;

RECONFIGURE

GO
SQL Server needs to be instructed that the contents within the database are trustworthy. The altering of the trustworthy status needs to be done with elevated permissions on the SQL Server instance. This step is to validate that the code being called from inside the database is trusted by the administrators.
ALTER DATABASE dbUtilities SET TRUSTWORTHY ON;
Once the server has been configured to allow the external calls to the .dll, it is important to make sure that the .dll exists where SQL Server can access it. Copy the .dll to the directory.
![]() Note I tend to put the
Note I tend to put the .dll in directories where I store the data. This way, if the SQL Server is on a cluster, the .dll will be accessible on any node of the cluster.
SQL Server needs to register the location of the .dll. The create assembly statement addresses this need.
USE [dbUtilities]

GO


CREATE ASSEMBLY [dbUtilities.Database.CLRFunctions]

    FROM 'C:Datadbstats.Database.CLRFunctions .dll'

WITH PERMISSION_SET = UNSAFE

GO
SQL Server can execute the .dll through a function.
USE [dbUtilities]

GO


CREATE FUNCTION [dbo].[GetCPUUTI]()

    RETURNS [nchar](300) WITH EXECUTE AS CALLER

AS

EXTERNAL NAME [dbUtilities.Database.CLRFunctions].[UserDefinedFunctions].[GetCPUUTI]

GO
The final step is to create the stored procedure that the processes can use to retrieve the processor information to eventually store it.
USE [dbUtilities]

GO


CREATE PROCEDURE GetProcUTI

AS

Insert Into Processor_UTI (ReadingDate,ProcessorUTI)

    Select Getdate(),Isnull(Round(dbo.getCPUUTI(), 0),0)

GO
Error Logs
There are a number of messages, warnings, and errors that show up in the error log. Regular reviews of these errors are required to ensure that no critical health messages get missed. Automating and filtering the error log can help with avoiding critical messages. The nature of the data is at the core of SQL Server and is relevant to the current health. There is no need to store the data outside of the messages that have been reported on. Filtering the error log works on the Daily_Report table that has already been created.
USE [dbUtilities]

GO


CREATE PROCEDURE [dbo].[Get_Filtered_Error_Log]

AS

    DECLARE @Errorlog TABLE (LogDate datetime, ProcessorInfo VARCHAR

(100),ErrorMSG VARCHAR(2000))

        INSERT INTO @Errorlog

EXEC sp_executesql N'xp_readerrorlog'

DELETE

    FROM @Errorlog

    WHERE ErrorMSG LIKE '%Log was backed up%'

DELETE

    FROM @Errorlog

    WHERE ErrorMSG LIKE '%Setting database option COMPATIBILITY_LEVEL%'

DELETE

    FROM @Errorlog

    WHERE ErrorMSG LIKE '%were backed up%'

DELETE

    FROM @Errorlog

    WHERE ErrorMSG LIKE '%without errors%'
INSERT INTO dbUtilities.dbo.Daily_Report

    SELECT 'Error Log',Logdate,SUBSTRING(ErrorMSG, 1, 2000)

    FROM @Errorlog

    WHERE LogDate > DATEADD(dd, -1, GETDATE())

GO
The core of this stored procedure uses an extended stored procedure to load a temporary table with the data in the error log. Because we don’t want to review all the messages in the error log, and it is being used as a source review, messages of success and messages that have been identified as not needing review are then deleted from the temporary table. The data is then filtered for the last days’ worth of data, and then inserted into the Daily_Report table.
![]() Note It is important to keep the error log for an extended time frame. By default, a new error log is created only when the SQL Server service is started. Log files can be a little more difficult to navigate with SQL Servers that are not restarted very often. Consider using
Note It is important to keep the error log for an extended time frame. By default, a new error log is created only when the SQL Server service is started. Log files can be a little more difficult to navigate with SQL Servers that are not restarted very often. Consider using sp_Cycle_Errorlog to keep your error logs manageable.
Indexes
When tables have records inserted or updated, the indexes become fragmented. As a database administrator, part of your responsibilities will likely be ensuring that the database performs well. SQL Server 2012 offers maintenance plans where you can add reindexing; however, needs might exist that require you to create an indexing strategy outside of the maintenance plans.
![]() Note Different tables fragment at different rates; tables with many data changes fragment much quicker than tables with static data. This becomes important when the amount of data that is changing is critical, such as when you are using database mirroring over smaller bandwidth. As the index is rebuilt, the movement of the records becomes logged, and those transactions are pushed to the mirror. Why create unnecessary transactions and traffic when it might not be needed (such as when reindexing an index that doesn’t require it)?
Note Different tables fragment at different rates; tables with many data changes fragment much quicker than tables with static data. This becomes important when the amount of data that is changing is critical, such as when you are using database mirroring over smaller bandwidth. As the index is rebuilt, the movement of the records becomes logged, and those transactions are pushed to the mirror. Why create unnecessary transactions and traffic when it might not be needed (such as when reindexing an index that doesn’t require it)?
The table the utility database uses to keep track of index fragmentation has the following structure:
USE [dbUtilities]

GO


CREATE TABLE [dbo].[Index_Fragmentation](

    [IndexFragID] [int] IDENTITY(1,1) NOT NULL,

    [DatabaseName] [Sysname] NULL,

    [OBjectName] [Sysname] NULL,

    [IndexName] [Sysname] NULL,

    [Index_Type] [nvarchar](120) NULL,

    [Fragmentation] [float] NULL,

    [ReadingDate] [datetime] NULL,

 CONSTRAINT [PK_IndexFragID] PRIMARY KEY CLUSTERED

    ([IndexFragID]))

GO
Population of the Index_Fragmentation table is accomplished using the following stored procedure to query the sys.indexes table. The granularity in this example includes database, table, and index. With a few added lines, the procedure can be modified to look at partitions and all the databases on a server.
USE [dbUtilities]

GO


CREATE PROCEDURE Get_Index_Fragmentation

AS

DECLARE @objectID int

DECLARE @IndexID int

DECLARE @Index_Fragmentation TABLE ([DatabaseName] [Sysname], DB_ID int,

[OBjectName] [Sysname], ObjectID int, [IndexName] [Sysname], IndexId int,

[Index_Type] [nvarchar](120),[Fragmentation] [float])


INSERT INTO @Index_Fragmentation ([DatabaseName], [DB_ID], [OBjectName],

[ObjectID], [IndexName], [IndexId], [Index_Type])

    Select

        db_name(), db_ID(), object_schema_name(indexes.object_id) + '.' +

object_name(indexes.object_id),OBJECT_ID, indexes.name, indexes.index_id,

indexes.type_desc

    FROM sys.indexes

    Where object_schema_name(indexes.object_id) not like 'sys'


DECLARE Get_Frag CURSOR FOR SELECT ObjectID, IndexID FROM

@Index_Fragmentation;

Open Get_Frag

WHILE 1=1

BEGIN

    FETCH NEXT from Get_FRAG Into @OBJECTID, @INDEXID;

    IF @@FETCH_STATUS < 0 BREAK

    UPDATE @Index_Fragmentation

        SET Fragmentation = avg_fragmentation_in_percent

            from

sys.dm_db_index_physical_stats(db_id(),@ObjectID,@IndexID, null, null)

    WHERE ObjectID = @ObjectID and IndexId = @IndexID

END

CLOSE Get_Frag

DEALLOCATE Get_Frag


INSERT INTO Index_Fragmentation

        ([DatabaseName], [OBjectName], [IndexName], [Index_Type],

[Fragmentation], [ReadingDate])

    Select [DatabaseName], [OBjectName], [IndexName], [Index_Type],

[Fragmentation], GETDATE()

    From @Index_Fragmentation

GO
After your utility database has the index fragmentation stored, index maintenance can be very strategic. Code can be written that includes decision factors in rebuilding or defragmenting and index based on fragmentation.
Stored Procedure Performance
Tracking stored procedure performance can be critical in many complex environments. The flexibility of SQL Server and the demands on new features for applications that require database support can require hours of code reviews to validate performance before release. Often, this is not an option due to the time commitment; therefore, understanding the performance patterns on the stored procedures, historically, is critical.
USE [dbUtilities]

GO


CREATE TABLE [dbo].[Procedure_Execution_Times](

    [ProcExecutionReadingID] [int] IDENTITY(1,1) NOT NULL,

    [DatabaseName] [Sysname],

    [SPName] [Sysname] NULL,

    [ExeCount] [bigint] NULL,

    [ExePerSec] [bigint] NULL,

    [AvgWorkerTime] [bigint] NULL,

    [TotalWorkerTime] [bigint] NULL,

    [AvgElapsedTime] [bigint] NULL,

    [MaxLogicalReads] [bigint] NULL,

    [MaxLogicalWrites] [bigint] NULL,

    [TotalPhysicalReads] [bigint] NULL,

    [DateRecorded] [datetime] NULL,

 CONSTRAINT [PK_Procedure_Execution_Times_ID] PRIMARY KEY CLUSTERED

    ([ProcExecutionReadingID]))

GO
The stored procedure execution times can be retrieved by looking at the sys.dm_exec_query_stats DMV. When using a DMV as the source of statistics, it is important to understand the source of this information. With the sys.dm_exec_query_stats DMV, the data is based on the cache. When the execution plan is no longer in cache, the corresponding statistics are removed from the sys.dm_exec_query_stats DMV.
![]() Note I highly recommend looking at some of the other useful DMVs that Glenn Berry has on his blog at
Note I highly recommend looking at some of the other useful DMVs that Glenn Berry has on his blog at http://sqlserverperformance.wordpress.com.
USE [dbUtilities]

GO


CREATE PROCEDURE [dbo].[Get_Proc_Exection_Times]

AS

INSERT INTO dbUtilities..Procedure_Execution_Times

(DatabaseName,SPName, ExeCount, ExePerSec, AvgWorkerTime, TotalWorkerTime,

AvgElapsedTime, MaxLogicalReads, MaxLogicalWrites, TotalPhysicalReads,

DateRecorded)

SELECT

    DB_Name() AS dbname,

OBJECT_SCHEMA_NAME(qt.objectid, qt.dbid) + '.' + object_name(qt.objectid,

qt.dbid) AS spname,
    qs.execution_count AS 'Execution Count',

isnull(qs.execution_count,.0001)/Isnull(DATEDIFF(Second, qs.creation_time,

GetDate()),.0001) AS 'Calls/Second',

    isnull(qs.total_worker_time,1)/isnull(qs.execution_count,1) AS

'AvgWorkerTime',

    qs.total_worker_time AS 'TotalWorkerTime',

    isnull(qs.total_elapsed_time,1)/isnull(qs.execution_count,1) AS

'AvgElapsedTime',

    qs.max_logical_reads,

    qs.max_logical_writes,

    qs.total_physical_reads,

    GETDATE() AS RecordedDate

FROM sys.dm_exec_query_stats AS qs

        CROSS APPLY sys.dm_exec_sql_text(qs.sql_handle) AS qt

ORDER BY qs.execution_count DESC

GO
This information should help answer questions such as what stored procedure is executed the most often, and what stored procedures have the longest duration.
Failed Jobs
Keep track of failed jobs over the last 48 hours by querying the system tables in the msdb database and inserting the results into the Daily_Report table. Because this data is used as an overview and notification to the report viewer of potential problems, minimum data is stored and there is no historical use, in this context. The stored procedure can be altered to keep a longer, more detailed history if it is a requirement, and the history in the msdb database does not meet the requirements.
USE [dbUtilities]

GO


CREATE PROCEDURE Get_Failed_Jobs

AS

INSERT INTO Daily_Report

(EventStatus, EventDate, Event)

    SELECT

    'Job Failed',

    msdb.dbo.agent_datetime(sjh.run_date, sjh.run_time),

    'SQL Server Job Failed ' + Name

    FROM msdb..sysjobs sj

        Join msdb..sysjobhistory sjh

            on sj.job_id = sjh.job_id and sjh.run_status = 0

    WHERE Enabled = 1 and step_id = 0

    AND msdb.dbo.agent_datetime(sjh.run_date, sjh.run_time) > Dateadd(dd,

-2,GetDate())

GO
![]() Note You can modify the option for keeping longer history on SQL Server 2012 job and task history by adjusting the job history properties in the SQL Server Agent properties.
Note You can modify the option for keeping longer history on SQL Server 2012 job and task history by adjusting the job history properties in the SQL Server Agent properties.
The visibility of information that SQL Server 2012 provides helps you get the important information required to manage the servers and databases. Up to this point, the examples have been focused on the core installation of SQL Server, so all the tables and stored procedures have been created in the dbo schema. In the next section, the examples focus on feature-specific counters. In your environment, you may use all, some, or none of the features. These examples use a different schema for each feature to help with the deployment of the code based on used features. I would recommend you consider using a like method to organize the information you are collecting.
Reporting Services
SQL Server Reporting Services (SSRS) has made report authoring and deployment easy and common. Yet, a thorough understanding of how Reporting Services is used is not as common. With a few simple steps, question such as what is the most common report, what is the longest running report, and what step of building the report takes the most time can be answered with confidence.
![]() Note Recently, I received a call that the reports were not performing well. After a few quick queries, I was able to isolate what reports were having issues, and was able to determine that the performance degradation was on the Reporting Services machine with the rendering time, rather than the database server and the data retrieval time. Having this information allowed me to focus my work where it could make the largest impact.
Note Recently, I received a call that the reports were not performing well. After a few quick queries, I was able to isolate what reports were having issues, and was able to determine that the performance degradation was on the Reporting Services machine with the rendering time, rather than the database server and the data retrieval time. Having this information allowed me to focus my work where it could make the largest impact.
SQL Server Reporting Services uses two databases for the operations of reporting services. One of the two databases is used for storing temporary data (ReportServerTempDB), and the other database stores the report definitions (ReportServer). There are a number of tables and views inside the ReportServer database that contain information you might want to consider reviewing; however, there is one key view that contains some key information about your Reporting Services install and how it is being used. (This view only exists in SQL Server 2012, when reporting services is installed. If an older version of SQL Server Reporting Services has been installed, use the ExecutionLog 2 view, and alter the stored procedure.)
Reporting Services is not installed with the basic installation. Because this is an added feature, I created a new schema for the feature. In this case, I used the schema name rpt.
USE [dbUtilities]

GO


CREATE SCHEMA rpt

GO
After the schema is created, adding the stored procedure is done in the same prior method.
CREATE PROCEDURE [rpt].[Get_Report_Stats]

AS

DECLARE @Last24hours int

DECLARE @Reports TABLE (ItemPath VARCHAR(1000), UserName VARCHAR(100),

ReportExecution int)


SET @Last24hours = (SELECT COUNT(*) FROM ReportServer..ExecutionLog3

                           WHERE TimeStart > DATEADD(dd, -1, GETDATE()))


INSERT INTO @Reports

        (ItemPath, UserName, ReportExecution)

            SELECT TOP 10
                ItemPath,

                UserName,

                COUNT(*) AS 'ReportExecution' FROM

ReportServer..ExecutionLog3

            WHERE TimeStart > DATEADD(dd, -1, GETDATE())

            GROUP BY ItemPath, UserName

            ORDER BY COUNT(*) DESC


INSERT INTO [dbo].[Daily_Report]

      (EventStatus, EventDate, EVENT )

            SELECT 'Total Reports', GETDATE(), 'Total number of Reports

Executed ' + CONVERT(VARCHAR(10), @Last24hours)


INSERT INTO [dbo].[Daily_Report]

      (EventStatus, EventDate, EVENT )

            SELECT 'Top Reports', GETDATE(), ItemPath + ' ' + UserName + '

' + CONVERT(VARCHAR(10),ReportExecution)

            FROM @Reports

            ORDER BY ReportExecution DESC

GO
Mirroring
Database mirroring is a high-availability feature introduced in SQL Server 2005. This feature enables a database to be mirrored to a second database on another instance of SQL Server. This mirrored database can take over as the primary source of the data if a situation arises. When mirroring is configured, you have the option of using a witness server to help in the decision as to what database should be running as the principal. If a witness server is not used, a manual failover is required. Mirroring is easy to configure and easy to failover; however, if there are objects (e.g., user accounts or jobs) outside of the database that the database requires to be operational, a few extra steps are required.
Knowing what database is acting as the current primary is critical information. In addition, the value of knowing what server was acting as the principal host historically can be a key piece of information when troubleshooting. In similar fashion as the SQL Server Reporting Services data, I recommend a schema just for the mirroring objects.
USE [dbUtilities]

GO


CREATE SCHEMA Mir

GO
For the historical data, a table will be created to store our log information. A default is assigned on the ReadingDate column for a point in reference as to when a failover may have occurred. However the value is dependent on when the row was inserted; therefore, if the status is to be checked only once every ten minutes, the date could be off by almost ten minutes.
CREATE TABLE [Mir].[MirrorLogging](

    [MirrorLoggingID] [int] IDENTITY(1,1) NOT NULL,

    [HostName] [sysname] NOT NULL,

    [DatabaseName] [sysname] NOT NULL,

    [MirrorDescription] [varchar](10) NOT NULL,
    [ReadingDate] [datetime] DEFAULT getdate() NULL,

CONSTRAINT [PK_MirrorLoggingID] PRIMARY KEY CLUSTERED

([MirrorLoggingID]))

GO
If you want to use the mirror logging table as a source of notification for when the database mirroring state changes, consider using a trigger or tying into the following stored procedure to send you an e-mail message when the state changes.
CREATE PROCEDURE Mir.Log_Mirroring_Status

AS

Set NOCOUNT ON

DECLARE @HostName SYSNAME

DECLARE @dbname SYSNAME

DECLARE @MirDesc VARCHAR(10)

DECLARE @CurrentStatusID INT

DECLARE dbname CURSOR FAST_FORWARD FOR

    SELECT

        CAST(SERVERPROPERTY ('MachineName') AS SYSNAME),

        DB_NAME(database_id),

        Mirroring_Role_Desc

    FROM sys.database_mirroring

            WHERE mirroring_state is not null

OPEN dbname

WHILE 1=1

BEGIN

    FETCH NEXT from dbname Into @hostname, @dbname, @MirDesc;

    IF @@FETCH_STATUS < 0 BREAK

-- Valdiate a record is there for the database, If not insert it.

If Not Exists (Select HostName, DatabaseName From Mir.MirrorLogging

            WHERE HostName like @HostName

            AND DatabaseName like @dbname)

    Begin

        Insert Mir.MirrorLogging (HostName, DatabaseName,

MirrorDescription)

        VALUES (@HostName, @dbname, @MirDesc)

    END

-- Find the most recent status, if the status has changed

-- Insert a new entry

SET @CurrentStatusID = (Select Max(MirrorLoggingID) From Mir.MirrorLogging

            WHERE HostName like @HostName

            AND DatabaseName like @dbname)

IF @MirDesc not like (Select MirrorDescription from Mir.MirrorLogging

            WHERE MirrorLoggingID = @CurrentStatusID)        BEGIN

        Insert Mir.MirrorLogging (HostName, DatabaseName,

MirrorDescription)

        VALUES (@HostName, @dbname, @MirDesc)

        END

END

CLOSE dbname

DEALLOCATE dbname
GO
AlwaysOn
The AlwaysOn feature set is new with SQL Server 2012, and is the next generation of database mirroring in combination with Windows clustering. A difficult and expensive aspect of Windows clustering has always been clustering machines that are not physically near each other. With database mirroring, the mirror is not easily readable for applications unless the mirror is using database snapshots. AlwaysOn allows the SQL Server to have multiple databases online and readable, while providing the functionality of the automated failover.
Monitoring and historical tracking of AlwaysOn can be accomplished in a very similar fashion as monitoring and historical tracking of database mirroring. By using the SERVERPROPERTY functions, you are able to get facts such as server names, database names, availability groups, and other key pieces of information. Additional views and functions have been added in SQL Server 2012 to assist in reaching valuable information. When implementing AlwaysOn, review the monitoring and historical tracking to ensure you are getting the information you need. The following is a short list of just a few of these objects:
sys.availability_groupssys.availability_group_clustersys.dm_hadr_availability_group_statesys.dm_hadr_database_replica_statessys.availability_replicassys.fn_hadr_backup_is_preferred_replica
Managing Key Business Indicators
The previous example case used to explain a Key Business Indicator (KBI) was that of a 911 service for the local town. If the call status is logged, and is important to the functions of the business that supplies the 911 server, the number of calls in a specific status could not only be a business performance indicator, but also a way to determine whether the business needs to make adjustments for critical times.
It is critical to gather historic trends and behaviors of the business data flow. This data is based on a design internal to databases that have been created after the install, and is not directly related to the installation of SQL Server as a feature. This data can also be used as a critical performance counter that can be acted upon; for example, if there was an emergency of some sort in an otherwise slow period of business, messages and warnings could be sent out to the organization informing them of the increase of 911 calls. As an example, assume there is a database named emergencyservice on the server. The table that tracks the phone queue might look similar to this:
USE [dbUtilities]

GO


CREATE TABLE CallStatus(

CallStatusID int identity(1,1) not null,

CallID int Not null,

CallStatus varchar(15) Not Null,

StatusChangeDateTime datetime Not Null,

CONSTRAINT [PK_CallStatusID] PRIMARY KEY CLUSTERED
([CallStatusID]))

GO
For example purposes, assume there is a foreign key pointed over to a Call table. Each call that comes into the 911 service had a header record created in the Call table, and then a record in the CallStatus table. Each call should have multiple call status records, which indicate when a call has entered into a new status. For instance, when a call first comes into the system, but has not yet been answered, the status may be “initial call.” When it is answered, a new status record would be inserted with a CallStatus of “call answered.” There are many call status options, such as hold, waiting police, waiting fire, lost, and closed. After a call has been marked in the closed status, it might be a short period of time before the data is archived out of the CallStatus table.
Even with few columns in the CallStatus table, many KBIs can be tracked. For example, you could track the amount of time the caller is waiting for the police, the average total length of calls, or the percent of calls that are lost. An important KBI for the 911 service company might be the number of calls that are lost. All the data with this KBI is directly related to the individual company, so use a new schema in the dbUtilities database to indicate it as such.
USE [dbUtilities]

GO


CREATE SCHEMA ES

GO
The table creation is similar to the other tables that we have created.
CREATE TABLE ES.LostCall

(

LostCallID int identity(1,1) not null,

AvgLostCall_ByHour int not null,

ReadingDate DateTime not null,

CONSTRAINT [PK_LostCallID] PRIMARY KEY CLUSTERED

([LostCallID])

)
The historical data can be tracked for this in your utility database, with a stored procedure, like so:
CREATE PROCEDURE ES.Log_LostCallCount

AS

Insert Into ES.Log_LostCall (AvgLostCall_ByHour)

Select COUNT(CALLStatusID) from Emergencyservice..CALLStatus

WHERE Callstatus like 'lost'

AND StatusChangeDateTime > DATEADD(hour, -1, GETDATE())

GO
Each business is different, and understanding what is important to an organization is critical. A database professional that can help an organization get to pertinent information can dramatically improve his or her visibility within that organization. Often, when database administrators are doing job tasks well, their visibility is not as great; however, when the database administrators are not completing essential tasks, their visibility is achived, but in a negative light.
Using the Data
Once the methods for collection and storing the data have been created, collection and reporting on the data completes the development cycle of your utility database. Monitoring the data can be automated, as well, by configuring alerts, triggers, and creating a SQL mail profile.
Automating the Data Collection
The primary use of the utility database is to gather and store information on a consistent schedule, to determine the health and history of the SQL Server and databases located on the SQL Server. Collection data on a schedule makes automation easy. The first step in automating all the data collection points is to identify what collection points need to be collected, how often they should be collected, and when this collection should occur. If you use the stored procedures created during the examples of this chapter, you can isolate a few data points to collect each day.
Get_Drive_Space_FreeGet_Failed_JobsGet_File_GrowthGet_Filtered_Error_LogGet_Index_Fragmentation
A stored procedure can be created to execute each one of these stored procedures by nesting the individual executions. The calling stored procedure should be named something obvious that indicates the frequency of the collection.
USE [dbUtilities]

GO


CREATE PROCEDURE Daily_Data_Collection

AS

SET NOCOUNT on

-- Maintenance Work--

INSERT INTO [dbo].[Daily_Report_Archive]

    SELECT * FROM [dbo].[Daily_Report]

DELETE Daily_Report

-- Disk Space--

EXECUTE Get_Drive_Space_Free

EXECUTE Get_File_Growth

--Read Error Log--

EXECUTE Get_Filtered_Error_Log

--Get Failed Jobs --

EXECUTE Get_Failed_Jobs

--Get Index Frag --

EXECUTE Get_Index_Fragmentation

--Get Procedure Execution --

EXECUTE Get_Proc_Exection_Times

GO
The following are some notable items to consider:
- Error Handling—For space considerations, the error handling lines on the code has been removed.
- Archive—The
Maintenance Worksection of code clears theDaily_Reporttable after the data has been archived. If the examples are followed, the report wizard in Visual Studio 2010 is an easy way to build a report that can be subscribed to.
Scheduling the Data Collection
To schedule the data collection, create a new SQL Server Agent job. After the job has been named and a description added, add a new task. For the command portion of the task, execute the calling stored procedure created in the previous example (see Figure 6-2).
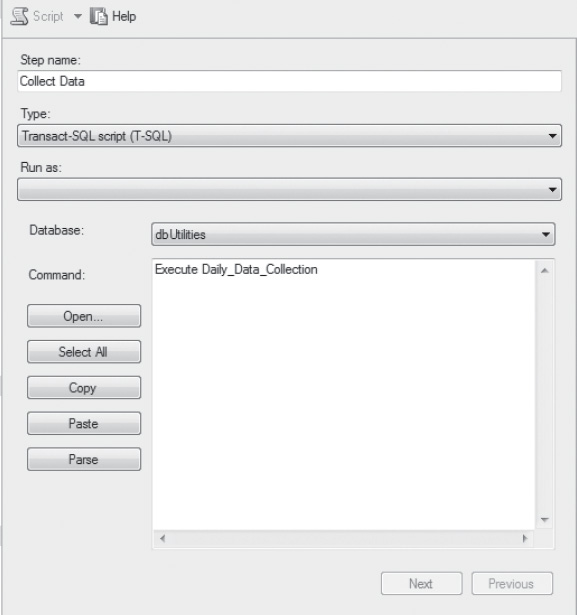
Figure 6-2. Creating the job task
The last step to automating the data collection is to schedule the job. The code in the examples has been created with the intention that the majority of the data collection steps would execute once a day. The scheduling of the job for once a day is a natural fit, but not required; however, note that some of the stored procedures might need to be altered.
Conclusion
We have focused on how to organize the data storage, different ways to retrieve your important data, and scheduling the collection of information. After you have started getting some data collected into your utility database, you should soon start seeing the benefits. The next steps to expand the usefulness of the utility database include the following:
- Use Visual Studio to build a report that can be deployed and subscribed to. This simple step-by-step wizard adds quite a bit to your custom utility database.
- Deploy your utility database to all the SQL Servers in your domain. With a few modifications to tables and stored procedures, tracking server names or instance names is an easy code change. With linked servers, SSIS or PowerShell data can be collected and centralized with little additional effort.
- Add additional counters by using the techniques discussed. At the time of authoring, I am working on reviewing server inventory tracking that was implemented by a friend of mine.
- Consider using PowerShell to deploy your utility database; the larger your environment, the more helpful this is.
- Most important, don’t forget to back up your database. After putting all this effort into getting the data, make sure you keep your data.
If all of this information or code development appears overwhelming, start small. Add the dbUtilities database to you server, then add one counter. The database growth counter is a good one to start with because the value of the historical data is high, yet the complexity to add it is not.