CHAPTER 14
![]()
Page and Row Compression
The first question that needs to be answered about page and row compression is the most important. Why should you use it? After all, hard-drive disks are cheap, right?
You hear that all the time—disks are cheap, or storage is cheap. It certainly isn’t as expensive as it was 10 years ago. You can walk down to your nearest retailer on Black Friday, an American Shopping holiday, and purchase a 2-terabyte (TB) hard drive for under $100. In some cases, you can find solid-state disks of the same size for a little more. I would wager a guess that you do not go out and buy the hard drives for your production servers on Black Friday, or any other shopping holiday. Even if you did, these disks are not designed to work in storage area network (SAN), devices. When you purchase a SAN, you’re typically looking at an expense of thousands of dollars. If you have multiple SANs, you might have a SAN administrator or two. Before you know it, those disks start to add up.
Then you have the databases you manage. You probably don’t manage just one database or one SQL instance. You might have the same database in Production, Staging or QA, or Development, or you might have a Continuation of Operations Planning/Disaster Recovery (COOP/DR) server. Administrators often strive to eliminate data duplication within a database, but it is a necessary part of proper content management to have duplicated copies of data in multiple environments. When you start thinking about all of that data for all of the many systems you manage, you quickly see how compression can save you space—not just on a single table in a single database, but across your entire corporate SQL Server enterprise.
Space savings in your database are just one reason to consider using page and row compression. You also reduce the memory footprint required for you database, the logical IOs from queries, your backup size, and your backup time.
![]() TIP I cannot tell you how many times I give a presentation on compression and afterwards someone says something along the lines of, “Is it bad if I compress my entire database?”.
TIP I cannot tell you how many times I give a presentation on compression and afterwards someone says something along the lines of, “Is it bad if I compress my entire database?”.
Yes, Dear Reader, it is. However, I like to reply with a question and ask if they would compress their entire C: drive on their laptop? Sure it will save you space, but unless you’re on a powerful computer it will drag down your whole operating system, because you’re performing compression operations on all data regardless of whether it is suited for compression or not.
Similarly, you don’t want to compress the entire contents of a database unless that data is compatible with compression. The cost of compression is additional CPU cycles and most servers have cycles to spare, but you don’t want to waste them needlessly. Rarely will you find a database where compressing every single table is a good idea. 99.99 percent of databases should not be fully compressed. You might be in the 00.01 percent, but I wouldn’t bet on it. Wasting CPU cycles can cause scalability issues for your database at a future date.
As we will discuss, there are certain specific things you can do to find what you should and should not compress in your database.
Before You Get Started
Before you can begin enabling page and row compression, there are a couple of basic considerations to think about. First you need to use an edition of SQL Server 2012 that supports page and row compression, and you need to ensure that you will not need to restore that database on a lower version, such as Microsoft SQL Server 2012 Standard Edition. Once the basic compatibility issue is out of the way, you also need to consider exactly what data to compress and how to do it.
Most importantly: Know Thy Data! Knowledge of the data types that are used on tables, and the type of data that is stored within them, can make a big difference in determining what you should compress.
Editions and Support
Compression is an enterprise-level feature. This means that you must be using SQL Server 2012 Enterprise Edition or Developer Edition for page and row compression to be available to you. This also means that if you enable compression on an Enterprise Edition SQL instance and try to restore that database to a standard-level instance, it will fail.
Figure 14-1. You can use DMV sys.dm_persisted_sku_features to find what Enterprise Edition features are enabled on your database.
If you need to move an Enterprise Edition database to a lower edition, you can run the following query to see if there are any Enterprise Edition features currently enabled on the database.
    SELECT

        feature_name

            ,feature_id

    FROM

        sys.dm_db_persisted_sku_features;
Running this will not only tell you if compression is enabled, but it will inform you of any other Enterprise Edition feature that is enabled, as you can see from Figure 14-1.
What to Compress and How to Compress It
So what can you compress inside of your database? You can compress heaps (base tables without a clustered index), clustered indexes (base tables ordered by a clustered index), nonclustered indexes, and objects by partition.
You might be wondering what I mean by “objects by partition” This means that if you have a table that uses multiple table partitions, you can compress each partition using a different level of compression: Page, Row, or None. In addition, if you have a partitioned nonclustered index, you can also compress each partition using a different level of compression. See Figure 14-2 for more details.
Figure 14-2. You can compress your partitioned tables differently by partition. You can also compress partitioned nonclustered indexes by partition as well.
So you can compress heaps, clustered indexes, nonclustered indexes, and objects by partition, but how do you compress them? There are two different ways to apply compression. First, you can specify the level of compression you want to use upon creation of the object. Second, you can rebuild a heap, clustered index, or nonclustered index and specify the level of compression you want to use. The ability to rebuild a heap was first introduced in SQL Server 2008. The concept is the same as rebuilding an index. When a heap is rebuilt, the structure is completely re-created on new data pages. While this occurs, any fragmentation or forwarding pointers caused by inserts, updates, or deletes is eliminated, and the specified compression level is fully applied.
ALTER TABLE dbo.heap

REBUILD WITH(data_compression=Page)

GO
Once an object is rebuilt using compression, the compression-level selection is inherited in any future rebuild operation. The only time the compression level changes is when you specify a new compression level in a rebuild command. From then on, that new setting will be inherited.
There are three different levels of compression: Page, Row, and None. None is the regular noncompressed format that you are used to using every day. But it is important to know that if you can compress your data, you can uncompress it as well. As far as page and row compression is concerned, let’s dive a little deeper.
Row Compression
We’ll start our dive into data compression with row compression. Row compression is the lowest level of compression that will be applied to a SQL Server table, regardless of the compression level specified. Later, when I discuss page compression, I’ll detail how it is a superset of row compression.
When I think about compression, I find it helps to think of the hierarchy in which data is stored inside of SQL Server as a map of a shopping mall. (For a full hierarchy, see Figure 14-3.) When you go to a mall, you see a lot of little signs that read “You Are Here.” Compression directly affects the way that data is stored, and to understand it you need to start at the bottom and work your way up. Row compression affects the way that data is stored at the Record level. At the very bottom of the hierarchy are records—specifically, data records.
Figure 14-3. Compression affects the way data is stored on disk. Row compression specifically alters the way data is stored at the record level.
To help you understand what happens when changes are made to a data record, I’ll start by examining a regular record. First I’ll make a database and a table so that I can create a data record and insert a record:
IF EXISTS(SELECT NAME FROM SYS.DATABASES WHERE NAME='demoInternals'

)

BEGIN
    DROP DATABASE demoInternals

END

GO

USE master

GO

CREATE DATABASE demoInternals

GO

USE demoInternals

GO

IF EXISTS(SELECT NAME FROM sys.tables WHERE NAME='dataRecord')

BEGIN

    DROP TABLE dataRecord

END

GO

CREATE TABLE dataRecord

            (myID INT

            ,myfixedData CHAR(4)

            ,myVarData1 VARCHAR(6)

            ,myVarData2 VARCHAR(9)

            ,myVarData3 VARCHAR(6)

            )


GO

INSERT INTO dataRecord(myID, myfixedData, myVarData1, myVarData2, myVarData3)

VALUES (7, 'XXXX', 'SSS', 'WWWWWWWWW', 'BB')

GO
A regular data record is made up of tag bytes, the NULL bitmap offset, the fixed data portion of the record, the NULL bitmap, the variable offset array, the variable array, and special information (used for the snapshot isolation level or forwarding pointers in heaps). I will now use the undocumented commands DBCC IND and DBCC PAGE to peek underneath the covers and see the data record on disk. (See Figure 14-4.)
DBCC IND(demoInternals, 'dataRecord', 1)

GO

--*Note your Page IDs may vary from mine

--We want to get the Page Number which

--has the column value of PageType  =1

Figure 14-4. Output of DBCC IND.
As you can see from Figure 14-4, two rows have been returned. We want to look at the data record. If you look at the PageType column, you’ll see one row has a value of 10 and the other has a value of 1. Value 10 is an allocation page. Whenever a table is created, it receives an allocation page, and this is that page for our table, while value 1 indicates a data page. If you then look at column PagePID for the row that has a PageType value of 1, you see the data record is found on page 276. Now set Trace Flag 3604 to ON to send the output of DBCC Page to the SQL Server Management Studio, SSMS, window. If you don’t enable Trace Flag 3604, you get only the message “Command completed successfully” and no additional output. Next I’ll use DBCC Page to view the record. The output of DBCC Page will give us a lot of metadata. I strip that down just to the data that is relevant for us to examine the data record. See Figure 14-5 to see the data record output of DBCC Page.
DBCC TRACEON(3604)

GO

DBCC PAGE('demoInternals', 1, 276, 1)

GO
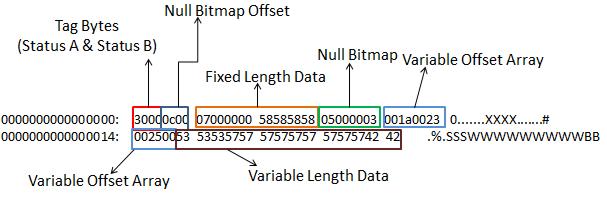
Figure 14-5. Full output of an internal data record.
In a normal data record, you have tag bytes, a NULL bitmap offset, fixed-length data, the NULL bitmap, our variable offset array, and our variable length data.
SQL Server has five transaction isolation levels: Read Committed, Read Uncommitted, Repeatable Read, Snapshot, and Serializable. The default transaction isolation level for SQL Server is Read Committed. If you use Read Uncommitted or Snapshot, you enable versioning on your data records. A full discussion of transaction isolation levels is beyond the scope of this chapter; see Microsoft Books Online to read more on transaction isolation levels at http://msdn.microsoft.com/en-us/library/ms173763.aspx.
If you have Snapshot or Read Uncommitted isolation level turned on or are using any feature that uses the Snapshot isolation level, such as Online Index or Table Rebuilds, you’ll have an additional portion that contains a date timestamp of when the record was last changed.
Row compression works on the fixed-length data types in the data record. What are fixed-length data types? Anything that is decimal, numeric, smallint, int, bigint, bit, smallmoney, money, float, real, datetime, datetime2, datetimeoffset, char, binary, timestamp/rowversion, nchar, nvarchar, and introduced in SQL 2012 for the first time, Spatial Data Types Geometry and Geography.
So how does it work? Row compression stores fixed-length data that contains variable-length data as variable-length data. That’s a bit of a tongue twister, but let me explain. If I took a Char(50) field and put in the value “Bradley Ball,” I would be using only 12 bytes out of 50. A regular data record wastes those 38 bytes. Row compression stores just the 12 bytes. If I had a datetime field—normally, 8 bytes—and inserted the value “1/25/1977,” a compressed record would store that as a 4-byte field, giving us 4 bytes of savings. Our variable-length identifiers, the variable offset array, are reduced from 4 bytes to 4 bits each. There is also special handling for NULL values and zeros, which reduces storage from bytes to bits.
Now that you’ve looked at a normal data record and read about the changes row compression will make, try compressing the record. After you rebuild the table, you need to use DBCC IND to get the data page again (as you can see in Figure 14-6), because the rebuild operation creates a new page with a new page number.
ALTER TABLE dataRecord

REBUILD WITH (DATA_COMPRESSION=ROW)

GO

DBCC IND(demoInternals, 'dataRecord',  1)

GO

Figure 14-6. Output of DBCC IND.
Now use DBCC Page to get the Row Compressed record. The results are shown in Figure 14-7. Once again, I strip out the metadata details and list only the data record, but as you examine the output of DBCC Page, you’ll see that the record type is now listed as compressed.
DBCC PAGE('demoInternals', 1, 320, 1)

GO
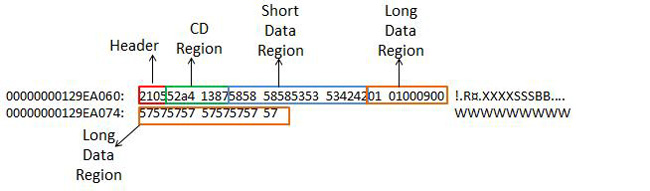
Figure 14-7. Row-compressed data record.
Now that the record is row-compressed, you can see that the structure of the record has changed quite a bit. You have a header, CD region, a short data region that stores all data shorter than 9 bytes, and a long data region with all data that is 9 bytes and longer. Once again, if you had the Snapshot isolation level turned on or if you had a forwarding pointer from a heap, they would be at the end of the record in an area called Special Information.
It is important to understand row compression because it is the default level of compression that will be applied when compression is turned on. Furthermore, index pages beyond the leaf level will only be row-compressed even if you’re using Page-level compression.
Page Compression
The next step on our tour of SQL compression internals is page compression, as shown in Figure 14-8.
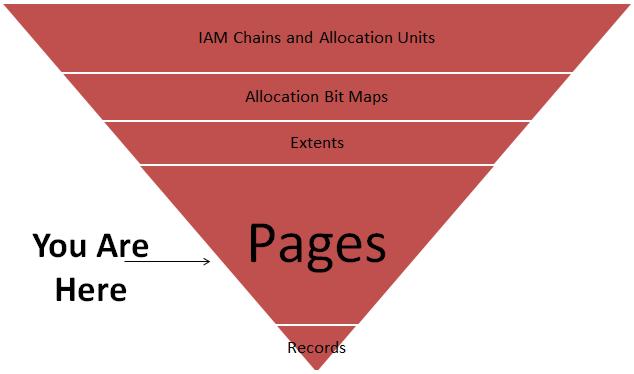
Figure 14-8. Page compression rearranges structures at the page level.
Page compression is a superset of row compression. As I mentioned before, at the lowest level once compression is turned on, everything is at least row compressed. Page compression contains row compression, column prefix compression, and page dictionary compression. Page compression is always applied in the order of row, column, and then dictionary. Note that you can specify only row and page compression settings on a database object. Column prefix and page dictionary compression are internal subsets of page compression. You cannot specify which portions of page compression to use—SQL Server makes that determination internally. To help you fully understand page compression, I need to cover each step that occurs when it is applied, which I will do shortly. First I’ll create a table I can use to demonstrate the power of page compression.
USE demoInternals;

GO


/*

Let's create a Clustered Index

*/

IF EXISTS(SELECT NAME FROM sys.tables WHERE name=N'compressedDataRecord')

BEGIN

    DROP TABLE dbo.compressedDataRecord

END

CREATE TABLE compressedDataRecord(

    myID INT IDENTITY(1,1)

    ,productName char(500) DEFAULT 'some product'

    ,productDescription CHAR(1000) DEFAULT 'Product Description'

    ,PRIMARY KEY CLUSTERED(myID)

) ;

/*

Let's insert some data

*/

DECLARE @i INT, @myID INT

SET @i=0

WHILE (@i<383)

BEGIN

        SET @myID=(SELECT (MAX(myid)+1) FROM dbo.compressedDataRecord)
        INSERT INTO dbo.compressedDataRecord(productName, productDescription)

        VALUES(

    (REPLICATE('a', (500- LEN(@myID))) + CAST(@myID AS VARCHAR(3)))

    (REPLICATE('b', (1000- LEN(@myID))) + CAST(@myID AS VARCHAR(3)))

            )

    SET @i=@i+1

END
When we looked at row compression, it was important to look at one data row and see the changes. Page compression requires an understanding of not just the changes to the data page, explained shortly, but an understanding of how data storage changes. When you used the preceding script to insert data, you’re taking fixed-length data fields and stretching them to the point that row compression can save you little to no storage space. You’re packing these fields as full as you can. If you use DBCC IND to get a page count, you’ll see that you’re currently storing data on 79 different pages. Subtract the PageType 10 allocation page and the PageType 2 index page and you’re at 77 total pages for the table:
DBCC IND(demoInternals, 'compressedDataRecord', 1)

GO
So now let’s apply page compression, perform another DBCC IND, and see how this changes our storage structure:
/*

Rebuild our table applying Page Compression

*/

ALTER TABLE dbo.compressedDataRecord

REBUILD WITH (DATA_COMPRESSION=Page)

GO

DBCC IND(demoInternals, 'compressedDataRecord', 1)

GO
After running the commands, you should find that you now have only two data pages on disk. The PageType 10 allocation page and the PageType1 data page are all that is left. You just reduced 77 pages to 1. These results are not typical; you’re working with a data set that is optimized to display the power that page compression can potentially have on your data.
When I discussed row compression, I talked about how it worked only on fixed-length data types. Page compression occurs at the binary level across the entire data page, so it is data-type agnostic. Meaning, simply, that if your data is in an IN_ROW_DATA page, it can be page-compressed. I’ll say more about that a little later when I discuss allocation units.
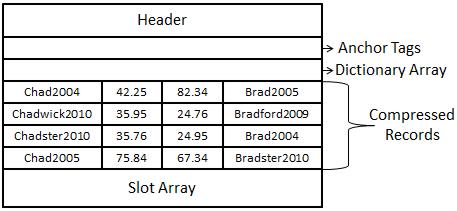
Figure 14-9. Page compression starts with a page being row-compressed.
So let’s walk through how data is compressed at the page level. I find that it is easier to explain at a text level instead of at a binary level. The important thing to take away is an understanding of the difference of the structures between a regular data page and a compressed data page. When you look at Figure 14-9, you’ll see a regular row-compressed data page. At this point, you can assume that row compression has been applied and all of the extra space has been removed from the records. You’ll see boxes for anchor tags and the dictionary array, and I’ll discuss these as we apply column prefix and dictionary compression, respectively.
Now if you look at Figure 14-10, you see a page that has had column prefix compression applied. The way that it works is it goes through each row at a record level and finds the common prefix values. For column one, you can see the values Chad2004, Chadwick2010, Chadster2010, and Chad2005. The common prefix in each column is (Chad). Column prefix compression takes the longest value with the matching pattern, (Chad), and places it in the anchor tag—in this case, Chadwick2010.
A special 2-bit value, symbolized by a NULL, takes the place of Chadwick2010, on Row 1 Column 2 of Figure 14-10. In that portion of the record, the NULL points to the anchor tag as the home of the data for that column. All the remaining rows are also altered, putting a numeric value in place to symbolize the number of characters to be read from the anchor tag to be applied to all of the other records in that column in order to be properly read, as shown in Figure 14-10.
If you look at the other columns, you can begin to see the matching patterns. In Column 2, the only values that match are 35.95 and 35.76. The common pattern is (35.), so 35.95 is placed in the anchor tag and the values in that column are replaced. There are two records in that column that do not have any values matching (35.): 42.25 and 75.84. These columns will still get a value placed before them—in this case, a zero—which tells the read process that it does not need to go to the anchor tag to retrieve any data for this row.
The same logic that applied to Column 2 is now applied to Column 3, with the matching value being (24.). Column 4 receives the same logic that was used on Column 1 with the matching value being (Brad).
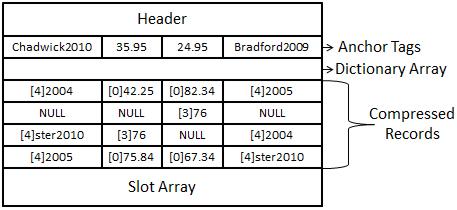
Figure 14-10. A page-compressed record with column prefix compression applied.
Now that row and column prefix compression have been applied, it is finally time for dictionary compression. Figure 14-11 shows a page that is fully compressed, having had dictionary compression applied.
Dictionary compression populates a dictionary array at the top of the page. The dictionary array is a 0-based multidimensional array. It will look across the entire page to find matching binary patterns and place them in the dictionary array. When you look across the page, the first two common values you come across are [4]2004 in Row 1 Column 1 and Row 3 Column 4. Each value will be replaced with a 0 (zero) pointing to the array position in the dictionary array.
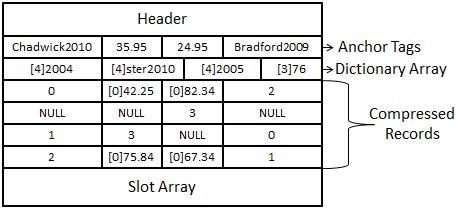
Figure 14-11. A page fully compressed, with dictionary compression applied.
The next value encountered is [4]Ster2010 in Row 3 Column 1 and Row 4 Column 4 for array position 1. Then the value [4]2005 from Row 4 Column 1, and Row 1 Column 4 will be replaced by array position 2. Finally [3]76, from Row 3 Column 2 and Row 2 Column 3 will be replaced by array position 3.
When you look at the contents of a regular data page compared to a compressed data page, you can see that the contents are wildly different. So different that you might wonder between SQL Server 2005 and SQL Server 2008, where compression was first introduced, how Microsoft developers had time to make the Relational Engine read from two different sets of pages. The answer is they didn’t.
When page or row compression is turned on, the data is stored on disk in a compressed format, and it is read into memory in a compressed format. However, when it is read out from memory from the buffer pool before the access methods return the data to the relational engine, the compressed data is rewritten in an uncompressed format. The uncompressed pages are not stored in memory. The pages are translated at the cost of CPU operations. To examine this more closely, take a look at Figure 14-12 to see how a select operation works in SQL Server against a compressed table.
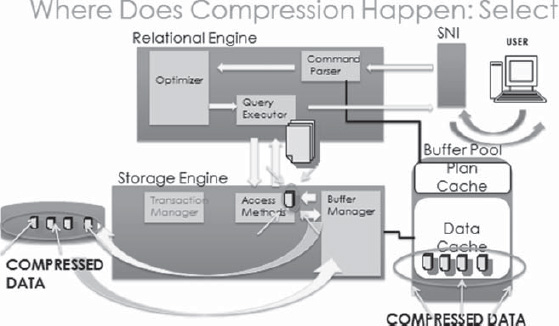
Figure 14-12. Data is compressed on disk and read into memory in the Pool compressed; only when it leaves the Storage Engine for the Relational Engine is it uncompressed.
When a query initially comes from the user, it connects through the SQL Network Interface (SNI), which translates the data to a Tabular Data Stream protocol that is proprietary to Microsoft. The query then reaches the Command Parser. You have interacted with the Pommand parser if you’ve ever received an error on a query where the syntax is not correct. SQL Server checks to see if the query has a cached plan so that it can skip optimization; in our case, it does not, and the query is handed to the optimizer. After a plan is created for retrieving the data, the query goes to the Query Executor. The Query Executor asks the access methods for a copy of the data needed to satisfy the query and hands it the direction to go to find the data. The access methods ask for the required pages from the buffer manager, which checks the data cache to see if the pages are there. The pages for our query are not, so the buffer manager retrieves them from disk, in a compressed format, and reads them into memory in the data cache in a compressed format. The buffer manager then gives the required pages to the access methods. The access methods translate page-compressed pages to an uncompressed format. Row-compressed pages are uncompressed by a “landing pad” in the Relational Engine block of code before being handed back to the Query Executor. The Query Executor sends the data back through the SNI, which translates it for the client.
This is an oversimplification of the process. Weeks and months of courses are taught on the specific internal components of the Relational and Storage engines. The important information here is data is compressed on disk and in memory. So you receive space-savings benefits in both locations.
The amount of CPU overhead is directly related to the level of compression you use and the type of load on your server. If you have a CPU-bound server with average sustained CPU usage around 60 percent or higher, you might not want to use compression, at least not on volatile tables that have a lot of inserts and updates.
![]() TIP Page compression is a very interesting feature. Every page in a page-compressed table or index automatically receives row compression, but for column prefix or page dictionary compression to be applied, either or both must be able to accomplish 20 percent space savings across the page—otherwise, the page will receive only row compression. This means on a table that has had page compression applied, some pages could be only row-compressed while others are page-compressed. This is internally managed by SQL Server and is not something that can be changed by the user.
TIP Page compression is a very interesting feature. Every page in a page-compressed table or index automatically receives row compression, but for column prefix or page dictionary compression to be applied, either or both must be able to accomplish 20 percent space savings across the page—otherwise, the page will receive only row compression. This means on a table that has had page compression applied, some pages could be only row-compressed while others are page-compressed. This is internally managed by SQL Server and is not something that can be changed by the user.
Index pages receive page compression only at the Leaf level. At the Root and Intermediate levels, they will be only row compressed.
When page compression is enabled, new data is inserted only in a row-compressed format. When a page fills to the point that a page split occurs in a clustered index, the page-compression calculation fires off.
In a heap, new data is always inserted in a row-compressed format even if 20 percent space savings can be achieved. The only way to get page compression to fully apply to a heap is to rebuild the heap.
What Do You Compress?
Now that you have a better understanding of compression and how it works with your data, you can start to look at your data to figure out what you should and should not compress. The factors that will play the largest part in your compression decision are table size, allocation units, and scan and update patterns on your tables.
You want to get the biggest bang for your buck, and I understand that. When you go to your boss and say, “We can save X amount of space using SQL Server compression,” you want to say it proudly. So the first thing you want to know is this: what are the largest tables in our database? There are multiple ways to get your table space usage in SSMS: you can right-click on your database, select reports, and select Disk Usage by Table. You could also use DMV sys.dm_db_partition_stats. It would take a little finesse to get the same output, but the data is there. Normally, to get that I like to run a script I have that uses the undocumented sp_MSforeachtable and that inserts the data from sp_spaceused into a table variable and returns a list of tables and their sizes.
The command sp_MSforeachtable is a function that does a cursor loop through all user tables in a user database, and all tables in a system database. The command sp_spaceused is a documented function that gives you the table name, rows, reserved space, data space, index size, and unused space per table.
DECLARE @myTable AS TABLE(

                            [Name] varchar(1000)

                            ,[Rows] int

                            ,[Reserved] varchar(500)

                            ,[Data] varchar(500)

                            ,[Index_Size] varchar(500)

                            ,[Unused] varchar(500)

                            );


INSERT INTO @myTable

EXEC ('sp_msforeachtable @command1="sp_spaceused [?]"'),


SELECT

    NAME

    ,ROWS

    ,RESERVED

    ,(cast(LEFT([reserved],(LEN([reserved])-3)) as int)/1024) as ReservedMB

    ,((cast(LEFT([reserved],(LEN([reserved])-3)) as int)/1024)/1024) as ReservedGB

    ,DATA

    ,INDEX_SIZE

    ,UNUSED

FROM

    @myTable

ORDER BY

    (cast(LEFT([reserved],(LEN([reserved])-3)) as int)/1024) DESC;

GO
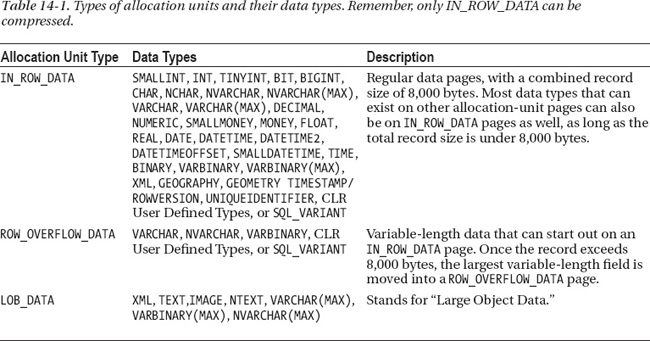
Now that you know what the largest tables are, you need to know what kind of allocation units they are made up of. SQL Server has three types of allocation units: IN_ROW_DATA, ROW_OVERFLOW_DATA, and LOB_DATA. Allocation units are responsible for tracking how many pages have been allocated and what types of pages have been allocated for a particular table. The data type you select to use in your table determines the type of allocation units SQL Server uses. See Table 14-1 for a list of which data types are associated with which types of allocation units.
The only allocations units that can be compressed are data types that use only IN_ROW_DATA pages. Luckily, as long as you’re not using Large Object (LOB) types such as Text, Image, XML, or any of the MAX types—(VARCHAR(MAX), BINARY(MAX), NVARCHAR(MAX))—the data will be on IN_ROW_PAGES. If your data record contains less than 8,000 bytes of data, you can have LOB data types on IN_ROW_DATA pages. In those cases, row compression doesn’t give you space savings, because you have variable-length columns and that do not waste extra unused space. Page compression might save you space if the binary data matches the criteria I previously covered with regard to meeting page-compression requirements for being applied to a page. As long as the data can exist on IN_ROW_DATA pages, it can be compressed. In a moment, I’ll validate this statement with an example, but first let’s continue on with allocation units.
The first thing I would do is run a query against the database to get back all the page counts for allocation unit types. To do this, I run the following query to get a list of tables and indexes by page count, focusing on the tables with IN_ROW_DATA.
SELECT

    OBJECT_NAME(sp.object_id) AS [ObjectName]

    ,si.name AS IndexName

    ,sps.in_row_data_page_count as In_Row_Data

    ,sps.row_overflow_used_page_count AS Row_Over_Flow_Data

    ,sps.lob_reserved_page_count AS LOB_Data

FROM

    sys.dm_db_partition_stats sps

    JOIN sys.partitions sp

        ON sps.partition_id=sp.partition_id

    JOIN sys.indexes si

        ON sp.index_id=si.index_id AND sp.object_id = si.object_id

WHERE

    OBJECTPROPERTY(sp.object_id,'IsUserTable')    =1

order by sps.in_row_data_page_count desc
Now let’s validate that the data type doesn’t matter as long as the data is located on IN_ROW_DATA pages. We’ll use the following script to create a table in our database that has the VARCHAR(MAX) data type, but we will use only 4,037 characters of data and apply page compression:
/*

Select our demo database

to use

*/

USE demoInternals

GO

/*

Create our table

*/

IF EXISTS(SELECT name FROM sys.tables WHERE name='vmaxTest')

BEGIN

    DROP TABLE dbo.vmaxTest

END

GO

CREATE TABLE vmaxTest(myid int identity(1,1)

    , mydata varchar(max) default 'a'

    ,CONSTRAINT pk_vmaxtest1 PRIMARY KEY CLUSTERED (myid))

GO

/*

Insert 5000 rows

*/

DECLARE @i INT

SET @i=0

WHILE (@i<5000)

BEGIN

    INSERT INTO vmaxTest(mydata)

    VALUES(replicate('a',4032)+cast(@i AS VARCHAR(5)))

    SET @i=@i+1

END

GO

/*

Check our space before we compress

*/

sp_spaceused 'vmaxTest'

GO

/*

Rebuild our table with

Page Compression

*/

ALTER TABLE dbo.vmaxtest

REBUILD WITH(DATA_COMPRESSION=PAGE);

GO

/*

Check our space after we compress

*/

sp_spaceused 'vmaxTest'

GO
As you can see from Figure 14-13, the space used before we compressed our table was 40,200 KB, or roughly 40 MB. Not a large data set, but enough to show what we want to test. The storage size was reduced to 320 KB after applying page compression.
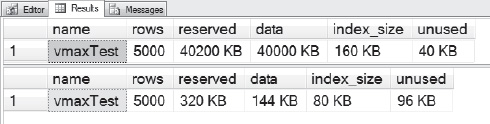
Figure 14-13. Looking at the results of page compression against a VARCHAR(MAX) data type that was in an IN_ROW_DATA page.
This validates that we can compress VARCHAR(MAX) on an IN_ROW_DATA page, but it validates only half of our premise. To test this, we need to create data allocated by something other than IN_ROW_DATA and see that it doesn’t compress. We’ll use the same script as last time, but we’ll add another VARCHAR(MAX) field and force some of the data to LOB_DATA pages. See Figure 14-14 for the page counts prior to compression. After that, we’ll take a look at the allocation units, validate that the pages have been created, and then compress the data still in the IN_ROW_DATA pages. See Figure 14-15 for the page counts after compression has been applied.
/*

Select our demo database

to use

*/

USE demoInternals

GO

/*

Create our table

*/

IF EXISTS(SELECT name FROM sys.tables WHERE name='vmaxTest')

BEGIN

    DROP TABLE dbo.vmaxTest

END

GO

CREATE TABLE vmaxTest(myid int identity(1,1)

    , mydata varchar(8000) default 'a'

    ,mydata2 varchar(max) default 'b'

    ,CONSTRAINT pk_vmaxtest1 PRIMARY KEY CLUSTERED (myid))

GO

/*

Insert 5000 rows

*/

DECLARE @i INT

SET @i=0

WHILE (@i<5000)

BEGIN

    INSERT INTO vmaxTest(mydata, mydata2)

    VALUES(replicate('a',2016)+cast(@i AS VARCHAR(5)), replicate('b',2016)+cast(@i AS VARCHAR(5)))

    SET @i=@i+1

END

GO
/*

create some row overflow data by

inflating the size of our mydata2

varchar(max) field to 7000 characters

*/

UPDATE dbo.vmaxTest

SET mydata=replicate('a',3900),

mydata2=replicate('b', 5000)

GO

/*

Validate our Allocation Unit Makeup

and get page counts

*/

SELECT

    OBJECT_NAME(sp.object_id) AS [ObjectName]

    ,si.name AS IndexName

    ,sps.in_row_data_page_count as In_Row_Data

    ,sps.row_overflow_used_page_count AS Row_Over_Flow_Data

    ,sps.lob_reserved_page_count AS LOB_Data

FROM

    sys.dm_db_partition_stats sps

    JOIN sys.partitions sp

        ON sps.partition_id=sp.partition_id

    JOIN sys.indexes si

        ON sp.index_id=si.index_id AND sp.object_id = si.object_id

WHERE

    OBJECTPROPERTY(sp.object_id,'IsUserTable')    =1

order by sps.in_row_data_page_count desc
Figure 14-14. Page count by allocation unit before applying page compression.
/*

Rebuild our table with

Page Compression

*/

ALTER TABLE dbo.vmaxtest

REBUILD WITH(DATA_COMPRESSION=PAGE);

GO


/*

Validate our Allocation Unit Makeup

and get page counts

*/

SELECT

    OBJECT_NAME(sp.object_id) AS [ObjectName]
    ,si.name AS IndexName

    ,sps.in_row_data_page_count as In_Row_Data

    ,sps.row_overflow_used_page_count AS Row_Over_Flow_Data

    ,sps.lob_reserved_page_count AS LOB_Data

FROM

    sys.dm_db_partition_stats sps

    JOIN sys.partitions sp

        ON sps.partition_id=sp.partition_id

    JOIN sys.indexes si

        ON sp.index_id=si.index_id AND sp.object_id = si.object_id

WHERE

    OBJECTPROPERTY(sp.object_id,'IsUserTable')    =1

order by sps.in_row_data_page_count desc
Figure 14-15. Page count by allocation unit before after applying page compression.
I once had a client who had just upgraded from SQL Server 2000 to SQL Server 2008 R2. They wanted to look at using compression on their main production database. They had a particular table in mind, one that had 132 GB of data in it. The first thing I did was look at the allocation units, and they were 1 percent IN_ROW_DATA 99 percent LOB_DATA. Upon asking what was stored in the table, I learned that it had an Image column and was used to hold PDF documents. I immediately told the client that SQL Server data compression was not something they should use on this table, because the majority of the data, the vast majority, was not compressible. The best thing about knowing what type of allocation units make up your table is that not only will it help you choose what to compress, but it will help you choose what not to compress. We could have used FILESTREAM to store the PDF documents or, in SQL Server 2012, FileTable also was an option to consider, to give them greater flexibility on how they store and searched their data.
As long as your data is in IN_ROW_DATA pages, you can compress it. Know what your allocation unit for your data is before deciding what to compress. I wouldn’t normally compress a table with just a 50-50 ratio, like I did in our second example, without taking a couple steps. First find the queries or stored procedures that access this table. Extract the query plans in XML format and examine them. Compress the data, and extract the query plans again. Now did the plans change? How was performance impacted? Answering these questions can go a long way in determining what you will want to compress.
The scan and update patterns, on your tables, are the next thing to consider when determining what to compress. The more a table is updated, the less likely you should be to compress it. Writes cause extra CPU activities. SQL is constantly translating writes to data pages to compressed and uncompressed format. Updates can cause page splits, which then cause the page compression to be recalculated on all updated pages. Notice that I said “updates” and not “inserts.” Inserts might cause an issue, but updates speak to the volatility of the data in your table. Our queries will look for scans and updates, and we will filter inserts out of each.
You use the DMV sys.dm_db_index_operational_stats to determine your scan and update patterns. This DMV returns low-level I/O details for a number of range and table scans, as well as update, insert, and delete activity. The query you’ll use was originally two separate queries. I used a Common Table Expression (CTE), which is a temporary derived result set based on a simple query, to combine them so that you could look at scans and updates for indexes side by side.
You use the range_scan_count column to get all scans that have occurred against a heap, clustered index, or nonclustered index. You then multiply that number by 100.0 and divide the result by the total scans, inserts, updates, and deletes that have occurred on the system. This gives you a percentage of scan activity on all the indexes in all the tables in your database.
If you perform only selects, you’ll always have returned 100 percent. If you issue some updates, deletes, or inserts, you’ll see the scan percentage begin to drop.
You use the leaf_update_count column to get all update activity for your heaps, clustered indexes, and nonclustered indexes. Figure 14-16 shows the results of your scan and update query from some of our demo tables; your results might vary based on select, update, and insert statements that you have run. All scan and update data for an object will be cleared when rebuilding an object by applying compression.
Ideally, your updates should be under 40 percent and your scans should be 60 percent or higher, in order to select a table for compression. Neither of these percentages will add up to 100 percent—we are simply getting an average of these two activities out of all the other operations that could be performed on them.
So now let’s run a query that will look at each table in your database and let you see what the allocation unit makeup is for each one.
WITH IndexUsage(tableName, IndexName, [Partition], IndexID, IndexType, USAGE, Percentage)

AS(

SELECT

    (ss.name + '.' + so.name)

    ,si.name

    ,ios.partition_number

    ,ios.index_id

    ,si.type_desc AS indexType

    ,'SCANS'

    , case ios.range_scan_count

    when 0 then 0

    else


(ios.range_scan_count *100.0/

    (ios.range_scan_count +

    ios.leaf_delete_count +

    ios.leaf_insert_count +

    ios.leaf_page_merge_count +

    ios.leaf_update_count +

    ios.singleton_lookup_count)) end AS percentScan

FROM

    sys.dm_db_index_operational_stats(DB_ID(),NULL,NULL,NULL) ios

    JOIN sys.objects so

    ON so.object_id=ios.object_id

    JOIN sys.indexes si

    ON si.object_id = ios.object_id AND si.index_id = ios.index_id

    JOIN sys.schemas ss

    ON so.schema_id = ss.schema_id

WHERE

    OBJECTPROPERTY(ios.object_id, 'IsUserTable')=1

UNION ALL


SELECT

    (ss.name + '.'+ so.name)

    ,si.NAME

    ,ios.partition_number
    ,ios.index_id

    ,si.type_desc

    ,'UPDATES'

    , case ios.leaf_update_count

      when 0 then 0

      else

(ios.leaf_update_count *100/

    (ios.range_scan_count +

    ios.leaf_insert_count +

    ios.leaf_delete_count +

    ios.leaf_update_count +

    ios.leaf_page_merge_count +

    ios.singleton_lookup_count)) end

FROM

    sys.dm_db_index_operational_stats(DB_ID(), NULL, NULL, NULL) ios

    JOIN sys.objects so

    ON so.object_id = ios.object_id

    JOIN sys.indexes si

    ON ios.object_id=si.OBJECT_ID AND ios.index_id=si.index_id

    JOIN sys.schemas ss

    ON so.schema_id=ss.SCHEMA_ID

WHERE

    OBJECTPROPERTY(ios.object_id, 'IsUserTable') =1

)

SELECT

    iu.tableName

    ,iu.IndexID

    ,iu.IndexType

    ,iu.USAGE

    , cast(iu.Percentage as decimal(12,2)) as Percentage

FROM

    IndexUsage iu

ORDER BY

    iu.tableName

    ,iu.IndexName

    ,iu.Percentage DESC

GO
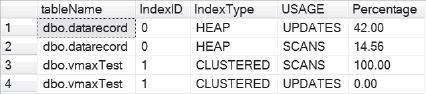
Figure 14-16. The scan and update patterns on the tables in my demo database.
This query uses the statistics in use on your database since the last reboot to determine these patterns. To get solid data, you should run this on a server that has been online for as long as possible. The higher the number of scans, the more the table is suited for compression. The lower the number of scans and higher the number of updates, the more you want to consider either row compression or no compression.
Look at Figure 14-16 and examine our usage patterns. You’ll see that vmaxTest is a good candidate for compression. You’ll also see that dbo.datarecord is not. Get a baseline of the statements run against the database to validate this decision.
Another thing to consider regarding indexes is the rebuild time. When you enable row compression index, rebuilds on that particular index should take 1.5 times what the rebuild rate is for the same -index in a noncompressed format. Page compression takes that up even further to 2 times the rebuild rate for the same index in an uncompressed format.
So now that you have selected a table based on the table size, allocation unit makeup, and a compression setting based on the scan or update patterns, you’re ready to run sp_estimate_data_compression_savings. This is the built-in procedure for estimating compression space savings. You can focus this procedure by providing the Schema Name, Object Name, Index ID, and Partition Number parameters and specifying the type of compression you want to estimate. You can specify Row, Page, or None. If you have an uncompressed object, you can see the estimated space savings by specifying the type of compression you would like to apply. If you would like to uncompress a compressed object, you can specify None and find out what the estimated size of the uncompressed object will be. Before you do that, I want to issue a big warning.
The system stored procedure sp_estimate_data_compression_savings works by placing 5 percent of the table in your Tempdb and performing the compression operation. Based on the rate of compression, it then extrapolates the data and estimates, based on the size of your table, what your savings might be for the type of compression you specified.
For most people, this will not be a problem. Estimating the compression savings of a 100-MB table will take 5 MB of Tempdb space. However, estimating the compression savings of a 100-GB table will take 5 GB of Tempdb space. If you have a 500-GB table, you need 25 GB of free Tempdb space for the operation. If you fill up Tempdb, activity on your server will grind to a halt. So be careful and only use sp_estimate_data_compression_savings as your last step.
There are tools on Codeplex and scripts all over the Internet that put sp_estimate_data_compression_savings in a cursor and run it for every table in your database. I do not recommend this approach because all it does is give you a possible savings estimate. It doesn’t tell you what the allocation unit makeup of your tables are, nor does it help you determine what level of compression to use.
So before you use sp_estimate_data_compression_savings, take a look at your Tempdb and make sure you have enough free space to estimate the compression savings safely.
After doing this, make sure you take performance baselines before and after compression is applied. Compression will reduce the amount of data cache used by the buffer pool, and reducing the number of pages in a table could move some queries from scans to seeks, thus improving query performance. The only way to be sure is to have a baselines review.
Fragmentation and Logged Operations
One of the great things about compression is that it efficiently uses all available space on a data page. One of the bad things about compression is it is very easy to create fragmentation from insert, update, and delete operations because compression uses all available space on a data page. Whenever you pack records tightly on a page, this is bound to occur. It is also one of the reasons why you should look at scan and update patterns before determining what to compress.
When you rebuild a heap, clustered index, nonclustered index, or object by partition and apply compression, you can still use all of the wonderful index options the way you have with noncompressed objects. Fill Factor, Pad Index, Sort_in_Tempdb, Online, and all other index options can still be used. Remember though, all rebuilt data records will receive the full amount of compression possible. If you set a Fill Factor of 60, 40 percent of every data page will be left empty and ready for new records. Those new records will receive only row compression even if you have specified page compression until they fill to the point that a page split would occur. This excludes heaps, which get forwarding pointers and not page splits. Heaps need to be completely rebuilt before they can compress new records to a compression level lower than Row.
This means you can use the power of compression with additional index hints to prevent fragmentation, while still getting space savings.
Another thing you might wonder is what this does this to database logging. If your database is in the Full recovery model, all transactions are logged operations that can be cleared only by transaction log backups. In this situation, you might wonder how much overhead compression adds. The answer to that is that compression applies very minimal changes in logging regardless of the recovery model.
But don’t just take my word for it, let’s prove it. First create a database you can test against:
USE master;

Go

IF EXISTS(SELECT name FROM sys.databases WHERE Name=N'demoCOMPRESSIONInternals')

    BEGIN

        DROP Database demoCOMPRESSIONInternals

    END

CREATE DATABASE demoCOMPRESSIONInternals

GO


USE demoCOMPRESSIONInternals

go

IF EXISTS(SELECT NAME FROM sys.tables WHERE name=N'myTableC1')

BEGIN

    DROP TABLE dbo.myTableC1

END


CREATE TABLE myTableC1(

    myID INT IDENTITY(1,1)

    ,productName char(500) DEFAULT 'some product'

    ,productDescription CHAR(1000) DEFAULT 'Product Description'

    ,PRIMARY KEY CLUSTERED(myID) WITH (DATA_COMPRESSION=PAGE)

)
;
I’ll use a named transaction so that you can search the transaction log and find the logged operation easily:.
/*

Look at the Transactions within

The Transaction Log

*/

BEGIN TRAN Compressed

INSERT INTO dbo.myTableC1(productName, productDescription)

        VALUES(

                (REPLICATE('a', 499) + CAST(1 AS VARCHAR(1)))

                ,(REPLICATE('b', 999)+ CAST(1 AS VARCHAR(1)))

            )


DECLARE @a CHAR (20)
SELECT @a = [Transaction ID] FROM fn_dblog (null, null) WHERE [Transaction Name]='Compressed'


SELECT * FROM fn_dblog (null, null) WHERE [Transaction ID] = @a;

GO
We are using the undocumented function fn_dblog. This function allows us to see and query the contents of the transaction log. When you look at Figure 14-17, you will find, in the Transaction Log, that there are no logged operations outside of what you would find in a normal insert.

Figure 14-17. Looking at the output from fn_dblog produced during the insert on a compressed table.
So row compression, the default for inserts on pages that have not yet split on clustered indexes, did not produce any logged operations. You know that until the page is full and a split occurs you will not get a page-compression operation. So let’s commit the transaction and try inserting some more rows to see what we find:
COMMIT TRAN


/*

Let's Add 5000 Rows!!!!

*/


BEGIN TRAN Compressed2

DECLARE @i INT

SET @i=1


WHILE (@i<5000)

    BEGIN

        INSERT INTO dbo.myTableC1(productName, productDescription)

        VALUES(

                (REPLICATE('a', (499-LEN(@i))) + CAST((@i +1) AS VARCHAR(5)))

                ,(REPLICATE('b',(999-LEN(@i))) + CAST((@i+1) AS VARCHAR(5)))

                )


        SET @i = @i +1


    END


DECLARE @a CHAR (20)


SELECT @a = [Transaction ID] FROM fn_dblog (null, null) WHERE [Transaction Name]='Compressed2'


SELECT * FROM fn_dblog (null, null) WHERE [Transaction ID] = @a;
GO
You see the same logged operations as before—LOP_BEGIN_XACT, LOP_LOCK_XACT, and LOP_INSERT_ROWS—repeated over 4999 times. You do not see any compression operations inside of a transaction because they occur outside of the scope of the transaction. This means there is no additional overhead in transactions to account for compressed operations, which is very efficient.
If the overhead is a concern, there are two ways you can track this. If you’re in the Full recovery model or the Bulk Logged recovery model and are performing regular transaction log backups (and if you don’t, your transaction log will grow until it fills up the drive it is on and prevent any new data from being inserted into your database), you can examine the size of your log files and track that size once you turn compression on. If you notice significant growth, you can use the undocumented function fn_dump_dblog to query your transaction log backups and see how many LOP_COMPRESSION_INFO logged events you have. Use your favorite search engine to search for more information on fn_dump_dblog because that is beyond the scope of this chapter.
If your recovery model is Simple, you can watch the overall growth of your transaction log and watch your baselines for changes. As long as the Virtual Log Files (VLFs, which are the inner structures of the transaction log), that contain compression operations have not been overwritten, you can use fn_dblog to query them as well. You cannot use fn_dump_dblog because you cannot take transaction-log backups in the Simple recovery model.
To find these transactions, I originally took the entire content of the transaction log and dumped it into a spreadsheet and sorted by type until I could identify each operation. Because these operations did not occur within the context of our named transactions, it means that compression operations do not add overhead to user transactions. I found one in particular that stood out: LOP_COMPRESSION_INFO. Let’s take a look:
/*

first don't forget to commit

your transaction

*/

COMMIT TRAN


SELECT * FROM fn_dblog(NULL, NULL) dl

WHERE Operation='LOP_COMPRESSION_INFO'
You will find this logged operation frequently. The LOP_COMPRESSION_INFO operation is the logged event that is called when a data page compression attempt is made. If the attempt has failed, it points to a bitmap that contains the different reasons that the page would not be compressed. You also have the columns Compression Info and Compression Log Type. Compression Info contains a copy of the data record in its compressed format. If you use the commandDBCC Page, that you used earlier, and compare the data record contents to that of the Compression Info column from the logged operation, they will match exactly. If you look at the Compression Log Type column, you’ll see it is a bit field that is set to 1 when the record has been paged-compressed and 0 when it has not. Some reasons why a record would not be compressed is that you have not reached the 20 percent space-savings requirement, the page is not yet full to the point of a page split (in a clustered index), or the data or the page changed and no new compression savings could be found.
One important note is that when data is modified and committed in SQL Server, it is logged in the transaction log. When that data is in a compressed state, it takes up less room. Depending on your data and how it is used, that can translate into space savings within the transaction log. You should not be afraid of transaction-log overhead when it comes to compression—in fact, quite the opposite.
Conclusion
Page and row compression are powerful tools. If you’re paying for an Enterprise license you should be taking advantage of them. As with indexes, there is not a one-size-fits-all solution to compression. Instead, the more you know about it, the better you will be able to apply it in your environment. Turning it on and walking away is never a good idea. Monitor your systems, and make sure there are not any changes or spikes in CPU usage that will catch you off guard. “Know Thy Data” is not just a catchy phrase. The more you know about your environment, the more you can apply SQL Server internal knowledge to help you manage it effectively.
Remember the criteria to consider: The larger the table, the more likely you are to see a benefit. Get accurate baselines so that you know how compression affects query performance. Look at your allocation-unit structure: tables with 100 percent IN_ROW_DATA pages are great candidates for compression. You want to tread carefully with anything lower than 50 percent. Tables and indexes with greater than 45 percent scan usage patterns are candidates for compression; for update patterns lower than 45 percent (down to 20 percent), use row compression. For 20 percent and lower, use page compression, get a baseline, and test again.