
Chapter 12
Agile Planning and Tracking
What's in this chapter?
- Defining and managing the product backlog
- Planning an iteration while balancing resource capacity
- Tracking work using task boards
- Understanding options for customizing the agile planning and tracking tools
The Agile Manifesto defines several guiding principles that have implications on the ways in which teams manage projects. Instead of attempting to define an entire project schedule up front, as with a waterfall methodology, an agile team allows the plan to evolve over time. Work is broken down into multiple successive iterations, each of which should last no more than 30 days.
Teams practicing an agile development methodology tend to embark upon a journey of mutual discovery with their customers to determine new work dynamically, based on changing business priorities or on feedback from work completed in previous iterations. The customer, or at least a proxy for the customer, is considered a virtual member of the team and participates in defining and ordering (and often reordering) work over time.
The pursuit to embrace agile development, with dynamic schedules and evolving requirements, has meant that many of the tools and techniques used for traditional project management are no longer sufficient. Agile practitioners have needed to look for different ways of capturing work, balancing resource capacity, tracking status, and so on.
Scrum, which is by far the most popular agile development practice in use today, defines only a simple framework for managing work. Scrum allows you to decide which complementary practices you need to employ to create a methodology that works for you, your company, and your software process. Future work is captured and ordered on a product backlog, which is refined continuously by the product owner using feedback from the team and stakeholders. The development team accepts work into iterations, called sprints, and commits to their best efforts to deliver within its timebox, usually two weeks but never more than 30 days. Each sprint has its own sprint backlog which contains the things from the product backlog the development team has committed to, plus a plan to complete them. This work is tracked to completion and may be visualized on a task board, which usually takes the form of sticky notes on a whiteboard.
Team Foundation Server 2012 embraced these concepts by providing a set of web-based tooling for managing your product backlog, decomposing your work into iterations, and tracking your work using a digital task board. Team Foundation Server 2013 adds a set of portfolio management tools that can be used to organize higher level work. Anyone familiar with or practicing Scrum should feel immediately at home with this set of tooling, although it cannot be understated that this same set of tooling can be adopted by any team who wants to use it, even if they aren't practicing Scrum per se. One of the design principles of Team Foundation Server has always been that teams can use any process they want to, and Team Foundation Server provides the right level of flexibility and customization to support such a process.
In this chapter you find out about the new web-based tooling available within Team Foundation Server 2013 to support agile project management and tracking. This book is not a true primer on how to run a project using a Scrum (or any other) development methodology, but there are several great books to choose from that cover this topic.
Defining a Team
Team Foundation Server 2012 introduced the notion of a team, which you can use to organize people who are working together. This should not be confused with the concept of a team project within Team Foundation Server, which is a large container of work, consisting of source control and work items that all share a common process Template. A team project can contain multiple teams, and each team can have its own product backlog, iterations, and task board. A single person might also participate in more than one team. For instance, a graphic designer might be a shared resource responsible for contributing artwork to different teams.
To create a team, follow these steps:
- Open a browser and visit the Team Web Access home page for your team project. You can access this by clicking the Web Access link in Team Explorer. The address takes the format of
http://<server>:<port>/tfs/<collection-name>/<team-project-name>. - Now open the administrative context by clicking the gear icon in the upper-right corner. If you do not have administrative privileges for your team project, you need to contact your team project administrator to perform these steps. On this screen you should see a list of any teams that are already configured for your team project.
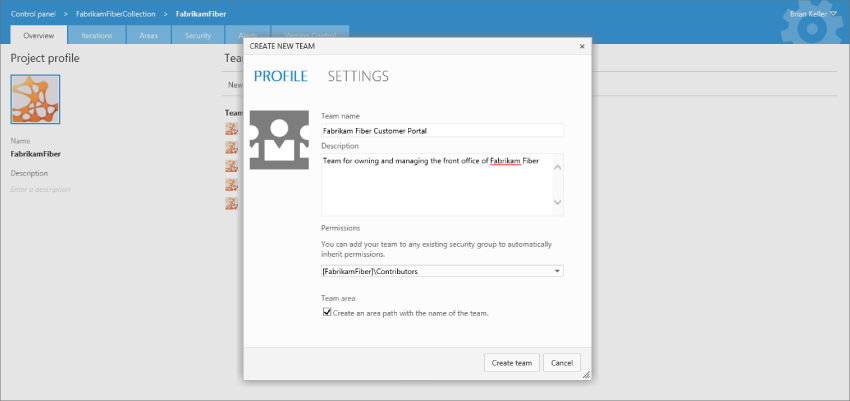
- Click New Team to display the Create New Team dialog, as shown in Figure 12.1. You can provide a name and description for your team, and specify what default permissions new team members should inherit. From the Settings tab you can also declare any users who should be team administrators, and you can opt to create a new area for this team.
You were introduced to the concept of areas in Chapter 11. Areas provide a way for you to categorize your work within a team project. You can choose to create areas for each of your teams, so that (for example) bugs that are filed against the Fabrikam FiberCustomer Portal Team area path are automatically routed to the Customer Portal Team.
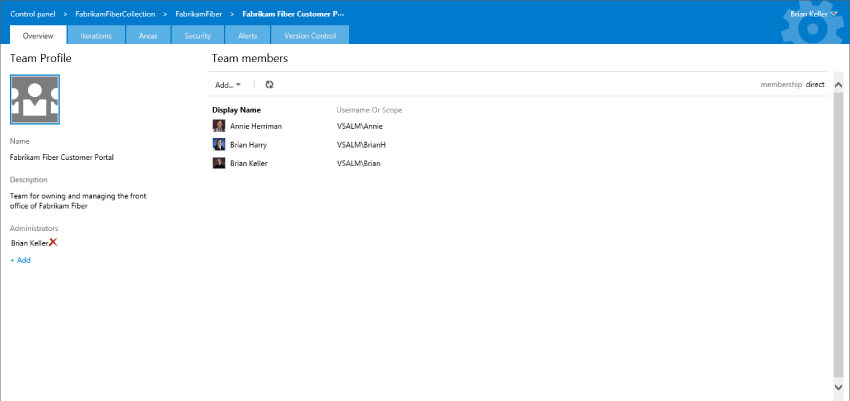
- Click Create Team when you are finished to create your team and return to the list of teams on your team project. Click your team in this list to display the team administrative dialog shown in Figure 12.2. From here you can easily add new team members or team administrators. You can also change the name of your team, the description, or even choose an image to represent your team.
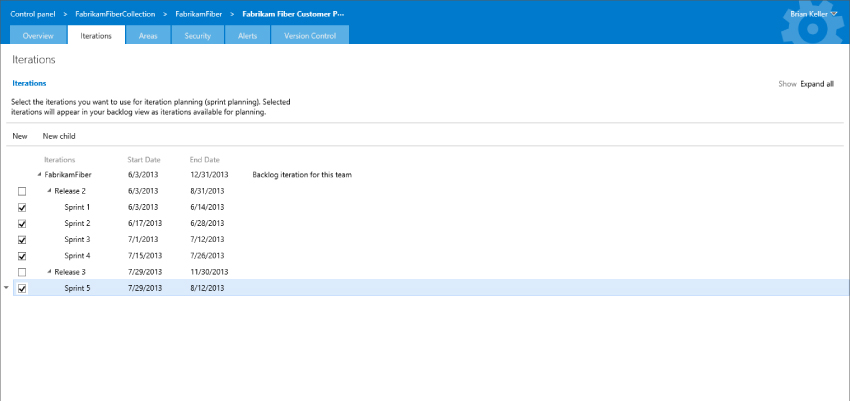
- Click the Iterations tab to select the iterations your team is participating in, as shown in Figure 12.3. In Chapter 11 you learned how to manage iterations and assign start and end dates to them. On this screen, you are indicating which iterations your team is using to structure its work. You should ensure that the iteration dates do not overlap.
Your iterations need to be hierarchical, consisting of at least one parent and one child. This is required so that your backlog iteration (representing unscheduled work) can exist at the root or parent node, and specific iterations (representing scheduled work) are represented by child nodes. In Figure 12.3,
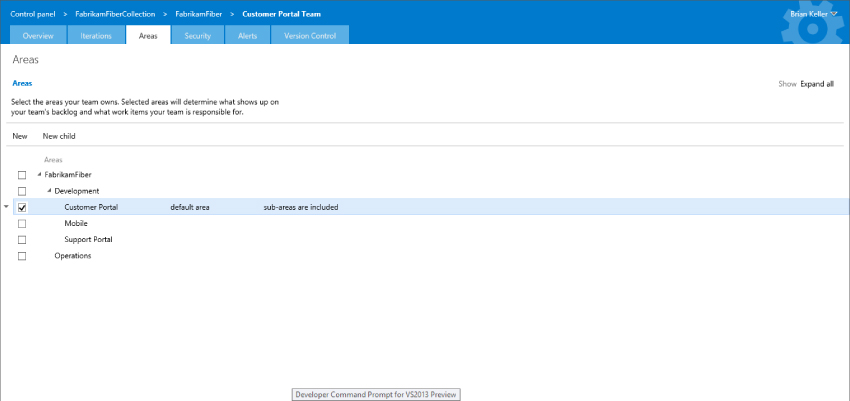
Release 2is the parent node representing the backlog iteration. You can select a new backlog iteration by highlighting that iteration, clicking the small drop-down arrow to the left of the iteration name, and then selecting Set as Team's Backlog Iteration. But you need to first ensure that your desired backlog iteration has at least one child iteration.Similarly, click Areas to configure which area paths your team is using to manage its work, as shown in Figure 12.4. You can select multiple areas, or the root area path, although if you have many people using your team project you might want to use areas to more carefully segregate work.
You can use the Security tab to configure permissions for your team. Finally, you can use the Alerts tab to configure email notifications for your team. For example, you might want to automatically send an email to any team member if a work item that is assigned to that person changes. Or you can email the entire team if a daily build fails.
- Close the administrative context when you are finished, and return to Team Web Access. You can now access the team home page for any team you are a member of by clicking the drop-down arrow on the final item in the blue breadcrumbs bar at the top of the Web Access view and selecting the appropriate team. For example, Figure 12.5 shows the home page for the Customer Portal Team.
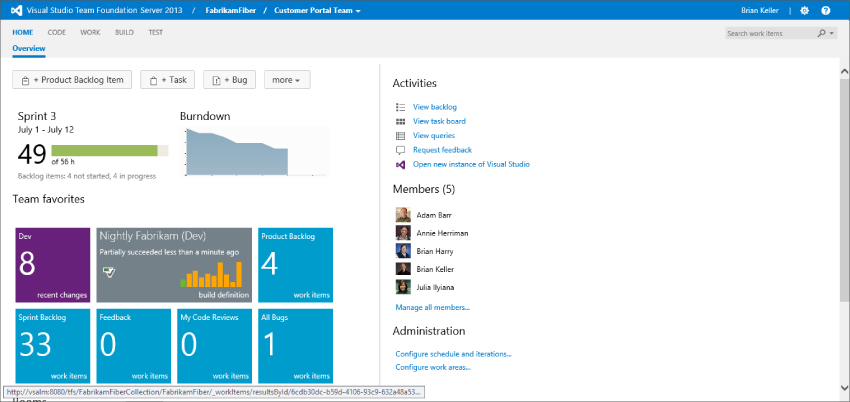
If you just created a new team then your home page won't yet look as rich as the one shown in Figure 12.5. The top half of this view shows information relevant to your current iteration. The status bar on the left shows the amount of work remaining as compared with the capacity of your team (in this example, there are 49 hours of work remaining and the team has a total capacity of achieving 56 hours of work). The burn-down graph is a trend that shows how remaining work has decreased (or increased) over time during your current iteration. You learn more about iteration capacity and burn-downs later in this chapter.
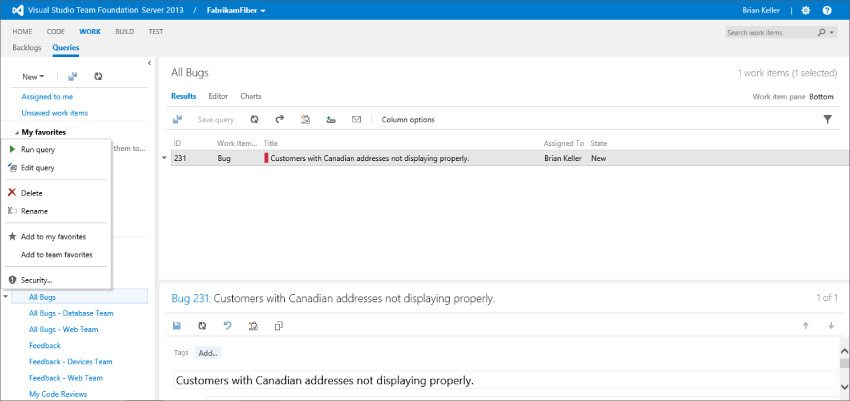
The bottom half of this view shows any Team Favorites you have configured. These can represent queries—such as open bugs, or in-progress tasks. They can also display graphs of recent builds, or even recent changesets that have been checked into a particular branch. To add Team Favorites to this view, you should first open a relevant query, branch, or build within Team Web Access. You can then click the small drop-down arrow located to the left of the object and select Add to Team Favorites, as shown in Figure 12.6. This adds a new tile to your team's home page, which can make it easy for the entire team to see the metrics you believe are most important to track.
Next, you see how to define and manage your team's portfolio backlog.
Managing Portfolio Backlogs
A portfolio backlog is just a way of differentiating between things that are owned by the team and those that are owned by the greater organization. If you have many teams you can use portfolio backlogs to gain insight into the features and epics that define the less granular deliveries over many sprints or releases. Industry standard looks to be following the SAFe (Scaled Agile Framework) model. In Team Foundation Server 2013, you have features configured by default but you may configure four additional levels above each feature.
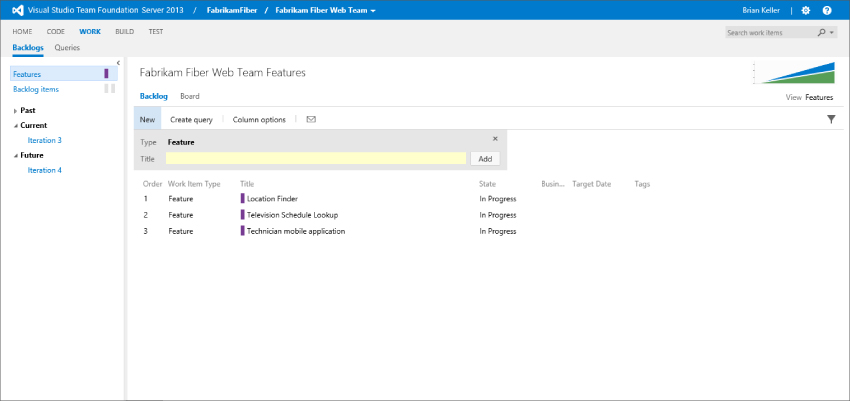
From your team's home page, click View Backlog to display the product backlog. Once you are there, click Features to display the Feature backlog, as shown in Figure 12.7. You can use the “Quick Add” panel, the gray form above the list, to quickly add new features to your backlog. You need only enter a title and press Enter (or click Add) and your new Feature will be saved to your Feature backlog. This will automatically create a new work item in Team Foundation Server.
If you highlight a row within your backlog, any new work you add from the Quick Add panel is inserted above this highlighted row. The exception to this rule is if you have highlighted the last row in your backlog; new work is added at the end of your backlog.
You can easily reprioritize work by simply dragging and dropping it on the backlog. Changes you make here are saved to Team Foundation Server in the background. You can also double-click an item in this view to open the work item editor to provide additional detail or make changes.
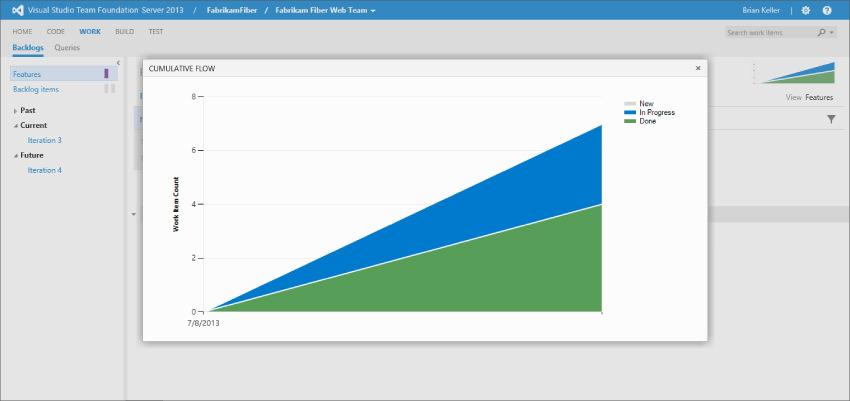
Teams practicing Kanban will be familiar with cumulative flow, which is a way to graphically visualize the flow of work, transitioning through defined states, through your process. This is hugely valuable to help you understand where there are bottlenecks in your process and thus waste. If you click on the small diagram on the top right of your backlog view, you will open a larger view of the cumulative flow report. You can see an example in Figure 12.8. It shows the three states—New, In Progress, and Done—that a Feature flows through. Clicking the cross in the top right or anywhere not on the pop-up box closes the box.
On the portfolio backlog there are a number of features that allow you to better understand the contents, including tags and views, and these are discussed more in the next section.
In addition to the ability to view and order the backlog, you can also represent the backlog as you would with sticky notes on the wall; in a Kanban board. Figure 12.9 shows columns that represent the same states on your Feature work items and colored cards representing each of the Features in its corresponding column. You can click an individual card to open the work item that it represents. Changing state now becomes as easy as dragging the card from one column to another. Indeed this board supports Surface, iPad, and Android touch capabilities well.
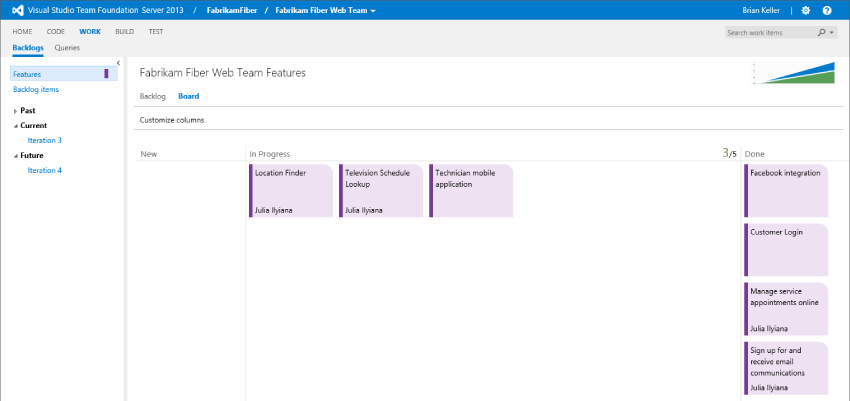
A Kanban board would not be complete without being able to limit work in progress (WIP), or at least understand when you are over your limits. You can see a green 3/5 in the top right of the In Progress column in Figure 12.9. This signifies that you have set a WIP limit of five and currently have three things in there. Team Web Access will not stop you from going over your limit (Team Foundation Server is not meant to be an enforcement system), but it will turn the green numbers red when you do. As you move cards around the board, the cumulative flow graph changes dynamically to match.
You can change the number of columns available, see Figure 12.10, without changing the state model. Although the minimum number of columns is the same as the state model, you can split any state into multiple columns.
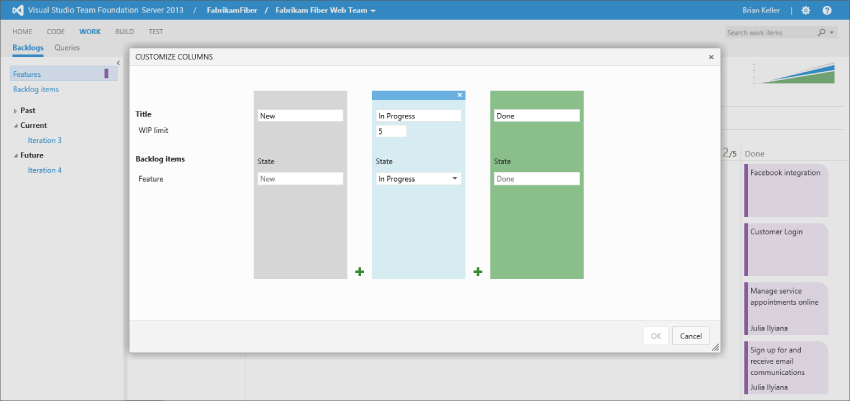
This is especially useful to allow you to model your current process while maintaining a simple state model for reporting.
You do need to make sure that you have correctly mapped the state of the work items represented to the columns you set. Here, you have only one work item type, Features, so it is a simple mapping. This is also where you set the WIP limit that was described earlier in this section. Most agile teams will find that a value of between 5 and 10 will suit them, depending on the number of folks on the team. In the following section, you look at one level below the Feature, the product backlog.
Maintaining Product Backlogs
A product backlog is essentially a list of work that your team has identified but hasn't yet scheduled for implementation. The product backlog is a useful tool for collaborating with customers or other project stakeholders. As stakeholders request new work, you can track it in a central location on the product backlog. You can also estimate and prioritize this work, usually with input from your customers or stakeholders, to help determine which items are most important to deliver first.
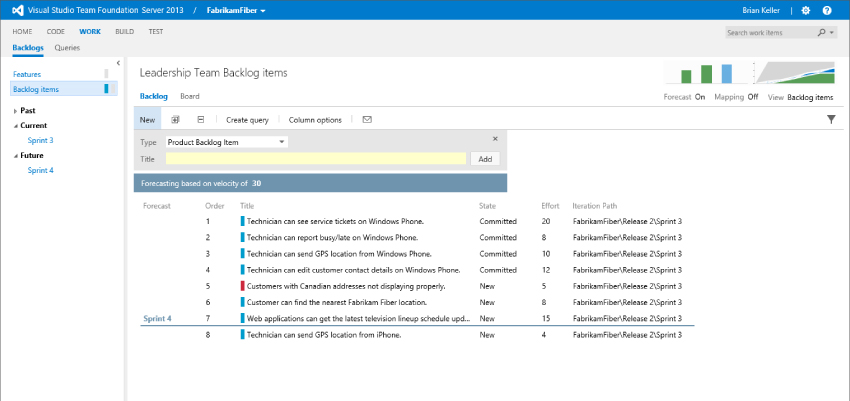
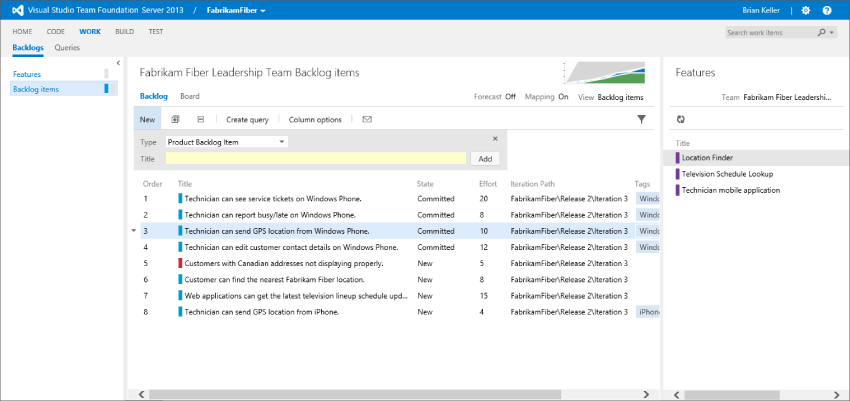
From your team's home page, click View Backlog to display your product backlog, such as the one shown in Figure 12.11. As with the portfolio backlogs, the “Quick Add” panel at the top of this page enables you to quickly enter new work as it is identified. As the Microsoft Visual Studio Scrum 2013 template allows both product backlog items and bugs to be listed on its backlog, there is a pick-list on the Quick Add panel that allows you to select the appropriate work item type.
Just like with the portfolio backlogs, you can easily reprioritize work by simply dragging and dropping it on the backlog, viewing the cumulative flow report, and splitting the columns on the Kanban board.
There are a number of tools that were added to help you manage your backlog. The first is tagging. As you can see in Figure 12.12, you can use the filter logo, on the right side, just below the Forecast button, to enable filtering. This will add a row of available filter tags that you can select. Selecting a tag will move it to the left and filter the backlog to contain only the work items that have that specific tag. You can even compound tags to tighten your filter. You can turn off the tagging by clicking the filter icon again or by removing the filter by selecting All on the left.
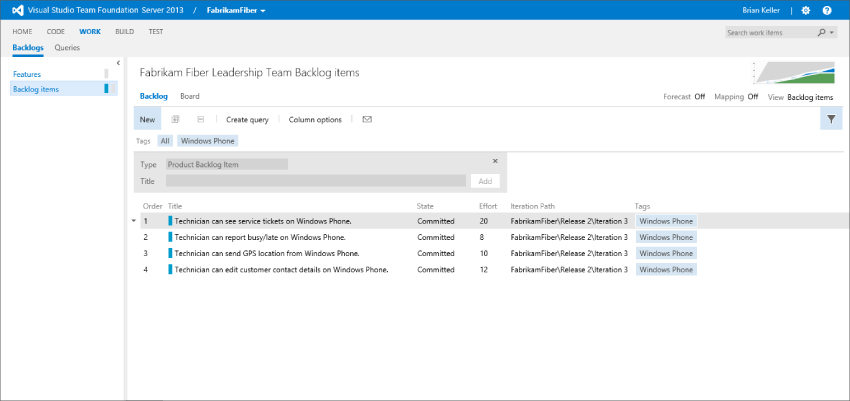
Many organizations used the tags in Team Foundation Server 2012 to create a way to visualize features or epics so that they could understand the cross-cutting concerns of their software. With the addition of the portfolio backlogs this is less necessary (although some people will still continue to use it), but it still provides value in allowing more arbitrary rather than hierarchical tagging. Displayed examples are iPhone and Windows Phone tags that allow you to filter your backlog to those items regardless of the Feature that it fulfills. The orthogonal nature of tags enables many scenarios and makes them eminently useful.
With the portfolio backlogs in place, it has become necessary to link the backlog items to the relevant parent Feature to better help with reporting and visibility of where you currently are in the development process. While product and release management teams may plan and order Features, the owner of the backlog usually has the freedom to order his work. He has to take into account the order of the parent Features. However, at the tactical level something else may have to be done first to even start achieving particular features.
To help the owner of the backlog maintain the mapping between his work and the Features above, a mapping tool was added in Team Foundation Server 2013. You can toggle a view of the parent work items, in this case, Features, on or off by clicking on the on/off link labeled Mapping in the upper-right of this page. When enabled a pop-out panel will emerge from the right, as shown in Figure 12.13. This panel shows a list of the parent items. You can then drag an item from your backlog onto an item in the mapping panel to change or create a parent/child relationship between the work items.
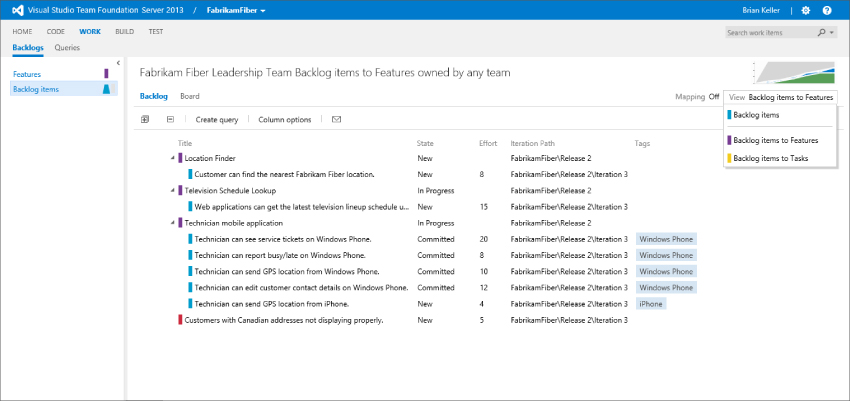
To help the backlog owner better understand the relationships with the work of product and release management above and the Development Teams below, views were introduced. Views are available on all of the backlogs. They switch your backlog view from a flat orderable list to a tree structure. You can enable and switch views by clicking View ⇒ Backlog Items and selecting the view that you want from the drop-down list. This list is context-sensitive. As you are on backlog items, you can select to look down to the child tasks, or look up to the parent features. In Figure 12.14 you can see that, with Backlog Items to Features selected, the view has changed to a tree view of parent to child. If you had more levels you would be able to, for example, select Backlog Items to Epics and see a three-level view.
Teams practicing Scrum will be familiar with a concept known as velocity. Velocity is a metric used to calculate the amount of work that a team is able to deliver for a given iteration. It is usually measured in story points on Scrum teams. Other teams may prefer to do their estimations in hours, or days, or ideal days, and so on. Regardless of the estimation technique used by your team, you can use the product backlog view to get a sense for when you will be able to deliver items on your backlog. The only requirement is to be consistent with your estimation techniques. When some people on the team are estimating in days and other people are estimating in story points, it's difficult to create consistent plans.
Toggle forecast lines on or off by clicking the on/off link in the upper-right of the page labeled Forecast. Forecast lines display, as shown in Figure 12.11, to indicate when work is estimated to be delivered based on your current team's velocity. This approach requires that you have estimated your backlog items by providing a value for effort. Do this by double-clicking each item in your backlog to provide this additional level of detail.
The Forecasting Based on Velocity Of textbox enables you to experiment with different values to see the effect that given values for velocity might have on delivering work. For example, you might be able to ask for additional funding from your customer to hire new team members and speed up the rate at which items are delivered. Or you might know that there are several upcoming holidays that will affect your team's ability to deliver. You can also click the velocity graph in the upper-right corner of this screen to see your historical velocity for the preceding (and current) iterations.
The forecast lines are purely estimates. In order to schedule work for a given iteration, you can drag and drop it onto either the current or future iterations listed on the left side of this view. When you drag and drop work onto an iteration, the value in the Iteration Path column is updated to reflect the assigned iteration, and the Iteration field is updated within the work item in Team Foundation Server.
Planning Iterations
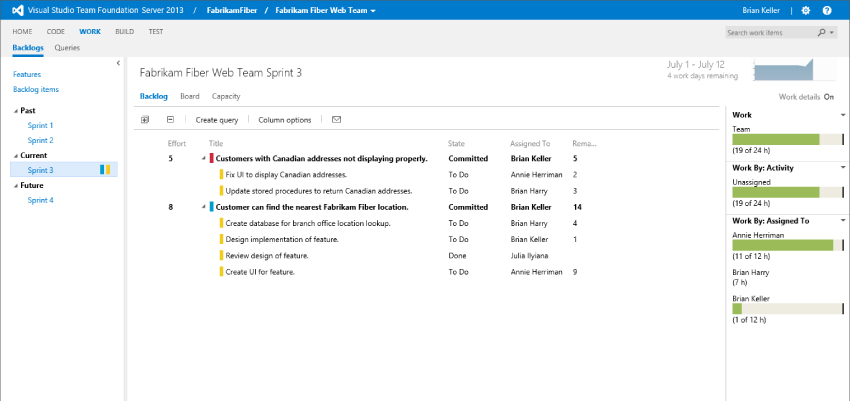
After you have identified the work that you want to deliver for a given iteration, you can click an iteration from the list on the left side of the product backlog view. This opens the iteration planning view shown in Figure 12.15. This figure shows an iteration that is mid-sprint, meaning that the team has already completed some work and is preparing to finish this iteration.
When you first add items (such as a product backlog item or bug) to an iteration, you are only declaring your intention to investigate whether it will fit within the specified iteration. The next phase of planning this work is to break it down into the individual tasks that people on your team need to complete in order to perform the work. Click the plus (+) sign next to an item in your iteration contents to display the dialog shown in Figure 12.16, which enables you to add a new task work item as a child to the parent you clicked on.
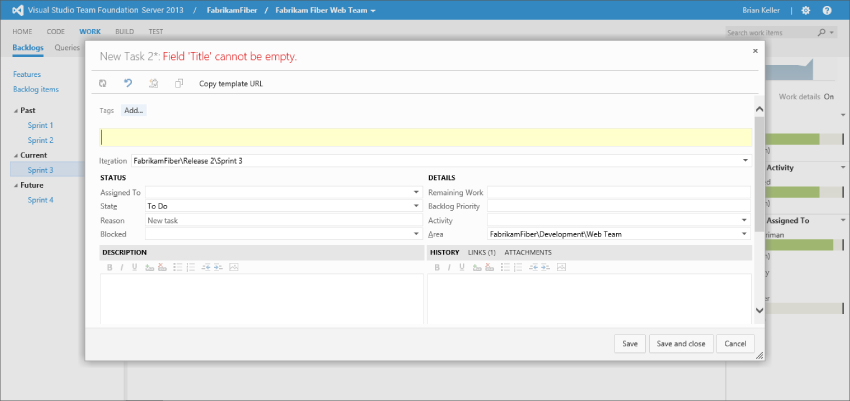
You should provide a title for this task and, if possible, an estimate for the amount of work remaining. By default, remaining work is assumed to be provided in hours, but you can also customize this (see the section called “Customization Options” later in this chapter). You can assign this to a team member who will complete this work, but you are not required to do so. Save this work item and proceed to break down the rest of your work into child tasks. If you haven't already done so, set the state of parent work items to Committed as each item is broken down and accepted into the Sprint by the Development Team.
As you begin to create tasks with values for remaining work, you will notice that the capacity graphs on the right side of this screen begin to render. These graphs are broken into three areas:
- Work—Shows the total amount of work remaining for this iteration, calculated as the sum of the remaining work across all task work items.
- Work By: Activity—Enables you to categorize the amount of remaining work into categories. When creating tasks, you can use the activity field to categorize tasks, such as Documentation, or Design, and so on. If you don't provide a value for activity, work simply shows up as unassigned.
- Work By: Assigned To—Shows the amount of remaining work that is assigned to each person on your team.
Click the Capacity tab to assign the capacity for each of the members of your team, as shown in Figure 12.17. The Capacity Per Day column enables you to specify the number of hours per day that a given resource is working on tasks. The Activity column enables you to specify the discipline of a team member, which is necessary if you want to view capacity by activity type. Finally, you can use Days Off to define days that a team member is sick or on holiday, and you can use Team Days Off to define days that the whole team will be unavailable, such as during a holiday or company retreat.
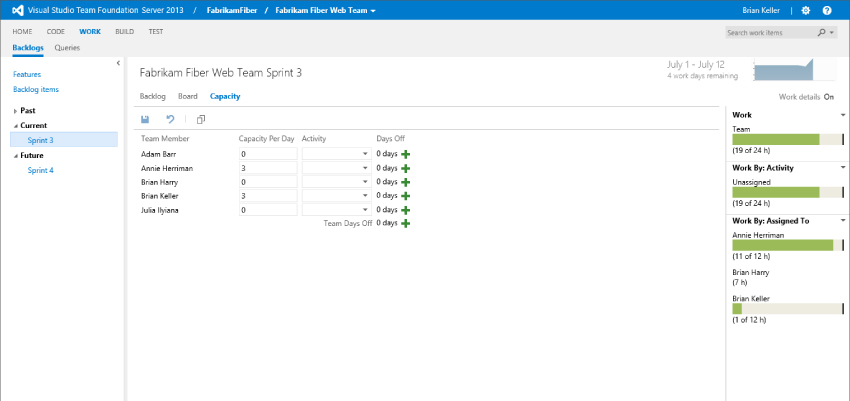
The values you enter for this table are specific to this team and this iteration. So a shared resource who works on multiple teams might have different values for Capacity Per Day or Days Off, depending on the team. Also, a resource who works five hours per day on one iteration might only work two hours per day during a subsequent iteration.
After you assign capacity values for your team, the capacity indicators on the right change to green, if a resource is at or under capacity, or red, if there is too much work given to the planned capacity. The iteration plan is designed to be viewed on a regular basis so that you can make adjustments as needed. For example, if a team member is sick, you might need to reschedule work that was originally planned for this iteration. You can drag and drop parent items from this list onto other iterations on the left side of the page.
Tracking Work
When you are satisfied with the iteration plan, it's time to start writing code, authoring documentation, designing user interfaces, and doing all the other work that's required to develop great software. During the course of this activity, it can be helpful to have a single location to easily determine the status of the work that everybody is doing.
Scrum teams typically use a task board for this purpose. In its simplest form, a task board takes the form of a whiteboard with sticky notes on it that you move from the left side of the board (work that is not yet started) to the middle (work that is in progress) to the right (completed work). This technique works very well for teams that are collocated, especially if they share a team room, because anybody can quickly look up at the whiteboard to determine the state of the team's work. Of course, this approach has its challenges for teams who work in different locations or have individual offices.
Team Foundation Server 2013 provides a digital task board that overcomes the limitations imposed by traditional physical boards. Click Board at the top of the selected iteration in Team Web Access to access the task board shown in Figure 12.18. You can view the board for any iteration by first selecting the iteration and then clicking Board.
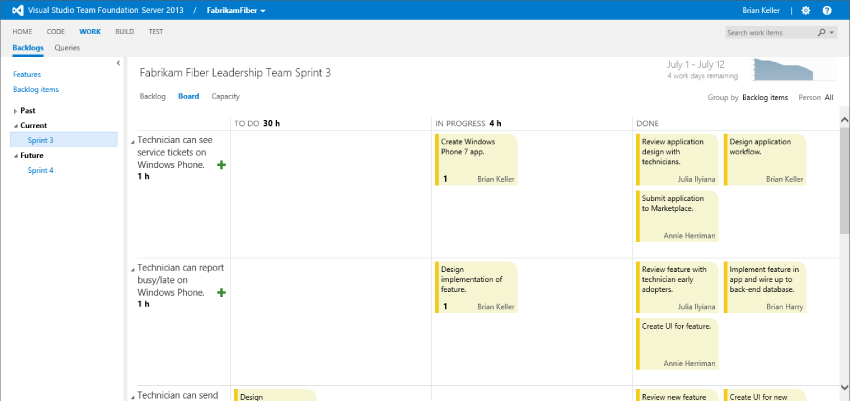
Each row on this task board represents a parent backlog item from your current iteration. The tiles on this task board represent the individual child tasks that you created. Each task begins in the To Do column. When a team member is ready to begin a task, she can drag and drop it onto the In Progress column. As she makes progress against a given task, she can click the number on the task to update the remaining work. Or if she has finished the task, she drags it into the Done column to automatically set the amount of remaining work to 0. Clicking the name of the team member for a given task opens a drop-down menu that enables you to quickly reassign work.
Double-click a task to open it in a full editor. This is often helpful if you realize that a task is going to take more time than originally estimated, and you need to increase the amount of remaining work.
The entire interface is touch-friendly. If you have a touch screen monitor, such as in a shared team room, you can configure it to display your task board and make it easy for team members to update the status of their work whenever they walk by it. And because everything is stored in Team Foundation Server, remote workers can access the same view in any modern web browser to see what their colleagues are working on and provide their own statuses.
If you find yourself constrained for space in this view, you can collapse finished backlog items by clicking the arrow to the left of the parent work item title. You can also use your browser's zoom functionality (usually Ctrl + − and Ctrl + +) to fit more work on a single screen.
You can generate a personalized view of this screen by clicking the Person: All link and selecting the name of any team member. This highlights the work that is assigned to that team member, making it easier to differentiate it from the rest of the team's work.
You can also click the Team Members tab to display a view in which tasks are organized by the team member they are assigned to, instead of by their parent work item. This is a helpful view for team meetings, where team members might be expected to tell their peers what they worked on yesterday and what they are planning on working on today. This view is also helpful for seeing whether there are any team members with too much work remaining, and whether other team members might have capacity for picking up some of that work.
As work is finished, the team can transition parent backlog items to a state of Done. Open a parent backlog item by clicking the title of the item on the left side of the screen. This state transition is not done automatically when all of the tasks are finished because there may be additional checkpoints or quality gates in place before work is considered to be truly finished. For example, you might want to request feedback from your project's stakeholders to ensure that everybody is satisfied with the work as it has been implemented.
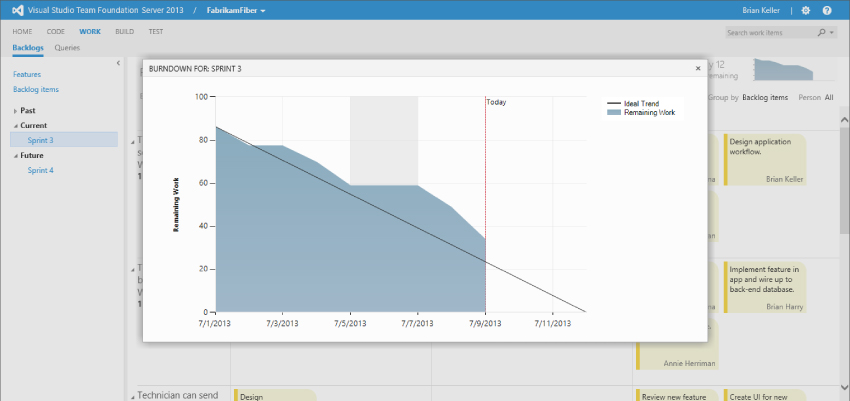
The burn-down graph in the upper-right corner of this screen displays a trend of the remaining work over time for your iteration. This graph is updated in real time as your team completes work (or identifies new work) during the course of an iteration. You can display the burn-down graph as a full screen by clicking it, as shown in Figure 12.19.
Customization Options
As mentioned previously, the examples in this chapter follow the default experience you get by using the Microsoft Visual Studio Scrum 2013 process template for a team project. If you are practicing Scrum today, then you are likely already familiar with the types of tools available in this chapter. Even if you aren't practicing Scrum or using the Scrum process template, you can still benefit from these tools.
Depending on the process template you choose, the default terminology and views might vary. For example, a team using the MSF for CMMI process template tracks requirements instead of product backlog items as the parent work item type to be planned. An MSF for CMMI task board contains four columns (Proposed, Active, Resolved, and Closed) instead of the three shown earlier for a Scrum project (To Do, In Progress, and Done).
If you are using a team project that was created using one of the process templates provided by Microsoft with Team Foundation Server 2013 (Microsoft Visual Studio Scrum 2013, MSF for Agile 2013, or MSF for CMMI Process Improvement 2013), then this tooling is preconfigured automatically to work with your team projects. If you are upgrading an existing team project from an earlier release of Team Foundation Server, then you need to perform some additional steps in order to begin using the agile planning and tracking tools mentioned in this chapter. These steps are outlined at http://aka.ms/TeamProjectUpgrade.
There are also several ways you can customize these tools to change their appearance and behavior. For example, you can:
- Add or remove fields from the “Quick Add” pane in the product backlog view. In addition to setting a title, you might also want to specify an effort estimate with each new item.
- Add or remove columns from the backlog and iteration views.
- Change the list of activities that task work items and team members can be assigned to.
- Change the working days to be used when calculating capacity and rendering the burn-down graph. By default, Saturday and Sunday are considered non-working days, but you can modify the days.
- Configure the types of work items to be used as parents and children throughout the tooling.
All of these customizations and more can be configured by following the steps outlined in the documentation at http://aka.ms/CustomizingProcess.
Summary
In this chapter, you discovered the new tools available with Team Foundation Server 2013 for planning and tracking work in an agile manner. You found out how to use the portfolio and product backlog view for defining and managing items that your team may schedule and implement in the future. You learned how to visualize that work on a Kanban board. You then saw how to break down work for an iteration into tasks and examined the remaining work for these tasks against the capacity of your team.
Finally, you learned about using the task board to track work during the course of an iteration so that everybody on the team can easily understand what their colleagues are working on and how much work is left to deliver in an iteration.
In Chapter 13 you find out how you can use the rich sets of reports and SharePoint dashboards to provide even more information that can be used to better manage your software development projects.