
Chapter 26
Web Performance and Load Testing
What's in this chapter?
- Learning how to use web performance tests to simulate user activity on your website
- Testing the capability of your website to accommodate multiple simultaneous users with load testing
- Understanding how to analyze the results of your web performance tests and load tests to identify performance and scalability bottlenecks
Wrox.com Code Downloads for this Chapter
The wrox.com code downloads for this chapter are found at www.wrox.com/go/proalm3ed on the Download Code tab. The files are in the Chapter 26 download folder and individually named as shown throughout this chapter.
This chapter continues coverage of the testing features of Visual Studio 2013 by describing web performance and load tests.
With web performance testing, you can easily build a suite of repeatable tests that can help you analyze the performance of your web applications and identify potential bottlenecks. Visual Studio enables you to easily create a web performance test by recording your actions as you use your web application. In this chapter, you find out how to create, edit, and run web performance tests, and how to execute and analyze the results.
Sometimes you need more flexibility than a recorded web performance test can offer. In this chapter, you see how to use coded web performance tests to create flexible and powerful web performance tests using Visual Basic or C# and how to leverage the web performance testing framework.
Verifying that an application is ready for production involves additional analysis. How will your application behave when many people begin using it concurrently? The load-testing features of Visual Studio enable you to execute one or more tests repeatedly, tracking the performance of the target system. The second half of this chapter examines how to load test with the Load Test wizard, and how to use the information Visual Studio collects to identify problems before users do.
Finally, because a single machine may not be able to generate enough load to simulate the number of users an application will have in production, you find out how to configure your environment to run distributed load tests. A distributed load test enables you to spread the work of creating user load across multiple machines, called agents. Details from each agent are collected by a controller machine, enabling you to see the overall performance of your application under stress.
Web Performance Tests
Web performance tests enable verification that a web application's behavior is correct. They issue an ordered series of HTTP/HTTPS requests against a target web application, and analyze each response for expected behaviors. You can use the integrated Web Test Recorder to create a test by observing your interaction with a target website through a browser window. After the test is recorded, you can use that web performance test to consistently repeat those recorded actions against the target web application.
Web performance tests offer automatic processing of redirects, dependent requests, and hidden fields, including ViewState. In addition, coded web performance tests can be written in Visual Basic or C#, enabling you to take full advantage of the power and flexibility of these languages.
Later in this chapter, you see how to add your web performance tests to load tests to ensure that a web application behaves as expected when many users access it concurrently.
Web Performance Tests versus Coded UI Tests
At first glance, the capabilities of web performance tests may appear similar to those of coded user interface (UI) tests (see Chapter 25). But although some capabilities do overlap (such as record and playback, and response validation), the two types of tests are designed to achieve different testing goals and should be applied appropriately. Web performance tests should be used primarily for performance testing, and you can use them as the basis for generating load tests. You should use coded UI tests for ensuring proper UI behavior and layout, but they cannot be easily used to conduct load testing. Conversely, whereas web performance tests can be programmed to perform simple validation of responses, coded UI tests are much better suited for this task.
Creating a Sample Web Application
Before creating a web performance test, you need a web application to test. Although you could create a web performance test by interacting with any live website such as Microsoft.com, Facebook, or YouTube, those sites will change and will likely not be the same by the time you read this chapter. Therefore, the remainder of this chapter is based on a website created with the Personal Web Site Starter Kit.
The Personal Web Site Starter Kit is a sample ASP.NET application provided by Microsoft. The Personal Web Site Starter Kit first shipped with Visual Studio 2005 and ASP.NET 2.0, but there is a version that is compatible with Visual Studio 2013 at the website for this title. If you intend to follow along with the sample provided in this chapter, first visit this book's page at www.wrox.com to download and open the Personal Web Site Starter Kit project template, following the instructions contained in the Readme.txt file.
This site will become the basis of some recorded web performance tests. Later, you will assemble these web performance tests into a load test in order to put stress on this site to determine how well it will perform when hundreds of friends and family members converge simultaneously to view your photos.
Creating Users for the Site
Before you create tests for your website, you must create a few users for the site. You do this using the Web Site Administration Tool. This tool was available directly in Visual Studio 2012, but was removed from Visual Studio 2013 due to the removal of the Visual Studio Development Server from the product. However, you can still access the tool from the command line.
To open the Web Site Administration Tool, complete the following steps:
- Open a Command Prompt.
- Navigate to the folder where IIS Express is installed on your machine (with Visual Studio 2013, this will be
C:Program FilesIIS Express). - Start an IIS Express site using the following command:
iisexpress.exe /path:c:WindowsMicrosoft.NETFrameworkv4.0.30319ASP.NETWebAdminFiles /port:[port] /clr:4.0 /ntlm. - Open Internet Explorer and navigate to
http://localhost:8082/asp.netwebadminfiles/default.aspx?applicationPhysicalPath=[apppath]&applicationUrl=/, where[apppath]is the absolute path to the Visual Studio Project folder with the solution file in it. - On the resulting page, select Security, and then select Create or Manage Roles. Enter
AdministratorsFriends
You now have two roles into which users can be placed. Click the Security tab again, and then click Create User. You see the window shown in Figure 26.1.
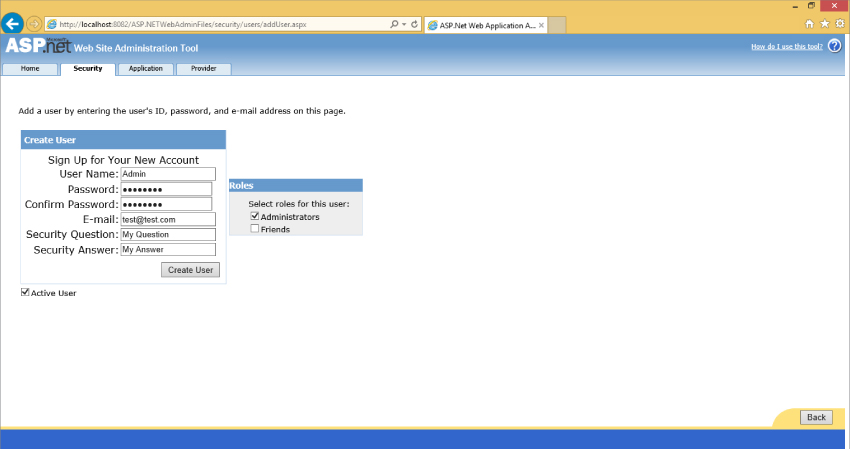
Your tests assume the following users have been created:
- Admin—In the Administrator role
- Sue—In the Friends role
- Daniel—In the Friends role
- Andrew—In the Friends role
For purposes of this example, enter @qwerty@ for the password of each user, and any values you want for the E-mail and Security Question fields.
Creating and Configuring Web Tests
There are three main methods for creating web performance tests. The first (and, by far, the most common) is to use the Web Test Recorder. This is the recommended way of getting started with web performance testing and is the approach discussed in this chapter. The second method is to create a test manually, using the Web Test Editor to add each step. Using this approach is time-consuming and error-prone, but may be desired for fine-tuning web performance tests. Finally, you can create a coded web performance test that specifies each action via code and offers a great deal of customization. You can also generate a coded web performance test from an existing web performance test. Coded web performance tests are described in the “Coded Web Performance Tests” section later in this chapter.
To create a new web performance test, you should create a new test project and add it to your solution. Right-click your solution and select Add⇒New Project. You see the Add New Project dialog, as shown in Figure 26.2. Expand either Visual C# or Visual Basic and then highlight the Test node. Choose Web Performance and Load Test Project and name your project SampleWebTestProject
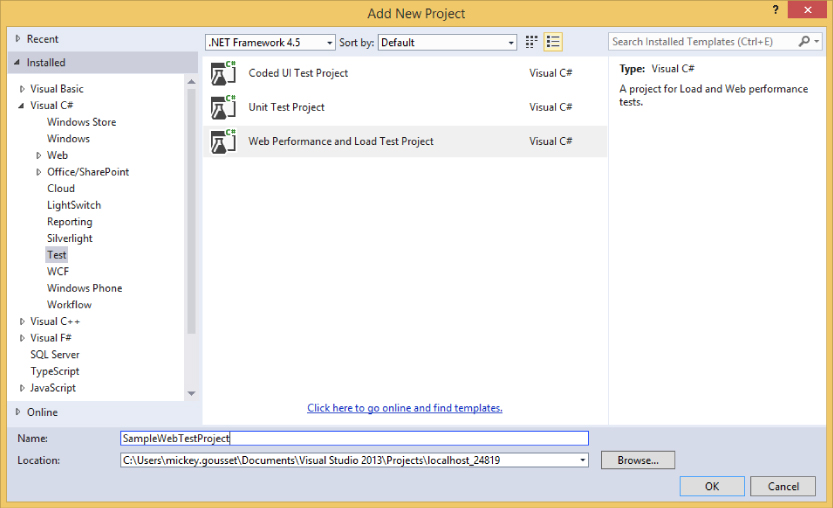
After clicking OK, your test project is created along with your first test, named WebTest1.webtest. A Local.testsettings file is also created in your Solution Items folder, which you take a closer look at later.
Recording a Web Performance Test
The ASP.NET Development Server must also be running before you can navigate to your site and record your test. If it isn't already running (as indicated by an icon in the taskbar notification area), you can start it by selecting your Personal Web Site project in Visual Studio and pressing Ctrl+F5, which builds and launches your Personal Web Site project in a new browser instance. Take note of the URL being used, including the port number. You may close this new browser instance (the Development Server continues running) and return to Visual Studio.
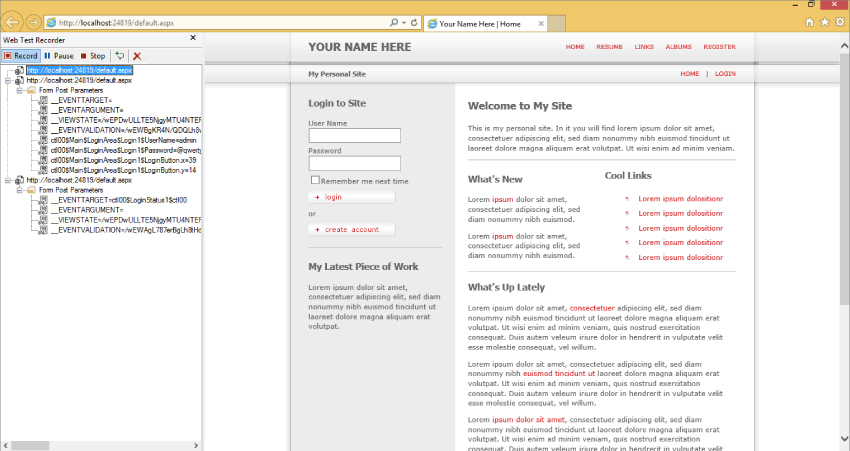
Open your empty test, WebTest1.webtest. You can use the Web Test Recorder to add web requests to this test. Click the Add Recording button (an icon of a circle within a square) within the toolbar of the web test to launch an instance of Internet Explorer with the integrated Web Test Recorder docked window. Begin by typing the URL of the application you want to test. For the Personal Web Site application on a local machine, this is something like http://localhost:5000/default.aspx. Be sure to include the default.aspx portion of the URL, along with the dynamic port number (which you learned in the previous paragraph).
Recording a web performance test is straightforward. Using your web browser, simply use the web application as if you were a normal user. Visual Studio automatically records your actions, saving them to the web performance test.
First, log in as the Admin user with the password of @qwerty@ you created earlier (but do not check the Remember Me Next Time option). The browser should refresh, showing a “Welcome Admin!” greeting. This is only a short test, so click Logout at the upper-right corner.
Your browser should now appear as shown in Figure 26.3. The steps have been expanded so you can see the details of the Form Post Parameters that were recorded automatically for you. You find out more about these later in this chapter, but for now, notice that the second request automatically includes ViewState, as well as the Username and Password form fields you used to log in.
The Web Test Recorder provides several options that may be useful while recording. The Pause button in the upper-left corner temporarily suspends recording and timing of your interaction with the browser, enabling you to use the application or get a cup of coffee without affecting your web performance test. You read more about the importance of timing of your web performance test later, as this can affect playback conditions. Click the X button if you want to clear your recorded list. The other button, Add a Comment, enables you to add documentation to your web performance test, perhaps at a complex step. These comments are very useful when you convert a web performance test to a coded web performance test, as you see later.
Configuring Web Performance Test Run Settings
When you're finished recording your web performance test, click Stop and the browser closes to display the Web Test Editor with your recorded web performance test, as shown in Figure 26.4.
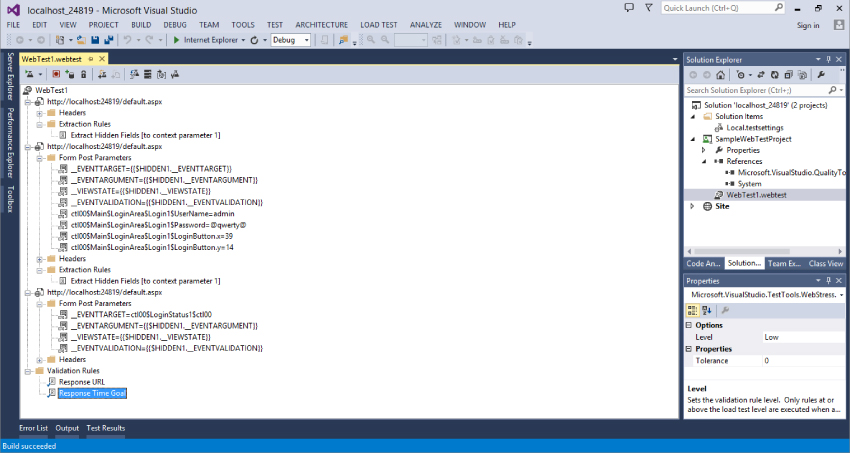
The Web Test Editor displays your test as a series of requests to be sent to the web application. The first request is the initial page being loaded. The second request is the login request being sent. And the third request is the logout request.
Frequently, you'll need to use the Web Test Editor to change settings or add features to the tests you record. This may include adding validation, extracting data from web responses, and reading data from a source. These topics are covered later in this chapter, but for now, you use this test as recorded.
Parameterizing the Web Server
You may recall from the earlier section “Configuring the Sample Application for Testing,” that using the ASP.NET Development Server is convenient, but it poses a slight challenge because the port it uses is selected randomly with each run. Although you could set your website to use a static port, there is a better solution.
Using the Web Test Editor, click the Parameterize Web Servers toolbar button. (You can hover your mouse cursor over each icon to see the name of each command.) You could also right-click the web test name and choose Parameterize Web Servers. In the resulting dialog, click the Change button. You see the Change Web Server dialog, shown in Figure 26.5.
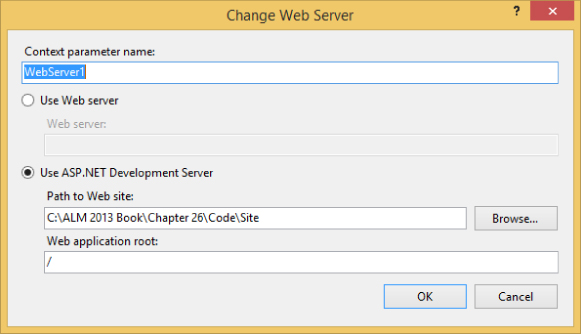
Use this dialog to configure your web performance test to target a standard web application service (such as IIS), or to use the ASP.NET Development Server. In this example, you are using the Development Server, so choose that option and browse to the path where you extracted the Personal Web Site project at the beginning of this chapter. Click OK twice.
Notice the Web Test Editor has automatically updated all request entries, replacing the static web address with a reference to this context parameter, using the syntax {{WebServer1}}. In addition, the context parameter WebServer1 has been added at the bottom of the web performance test under Context Parameters. (You see later in this chapter the effect of this on the sample web performance test in Figure 26.10.)
Now, when you run the web performance test, Visual Studio automatically finds and connects to the address and dynamic port being used by the ASP.NET Development Server. If the ASP.NET Development Server is not started, it launches automatically. If you have more than one target server or application, you can repeat this process as many times as necessary, creating additional context parameters.
Test Settings
Before you run a web performance test, you may want to review the settings that will be used for the test's runs. First select an active test settings file by clicking Test⇒Test Settings⇒Select Test Settings File. Browse to the local.testsettings file that was created when you added your test project to this solution. Now double-click this file within Solution Explorer to open it in the editor. Select the Web Test entry from the list on the left side and you see the options shown in Figure 26.6.
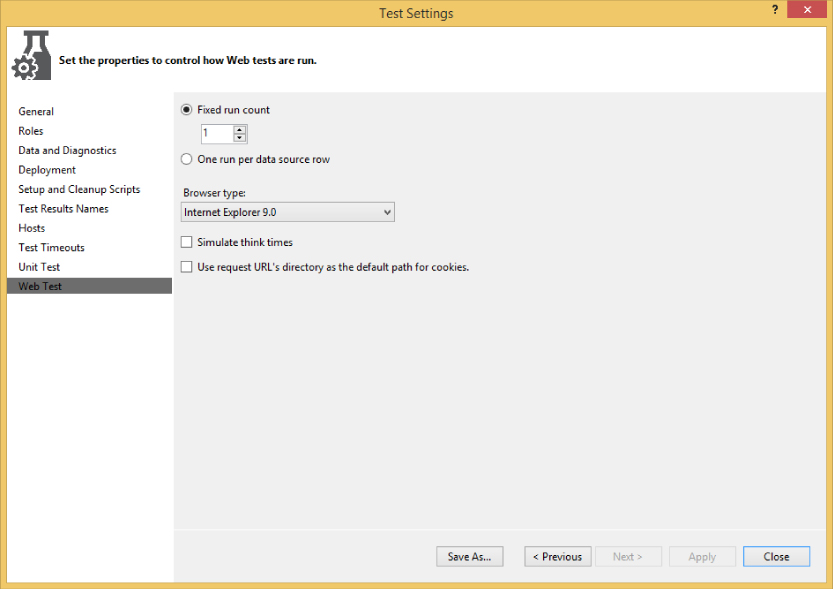
The Fixed Run Count option enables you to specify the specific number of times your web performance tests will be executed when included in a test run. Running your test a few times (for example, three to ten times) can help eliminate errant performance timings caused by system issues on the client or server and can help you derive a better estimate for how your website is actually performing. Note that you should not enter a large number here to simulate load through your web performance test. Instead, you should create a load test (discussed later in this chapter) referencing your web performance test. Also, if you assign a data source to your web performance test, you may instead choose to run the web performance test one time per entry in the selected data source. Data-driven web performance tests are examined in detail later in this chapter.
The Browser Type setting enables you to simulate using one of a number of browsers as your web performance test's client. This automatically sets the user agent field for requests sent to the web performance test to simulate the selected browser. By default, this is Internet Explorer, but you may select other browsers (such as Chrome or a smartphone).
The Simulate Think Times option enables the use of delays in your web performance test to simulate the normal time taken by users to read content, modify values, and decide on actions. When you recorded your web performance test, the time it took for you to submit each request was recorded as the “think time” property of each step. If you turn this option on, that same delay occurs between the requests sent by the web performance test to the web application. Think times are disabled by default, causing all requests to be sent as quickly as possible to the web server, resulting in a faster test. Later in this chapter, you see that think times serve an important role in load tests.
The final option in this dialog determines how cookies sent as part of a request should be retained and used for subsequent requests. Visual Studio also enables you to emulate different network speeds for your tests. From within Test Settings, select Data and Diagnostics on the left. Enable the Network Emulation adapter and click Configure. From here you can select a variety of network speeds to examine the effect that slower connection speeds have on your web application.
Running a Web Performance Test
To run a web performance test, click the Run button (the leftmost button on the Web Test Editor toolbar, as shown in Figure 26.4). The Test Results window (View⇒Other Windows⇒Test Results) displays the result of your test run.
Observing Test Execution and Results
When the test run is started, a window specific to that web performance test execution displays. If you are executing your web performance test from the Web Test Editor window, you must click the Run button in this window to launch the test. The results are automatically displayed, as shown in Figure 26.7. You can also open the test results for a specific test by double-clicking the web performance test from within the Test Results window.

You may also choose to step through the web performance test, one request at a time, by choosing Run Test (Pause Before Starting), which is available via the drop-down arrow attached to the Run button.
This window displays the results of all interactions with the web application. A toolbar, the overall test status, and two hyperlinked options are shown at the top. The first option reruns the web performance test and the second option enables you to change the browser type via the Web Test Run Settings dialog.
Below that, each of the requests sent to the application are shown. You can expand each top-level request to see its dependent requests. These are automatically handled by the web performance test system and can include calls to retrieve graphics, script sources, cascading style sheets, and more.
Each item in this list shows the request target, as well as the response's status, time, and size. A green check mark indicates a successful request and response, whereas a red icon indicates failure.
If your test encountered any errors, you can click the Find Previous Error and Find Next Error icons in the toolbar to navigate through the errors in your test run.
The lower half of the window enables you to see full details for each request. The first tab, Web Browser, shows you the rendered version of the response. As you can see in Figure 26.7, the response includes “Welcome Admin!” text, indicating that you successfully logged in as the Admin account.
The Request tab shows the details of what was supplied to the web application, including all headers and any request body, such as might be present when an HTTP POST is made.
Similarly, the Response tab shows all headers and the body of the response sent back from the web application. Unlike the Web Browser tab, this detail is shown textually, even when binary data (such as an image) is returned.
The Context tab lists all of the context parameters and their values at the time of the selected request. Finally, the Details tab shows the status of any assigned validation and extraction rules. This tab also shows details about any exception thrown during that request. Context parameters and rules are described later in this chapter.
Editing a Web Performance Test
You'll often find that a recorded web performance test is not sufficient to fully test your application's functionality. You can use the Web Test Editor, as shown in Figure 26.4, to further customize a web performance test, adding comments, extraction rules, data sources, and other properties.
Setting Request Properties
From within the Web Test Editor, right-click a request and choose Properties. If the Properties window is already displayed, simply selecting a request shows its properties. You can modify settings such as cache control, target URL, and whether the request automatically follows redirects.
The Properties window also offers a chance to modify the think time of each request. For example, perhaps a coworker dropped by with a question while you were recording your web performance test and you forgot to pause the recording. Use the Think Time property to adjust the delay to a more realistic value.
Adding Comments
Comments are useful for identifying the actions of a particular section of a web performance test. In addition, when converting your web performance test to a coded web performance test, your comments are preserved in code.
Because the requests in this example refer to the same page, it is helpful to add comments to help distinguish them. Add a comment by right-clicking the first request and choosing Insert Comment. Enter Initial site request. Insert a comment for the second request as Login and for the third request as Logout.
Adding Transactions
A transaction is used to monitor a group of logically connected steps in your web performance test. A transaction can be tracked as a unit, giving details such as number of times invoked, request time, and total elapsed time.
To create a transaction, right-click a request and select Insert Transaction. You are prompted to name the transaction and to select the start and end request from drop-down lists.
Transactions are primarily used when running web performance tests under load with a load test. Read more about viewing transaction details in the section “Viewing and Interpreting Load Test Results,” later in this chapter.
Extraction Rules and Context Parameters
Extraction rules are used to retrieve specific data from a web response. This data is stored in context parameters, which live for the duration of the web performance test. Context parameters can be read from and written to by any request in a web performance test. For example, you could use an extraction rule to retrieve an order confirmation number, storing that in a context parameter. Then, subsequent steps in the test could access that order number, using it for verification or supplying it with later web requests.
Referring to Figure 26.4, notice that the first request has an Extract Hidden Fields entry under Extraction Rules. This was added automatically when you recorded the web performance test because the system recognized hidden fields in the first form you accessed. Those hidden fields are now available to subsequent requests via context parameters.
A number of context parameters are set automatically when you run a web performance test, including the following:
$TestDir—The working directory of the web performance test.$WebTestIteration—The current run number. For example, this would be useful if you selected more than one run in the Test Settings and needed to differentiate the test runs.$ControllerNameand$AgentName—Machine identifiers used when remotely executing web performance tests. You read more about this topic later in this chapter.
To add an extraction rule to a web performance test, right-click any request and select Add Extraction Rule. The dialog shown in Figure 26.8 displays.
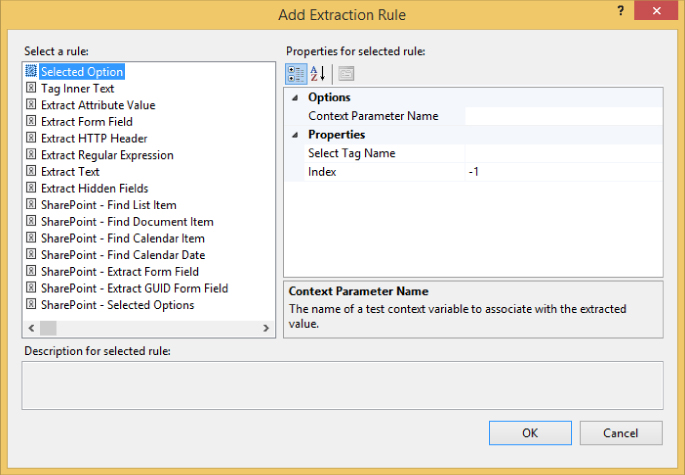
The built-in extraction rules can be used to extract any attribute, HTTP header, or response text. Use Extract Regular Expression to retrieve data that matches the supplied expression. Use Extract Hidden Fields to easily find and return a value contained in a hidden form field of a response. Extracted values are stored in context parameters whose names you define in the properties of each rule.
You can add your own custom extraction rules by creating classes that derive from the ExtractionRule class found in the Microsoft.VisualStudio.TestTools.WebTesting namespace.
Validation Rules
Generally, checking for valid web application behavior involves more than just getting a response from the server. You must ensure that the content and behavior of that response is correct. Validation rules offer a way to verify that those requirements are met. For example, you may want to verify that specific text appears on a page after an action, such as adding an item to a shopping cart. Validation rules are attached to a specific request, and cause that request to show as failed if the requirement is not satisfied.
Add a validation rule to the test to ensure that the welcome message is displayed after you log in. Right-click the second request and choose Add Validation Rule. You see the dialog shown in Figure 26.9.
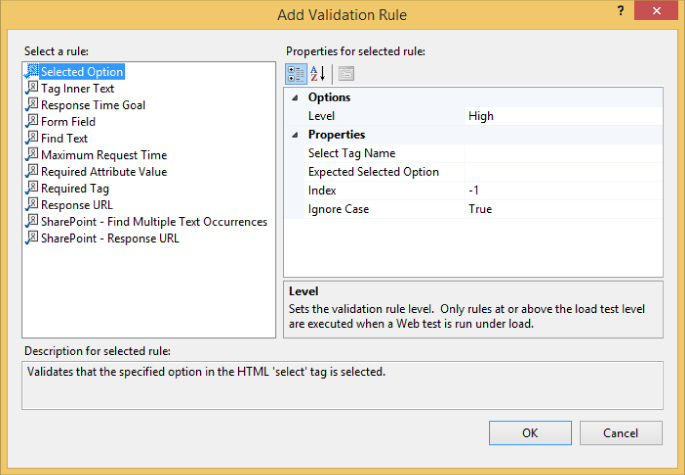
As with extraction rules, you can also create your own custom validation rules by inheriting from the base ValidationRule class, found in the WebTestFramework assembly, and have them appear in this dialog. Choose the Find Text rule and set the Find Text value to Welcome Admin. Set Ignore Case to False, and Pass If Text Found to True. This rule searches the web application's response for a case-sensitive match on that text and passes if found. Click OK. The web performance test should appear as shown in Figure 26.10.
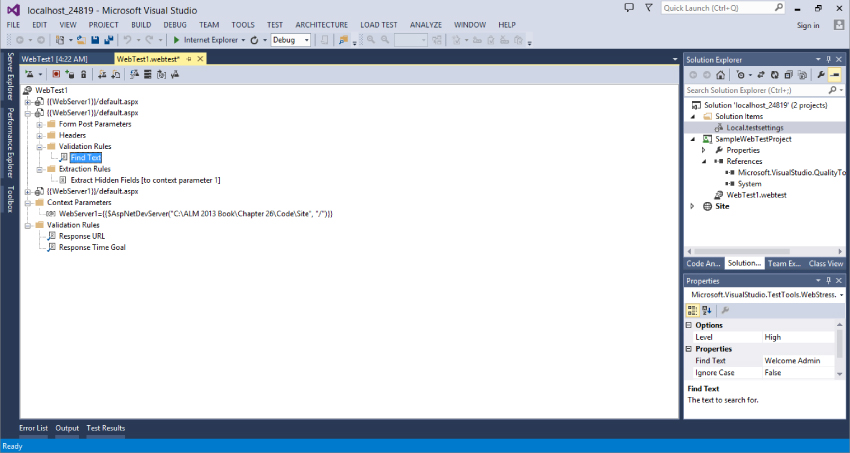
Verify that this works by running or stepping through the web performance test. You should see that this test actually does not work as expected. You can use the details from the web performance test's results to find out why.
View the Details tab for the second request. You'll see that the Find Text validation rule failed to find a match. Notice that the text of the response on the Response tab shows that instead of “Welcome Admin” being returned, there is a tab instead of a space between the words. You need to modify the validation rule to match this text.
To fix this, you could simply replace the space in the Find Text parameter with a tab. However, you could use a regular expression as well. First, change the Find Text parameter to Welcomes+admin. This indicates you expect any whitespace characters between the words, not just a space character. To enable that property to behave as a regular expression, set the Use Regular Expression parameter to True.
Save your web performance test and rerun it. The web performance test should now pass.
The functionality that extraction and validation rules provide comes at the expense of performance. If you want to call your web performance test from a load test, you might want to simulate more load at the expense of ignoring a number of extraction or validation rules.
Each rule has an associated property called Level. This can be set to Low, Medium, or High. When you create a load test, you can similarly specify a validation level of Low, Medium, or High. This setting specifies the minimum level of rule that is executed when a load test runs. For example, a validation level of Medium runs rules with a level of Medium or High, but excludes rules marked as Low.
Data-Driven Web Performance Tests
You can satisfy many testing scenarios using the techniques described so far, but you can go beyond those techniques to easily create data-driven web performance tests. A data-driven web performance test connects to a data source and retrieves a set of data. Pieces of that data can be used in place of static settings for each request.
For example, in your web performance test, you may want to ensure that the login and logout processes work equally well for all of the configured users. You find out how to do this next.
Configuring a Data Source
You can configure your web performance test to connect to a database (for example, SQL Server or Oracle), a comma-separated value (CSV) file, or an XML file. For this example, a CSV file will suffice. Using Notepad, create a new file and insert the following data:
Username,Password
Admin,@qwerty@
Sue,@qwerty@
Daniel,@qwerty@
Andrew,@qwerty@
Save this file as Credentials.csv.
The next step in creating a data-driven web performance test is to specify your data source. Using the Web Test Editor, you can either right-click the top node of your web performance test and select Add Data Source, or click the Add Data Source button on the toolbar.
In the New Test Data Source wizard, select CSV File and click Next. Browse to the Credentials.csv file you just created and click Next. You see a preview of the data contained in this file. Note that the first row of your file was converted to the appropriate column headers for your data table. Click Finish. You are prompted to make the CSV file a part of your test project. Click Yes to continue. When the data source is added, you see it at the bottom of your web performance test in the Web Test Editor, and the Credentials.csv file is added to the Solution Explorer.
Expand the data source to see that there is a new table named Credentials in your Web Test Editor. Click this table and view the Properties window. Notice that one of the settings is Access Method. This has three valid settings:
- Sequential—Reads each record in first-to-last order from the source. This loops back to the first record and continues reading if the test uses more iterations than the source has records.
- Random—Reads each record randomly from the source and, like sequential access, continues reading as long as necessary.
- Unique—Reads each record in first-to-last order, but does so only once.
Use this setting to determine how the data source feeds rows to the web performance test. For this test, choose Sequential.
Binding to a Source
Several types of values can be bound to a data source, including form post and URL query parameters' names and values, HTTP headers, and file upload field names. Expand the second request in the Web Test Editor (which you earlier labeled as Login), expand Form Post Parameters, click the parameter for UserName, and view the Properties window. Click the down arrow that appears in the Value box.
You see the data-binding selector, as shown in Figure 26.11.
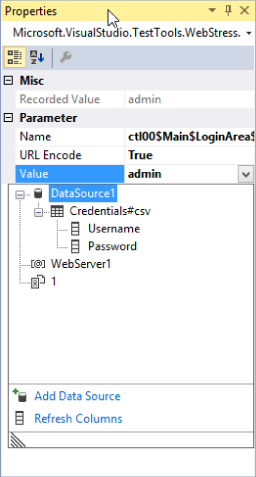
Expand your data source, choose the Credentials table, and then click the Username column to bind to the value of this parameter. A database icon appears in that property, indicating that it is a bound value. You can select the Unbind entry to remove any established data binding. Repeat this process for the Password parameter.
Before you run your web performance test, you must indicate that you want to run the test one time per row of data in the data source. Refer to the earlier section “Test Settings” and Figure 26.6. In the Web Tests section of your test settings, choose the One Run per Data Source Row option.
The next time you run your web performance test, it automatically reads from the target data source, supplying the bound fields with data. The test repeats one time for each row of data in the source. Your test should now fail, however, because you are still looking for the text “Welcome Admin” to appear after the login request is sent.
To fix this, you must modify your validation rule to look for welcome text corresponding to the user being authenticated. Select the Find Text validation rule and view the Properties window. Change the Find Text value to Welcomes+{{DataSource1.Credentials#csv.Username}} and rerun your test. Your test should now pass again.
Coded Web Performance Tests
As flexible as web performance tests are, there may be times when you need more control over the actions that are taken. Web performance tests are stored as XML files with .webtest extensions. Visual Studio uses this XML to generate the code that is executed when the web performance test is run. You can tap into this process by creating a coded web performance test, enabling you to execute a test from code instead of from XML.
Coded web performance tests enable you to perform actions not possible with a standard web performance test. For example, you can perform branching based on the responses received during a web performance test or based on the values of a data-bound test. A coded web performance test is limited only by your ability to write code. The language of the generated code is determined by the language of the test project that contains the source web performance test.
A coded web performance test is a class that inherits from either a base WebTest class for C# tests, or from a ThreadedWebTest base for Visual Basic tests. You can find these classes in the Microsoft.VisualStudio.TestTools.WebTesting namespace. All the features available to web performance tests that you create via the IDE are implemented in classes and methods contained in that namespace.
You should familiarize yourself with coded web performance tests by creating a number of different sample web performance tests through the IDE and generating coded web performance tests from them to learn how various web performance test actions are accomplished with code.
Using the example web performance test, click the Generate Code button on the Web Test Editor toolbar. You are prompted to name the generated file. Open the generated file and review the generated code.
Here is a segment of the C# code that was generated from the example web performance test (some calls have been removed for simplicity):
public override IEnumerator<WebTestRequest> GetRequestEnumerator()
{
     …
     // Initial site request
     …
     yield return request1;
     …
     // Login
     …
     WebTestRequest request2 = new
       WebTestRequest((this.Context["WebServer1"].ToString() +
       "/SampleWeb/default.aspx"));
     …
     Request2.ThinkTime = 14;
     Request2.Method = "POST";
     FormPostHttpBody request2Body = new FormPostHttpBody();
     …
     Request2Body.FormPostParameters.Add(
       "ctl00$Main$LoginArea$Login1$UserName",
       this.Context["DataSource1.Credentials#csv.Username"].ToString());
     request2Body.FormPostParameters.Add(
       "ctl00$Main$LoginArea$Login1$Password",
       this.Context["DataSource1.Credentials#csv.Password"].ToString());
     …
     if ((this.Context.ValidationLevel >=
       Microsoft.VisualStudio.TestTools.WebTesting.ValidationLevel.High))
     {
      ValidationRuleFindText validationRule3 = new ValidationRuleFindText();
      validationRule3.FindText = ("Welcome\s+" +
        this.Context["DataSource1.Credentials#csv.Username"].ToString());
        validationRule3.IgnoreCase = false;
        validationRule3.UseRegularExpression = true;
        validationRule3.PassIfTextFound = true;
     }
     …
     yield return request2;
     …
     // Logout
     …
     WebTestRequest request3 = new
       WebTestRequest((this.Context["WebServer1"].ToString() +
     "/SampleWeb/default.aspx"));
     Request3.Method = "POST";
     …
     yield return request3;
     …
}
This GetRequestEnumerator method uses the yield statement to provide WebTestRequest instances, one per HTTP request, back to the web test system.
Notice that the methods and properties are very similar to what you have already seen when creating and editing web performance tests in the Web Test Editor. Also notice that the comments you added in the Web Test Editor appear as comments in the code, making it easy to identify where each request begins.
Taking a closer look, you see that the Find Text validation rule you added earlier is now specified with code. First, the code checks the ValidationLevel context parameter to verify that you're including rules marked with a level of High. If so, the ValidationRuleFindText class is instantiated and the parameters you specified in the IDE are now set as properties of that instance. Finally, the instance's Validate method is registered with the request's ValidateResponse event, ensuring that the validator executes at the appropriate time.
You can make any changes you want and simply save the code file and rebuild.
Load Tests
Load tests are used to verify that your application performs as expected while under the stress of multiple concurrent users. You configure the levels and types of load you want to simulate and then execute the load test. A series of requests is generated against the target application, and Visual Studio monitors the system under test to determine how well it performs.
Load testing is most commonly used with web performance tests to conduct smoke, load, and stress testing of web applications. However, you are certainly not limited to this. Load tests are essentially lists of pointers to other tests, and they can include any other test type except for manual tests.
For example, you could create a load test that includes a suite of unit tests. You could stress-test layers of business logic and database access code to determine how that code will behave when many users are accessing it concurrently, regardless of which application uses those layers.
As another example, you can use ordered tests to group a number of tests and define a specific order in which they will run. Because tests added to a load test are executed in a randomly selected order, you may find it useful to first group them with an ordered test, and then include that ordered test in the load test. You can find more information on ordered tests in Chapter 23.
Creating and Configuring Load Tests
This section describes how to create a load test using the New Load Test wizard. You examine many options that you can use to customize the behavior of your load tests.
As described earlier in this chapter in the section “Web Performance Tests,” you use a test project to contain your tests, and, like web performance tests, load tests are placed in test projects. Right-click your existing test project and choose Add⇒Load Test.
When you add a new load test, the New Load Test wizard starts. This wizard guides you through the many configuration options available for a load test.
Scenarios and Think Times
A load test is composed of one or more scenarios. A scenario is a grouping of web performance and/or unit tests, along with a variety of preferences for user, browser, network, and other settings. Scenarios are used to group similar tests or usage environments. For example, you might want to create a scenario for simulating the creation and submission of an expense report by your employees, whereby your users have LAN connectivity and all use Internet Explorer 9.
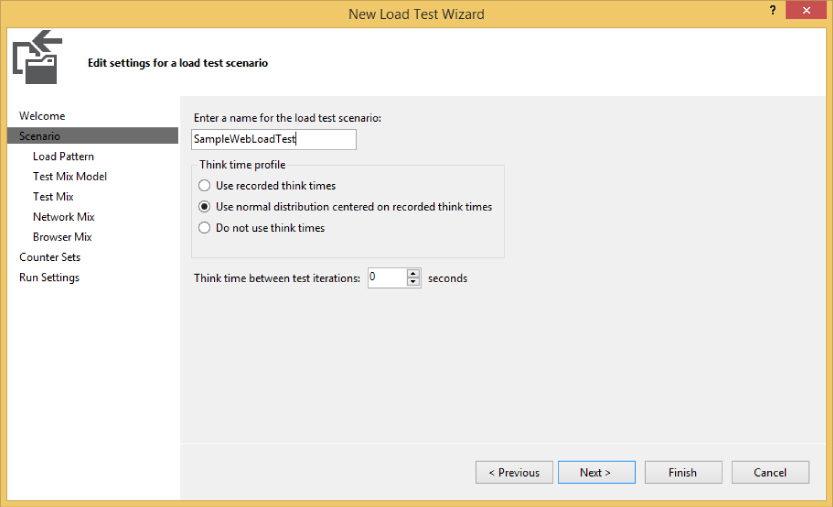
When the New Load Test wizard is launched, the first screen describes the load test creation process. Click Next and you are prompted to assign a name to your load test's first scenario, as shown in Figure 26.12.
Note that the New Load Test wizard only supports the creation of a single scenario in your load test, but you can easily add more scenarios with the Load Test Editor after you complete the wizard.
The second option on this page is to configure think times. You may recall from the earlier section “Web Performance Tests” that think time is a delay between each request, which can be used to approximate how long a user will pause to read, consider options, and enter data on a particular page. These times are stored with each of a web performance test's requests and can be hand-edited by examining the properties for each web request. The think time profile panel enables you to turn these off or on.
If you enable think times, you can either use them as is, or apply a normal distribution that is centered around your recorded think times as a mean. The normal distribution is generally recommended if you want to simulate the most realistic user load, based on what you expect the average user to do. You can also configure the think time between test iterations to model a user who pauses after completing a task before moving to the next task.
You can click any step on the left side to jump to that page of the wizard or click Next to navigate through sequential pages.
Load Patterns
The next step is to define the load pattern for the scenario. The Load Pattern tab, shown in Figure 26.13, enables simulation of different types of user load.
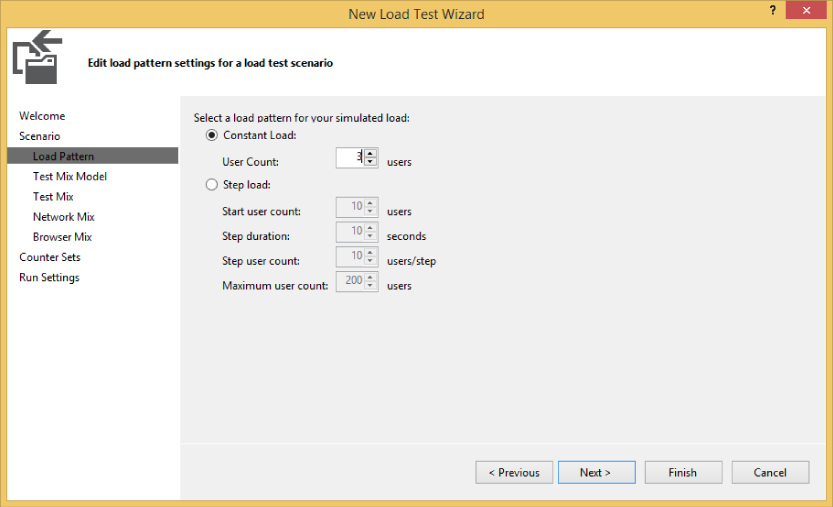
In the wizard, you have two load pattern options: Constant and Step. A constant load enables you to define a number of users that will remain unchanged throughout the duration of the test. Use a constant load to analyze the performance of your application under a steady load of users. For example, you may specify a baseline test with 100 users. This load test can be executed prior to release to ensure that your established performance criteria remain satisfied.
A step load defines a starting and maximum user count. You also assign a step duration and a step user count. Every time the number of seconds specified in your step duration elapses, the number of users is incremented by the step count, unless the maximum number of users has been reached. Step loads are very useful for stress-testing your application, finding the maximum number of users your application will support before serious issues arise.
You should begin with a load test that has a small, constant user load and a relatively short execution time. After you have verified that the load test is configured and working correctly, increase the load and duration as you require.
Test Mix Model
The Test Mix Model (shown in Figure 26.14) determines the frequency at which tests within your load test are selected from among other tests within your load test.
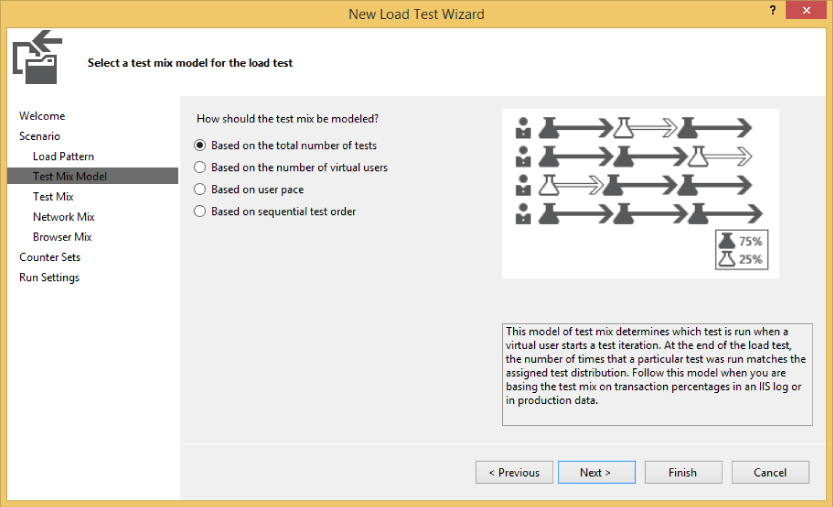
The test mix model provides several options for realistically modeling user load. The options for test mix model are as follows:
- Based on the total number of tests—This model enables you to assign a percentage to each test that dictates how many times it should be run. Each virtual user runs each test corresponding to the percentage assigned to that test. An example of where this might be useful is if you know that the average visitor views three photos on your website for every one comment that they leave on a photo. To model that scenario, you would create a test for viewing photos and a test for leaving comments, and assign them percentages of 75 percent and 25 percent, respectively.
- Based on the number of virtual users—This model enables you to assign a percentage of virtual users who should run each test. This model might be useful if you know that, at any given time, 80 percent of your visitors are browsing the catalog of your e-commerce website, 5 percent are registering for new accounts, and 15 percent are checking out.
- Based on user pace—This model executes each test a specified number of times per virtual-user per hour. An example of a scenario where this might be useful is if you know that the average user checks email five times per hour, and looks at a stock portfolio once an hour. When using this test mix model, the think time between iterations–value from the Scenario page of the wizard is ignored.
- Based on sequential test order—If you know that your users generally perform steps in a specific order (for example, logging in, then finding an item to purchase, then checking out), you can use this test mix model to simulate a sequential test behavior for all virtual users. This option is functionally equivalent to structuring your tests as ordered tests.
The option you select on this dialog affects the options available to you on the next page of the wizard.
Test Mix
Now, select the tests to include in your scenario, along with the relative frequency with which they should run. Click the Add button and you see the Add Tests dialog shown in Figure 26.15.
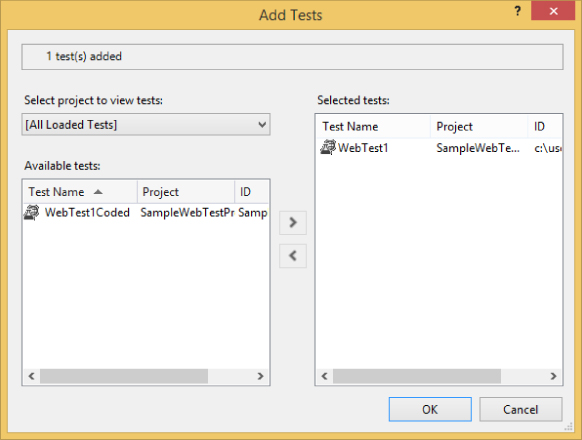
By default, all the tests (except manual tests and coded UI tests) in your solution are displayed. You can constrain these to a specific test project with the Select Project to View Tests drop-down. Select one or more tests and click OK. To keep this example simple, only add the web performance test you created earlier in this chapter.
Next, you return to the test mix step. Remember that this page varies based on the test mix model you selected in the previous step. Figure 26.16 assumes that you selected Based on the Total Number of Tests as your test mix model.
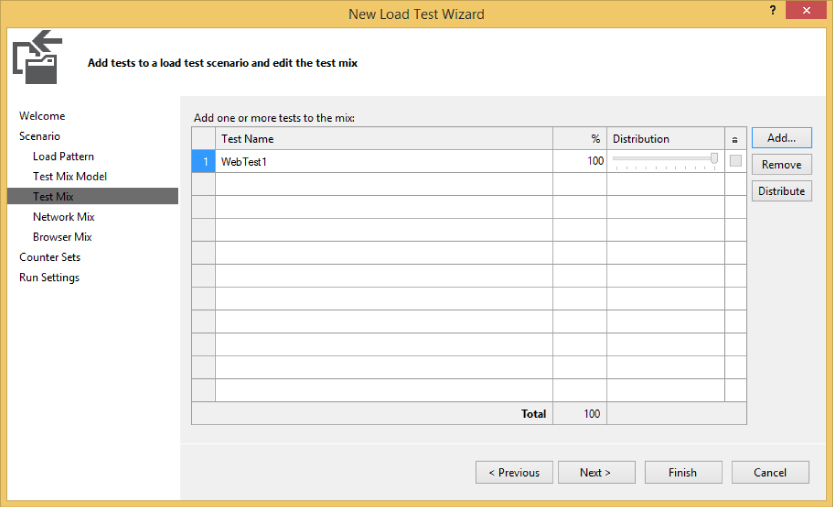
Use the sliders to assign the chance (in percentage) that a virtual user will select that test to execute. You may also type a number directly into the numeric fields. Use the lock check box in the far-right column to freeze tests at a certain number, and use the sliders to adjust the remaining “unlocked” test distributions. The Distribute button resets the percentages evenly between all tests. But, because you only have a single test in your test mix right now, there is nothing else to configure on this page, and the slider is disabled.
Network Mix
You can specify the kinds of network connectivity you expect your users to have (such as LAN, Cable-DSL, and Dial-up). This step is shown in Figure 26.17.
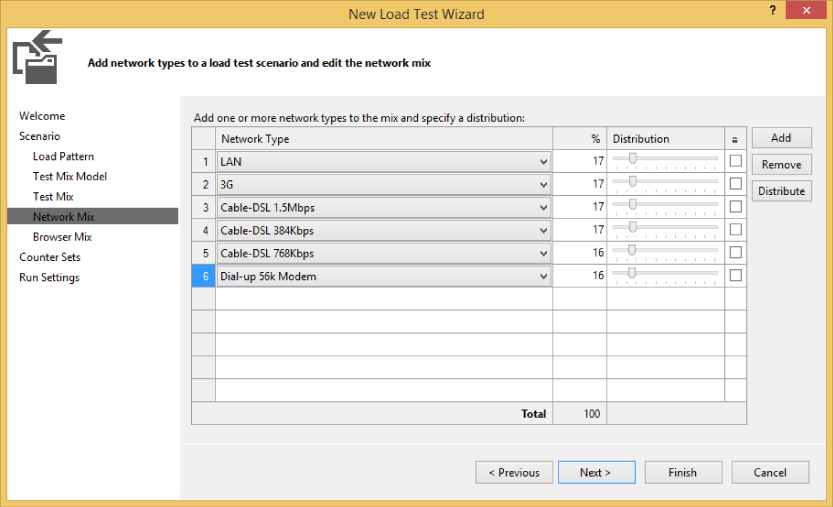
Like the test mix step described earlier, you can use sliders to adjust the percentages, lock a particular percent, or click the Distribute button to reset to an even distribution.
As with the test mix settings, each virtual user selects a browser type at random according to the percentages you set. A new browser type is selected each time a test is chosen for execution. This also applies to the browser mix described next.
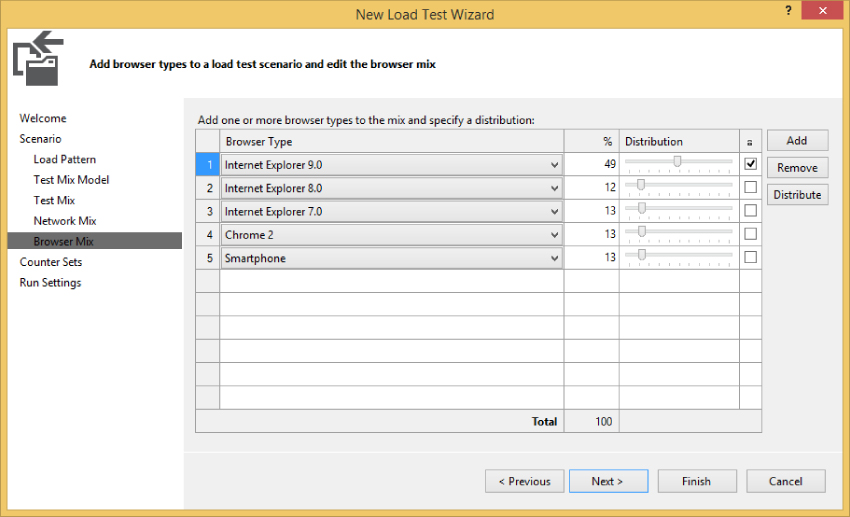
Browser Mix
The next step (applicable only when web performance tests are part of the load test) is to define the distribution of browser types that you want to simulate. Visual Studio then adjusts the headers sent to the target application according to the selected browser for that user.
As shown in Figure 26.18, you may add one or more browser types, and then assign a percent distribution for their use.
Performance Counter Sets
A vital part of load testing is the tracking of performance counters. You can configure your load test to observe and record the values of performance counters, even on remote machines. For example, your target application is probably hosted on a different machine from the one on which you're running the test. In addition, that machine may be calling to other machines for required services (such as databases or web services). Counters from all of these machines can be collected and stored by Visual Studio.
A counter set is a group of related performance counters. All of the contained performance counters are collected and recorded on the target machine when the load test is executed.
Select machines and counter sets using the wizard step shown in Figure 26.19. Note that this step is optional. By default, performance counters are automatically collected and recorded for the machine running the load test. If no other machines are involved, simply click Next.
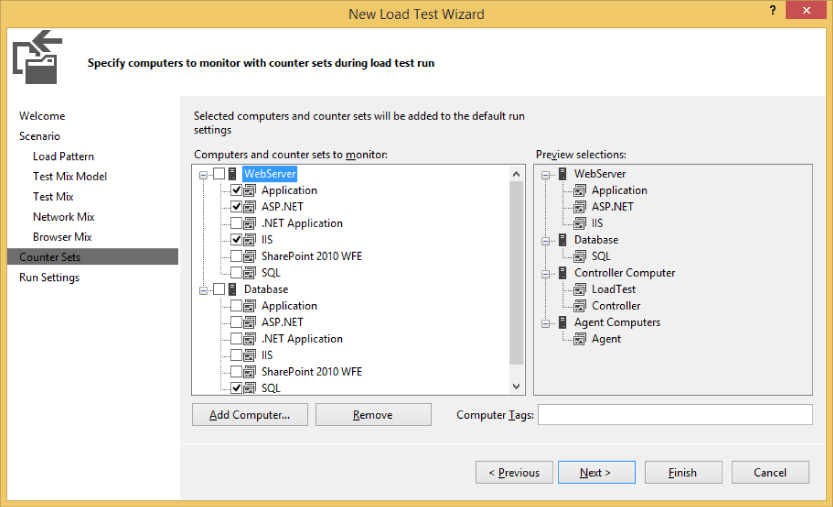
To add a machine to the list, click Add Computer and enter the name of the target machine. Then, check any counter sets you want to track to enable collection of the associated performance counters from the target machine.
Run Settings
The final step in the New Load Test wizard is to specify the test's run settings, as shown in Figure 26.20. A load test may have more than one run setting, but the New Load Test wizard creates only one. In addition, run settings include more details than are visible through the wizard. These aspects of run settings are covered later in the section “Editing Load Tests.”
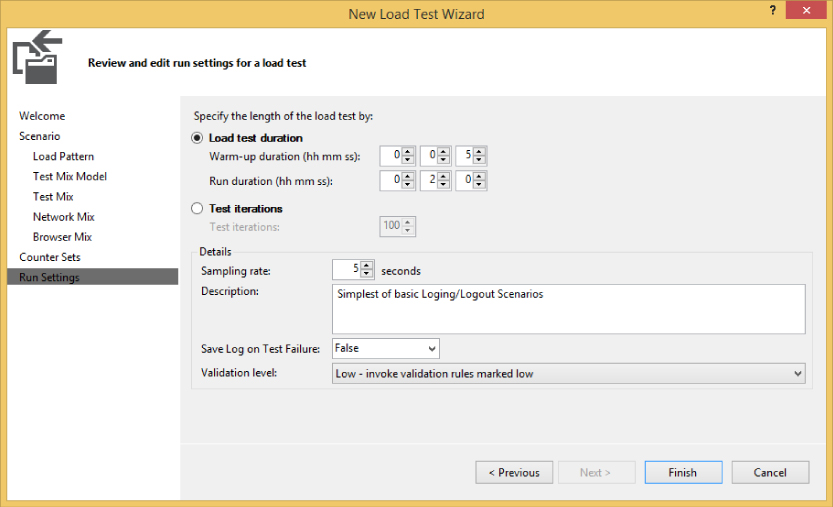
First, select the timing details for the test. Warm-up Duration specifies a window of time during which (although the test is running) no information from the test is tracked. This gives the target application a chance to complete actions such as just-in-time (JIT) compilation or caching of resources. After the warm-up period ends, data collection begins and continues until the Run Duration value has been reached.
The Sampling Rate determines how often performance counters are collected and recorded. A higher frequency (lower number) produces more detail, but at the cost of a larger test result set and slightly higher strain on the target machines.
Any description you enter is stored for the current run setting. Save Log on Test Failure specifies whether a load test log should be saved in the event that tests fail. Often, you do not want to save a log on test failure because broken tests skew the results for actual test performance.
Finally, the Validation Level setting indicates which web performance test validation rules should be executed. This is important, because the execution of validation rules is achieved at the expense of performance. In a stress test, you may be more interested in raw performance than you are that a set of validation rules pass. There are three options for validation level:
- Low—Only validation rules marked with Low level are executed.
- Medium—Validation rules marked Low or Medium level are executed.
- High—All validation rules are executed.
Click Finish to complete the wizard and create the load test.
Editing Load Tests
After completing the New Load Test wizard (or whenever you open an existing load test), you see the Load Test Editor shown in Figure 26.21.
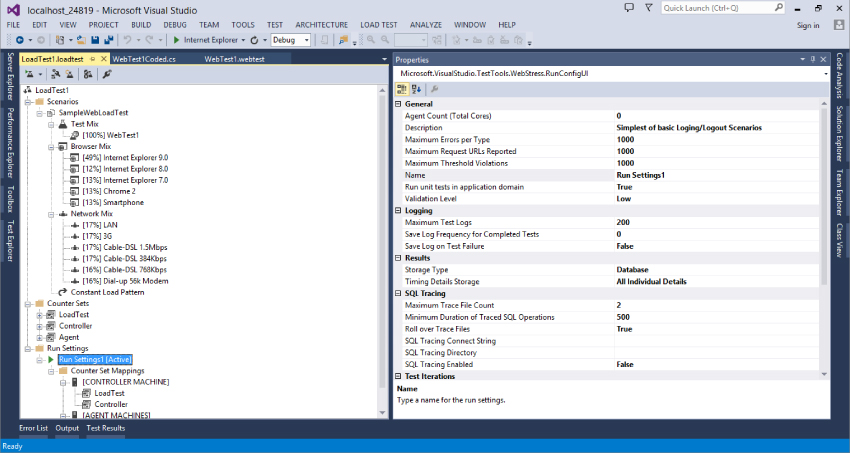
The Load Test Editor displays all of the settings you specified in the New Load Test wizard. It provides access to more properties and options than the wizard, including the capability to add scenarios, create new run settings, configure SQL tracing, and much more.
Adding Scenarios
As you've already seen, scenarios are groups of tests and user profiles. They are a good way to define a large load test composed of smaller, more specific testing objectives.
For example, you might create a load test with two scenarios. The first might include tests of the administrative functions of your site, including ten users with the corporate-mandated Internet Explorer 9.0 on a LAN. The other scenario might test the core features of your site, running with 90 users who have a variety of other browsers and who are connecting from their phones or home VPN network connections. Running these scenarios together under one load test enables you to more effectively gauge the overall behavior of your site under realistic usage.
The New Load Test wizard generates load tests with a single scenario, but you can easily add more using the Load Test Editor. Right-click the Scenarios node and choose Add Scenario. You are then prompted to walk through the Add Scenario wizard, which is simply a subset of the New Load Test wizard that you've already seen.
Run Settings
Run settings, as shown on the right side of Figure 26.21, specify such things as duration of the test run, where and if results data is stored, SQL tracing, and performance counter mappings.
A load test can have more than one run setting, but as with scenarios, the New Load Test wizard only supports the creation of one. You might want multiple run settings to enable you to easily switch between different types of runs. For example, you could switch between a long-running test that runs all validation rules, and another shorter test that runs only those marked as Low level.
To add a new run setting, right-click the Run Settings node (or the load test's root node) and choose Add Run Setting. You can then modify any property or add counter set mappings to this new run setting node.
SQL Tracing
You can gather tracing information from a target SQL Server instance through SQL Tracing. Enable SQL Tracing through the run settings of your load test. As shown in Figure 26.21, the SQL Tracing group has several settings.
First, set the SQL Tracing Enabled setting to True. Then click the SQL Tracking Connect String setting to make the ellipsis button appear. Click that button and configure the connection to the database you want to trace.
Use the SQL Tracing Directory setting to specify the path or Universal Naming Convention (UNC) to the directory in which you want the SQL Trace details stored.
Finally, you can specify a minimum threshold for logging of SQL operations. The Minimum Duration of Traced SQL Operations setting specifies the minimum time (in milliseconds) that an operation must take in order for it to be recorded in the tracing file.
Goal-Based Load Profiles
As you saw in the New Load Test wizard, you had two options for load profile patterns: Constant and Step. A third option, Goal Based, is only available through the Load Test Editor.
The goal-based pattern is used to raise or lower the user load over time until a specific performance counter range has been reached. This is an invaluable option when you want to determine the peak loads your application can withstand.
To access the load profile options, open your load test in the Load Test Editor and click your current load profile, which is either Constant Load Profile or Step Load Profile. In the Properties window, change the Pattern value to Goal Based. You should now see a window similar to Figure 26.22.
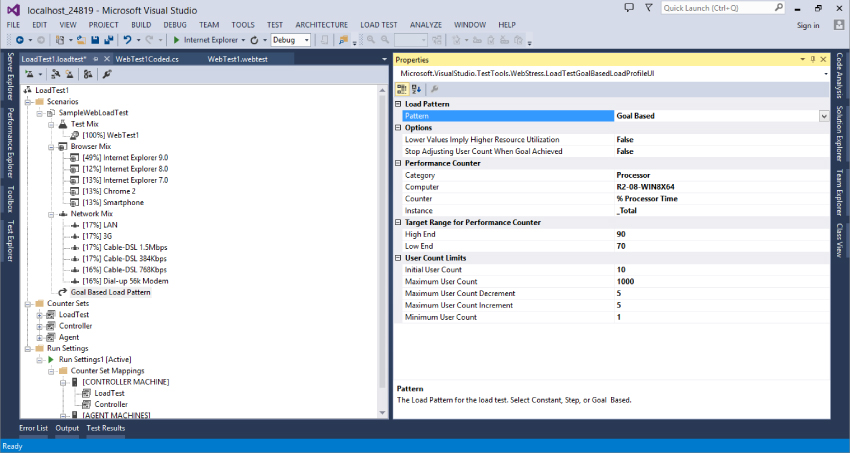
First, notice the User Count Limits section. This is similar to the step pattern in that you specify an initial and maximum user count, but you also specify a maximum user count increment and decrement and minimum user count. The load test dynamically adjusts the current user count according to these settings in order to reach the goal performance counter threshold.
By default, the pattern is configured against the % Processor Time performance counter. To change this, enter the category (for example, Memory, System, and so on), the computer from which it is collected (leave this blank for the current machine), and the counter name and instance — which is applicable if you have multiple processors.
You must then tell the test about the performance counter you selected. First, identify the range you're trying to reach using the High-End and Low-End properties. Set the Lower Values Imply Higher Resource Utilization option if a lower counter value indicates system stress. For example, you would set this to True when using the system group's Available MBytes counter. Finally, you can tell the load test to remain at the current user load level when the goal is reached with the Stop Adjusting User Count When Goal Achieved option.
Storing Load Test Run Data
A load test run can collect a large amount of data. This includes performance counter information from one or more machines, details about which test passed, and durations of various actions. You may choose to store this information in a SQL Server database.
To select a results store, you must modify the load test's run settings. Refer to Figure 26.21. The local run settings have been selected in the Load Test Editor. In the Results section of the Properties window is a setting called Storage Type, which you can either set to None or Database.
You can use your database to store data from load tests running on the local machine or even remote machines. Running remote load tests is described later in this chapter in the “Distributed Load Tests” section.
Executing Load Tests
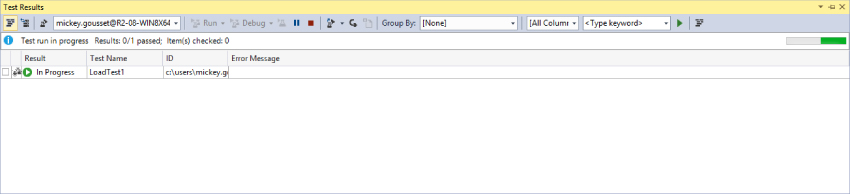
In the Load Test Editor, click the Run button at the upper-left corner, or right-click any load test setting node and select Run Load Test. You see the status of your test in the Test Results window, as shown in Figure 26.23.
Viewing and Interpreting Load Test Results
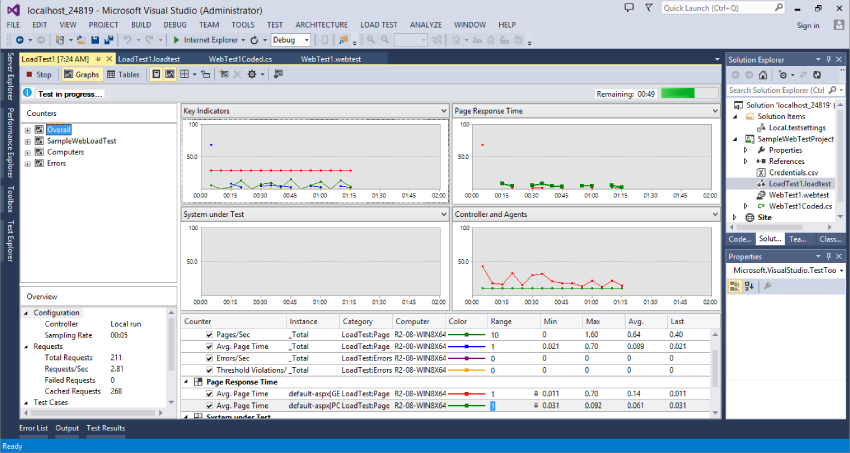
After the status of your test is In Progress or Complete, you can double-click to see the Load Test Monitor window, shown in Figure 26.24. You may also right-click and choose View Test Results Details. When a load test is run from the Load Test Editor, the Test Results window is bypassed, immediately displaying the Load Test Monitor.
You can observe the progress of your test and then continue to use the same window to review results after the test has completed.
At the top of the screen, just under the file tabs, is a toolbar with several view options. First, if you are viewing detailed information from a results store, you have a Summary view that displays key information about your load test. The next two buttons enable you to select between Graphs and Tables views. The Details (available if you are viewing detailed information from a results store) provides a graphical view of virtual users over time. The Show Counters Panel and Graph Options buttons are used to change the way these components are displayed.
Graphs View
The most obvious feature of the Load Test Monitor is the set of four graphs, which is selected by default. These graphs plot a number of selected performance counters over the duration of the test.
The tree in the left (Counter) pane shows a list of all available performance counters, grouped into a variety of sets — for example, by machine. Expand the nodes to reveal the tracked performance counters. Hover over a counter to see a plot of its values in the graph. Double-click the counter to add it to the graph and legend.
As the load test runs, the graph is updated at each snapshot interval. In addition, you may notice that some of the nodes in the Counters pane are marked with a red error or yellow warning icon. This indicates that the value of a performance counter has exceeded a predefined threshold and should be reviewed. You also see small warning icons in the graph itself at the points where the violations occurred. You use the Thresholds view to review these in a moment.
The list at the bottom of the screen is a legend that shows details of the selected counters. Those that are checked appear in the graph with the indicated color. If you select a counter, it is displayed with a bold line.
Tables View
When you click the Tables button, the main panel of the load test results window changes to show a drop-down list with a table. Use the drop-down list to view each of the available tables for the load test run. Each of these tables is described in the following sections.
Tests Table
This table goes beyond the detail of the Summary pane, listing all tests in your load test and providing summary statistics for each. Tests are listed by name and containing scenario for easy identification. You see the total count of runs, pass/fail details, as well as tests per second and seconds per test metrics.
Pages Table
The Pages table shows all of the pages accessed during the load test. Included with each page are details of the containing scenario and web performance test, along with performance metrics. The Total column shows the number of times that page was rendered during the test. The Page Time column reflects the average response time for each page. Page Time Goal and % Meeting Goal are used when a target response time was specified for that page. Finally, the Last Page Time shows the response time from the most recent request to that page.
Transactions Table
A transaction is a defined subset of steps tracked together in a web performance test. For example, you can wrap the requests from the start to the end of your checkout process in a transaction named Checkout for easy tracking. For more details, see the section “Adding Transactions,” earlier in this chapter.
In this table, you see any defined transactions listed, along with the names of the containing scenario and web performance test. Details include the count, response time, and elapsed time for each transaction.
SQL Trace Table
The SQL Trace table is enabled only if you previously configured SQL Tracing for your load test. You can find details for doing that in the “SQL Tracing” section earlier in this chapter.
This table shows the slowest SQL operations that occurred on the machine specified in your SQL Tracing settings. Note that only those operations that take longer than the Minimum Duration of Traced SQL Operations appear.
By default, the operations are sorted with the slowest at the top of the list. You can view many details for each operation, including duration, start and end time, CPU, login name, and others.
Thresholds Table
If there were any threshold violations during your test run they will be listed here. Each violation is listed according to the sampling time at which it occurred. You can see details about which counter on which machine failed, as well as a description of what the violating and threshold values were.
Errors Table
As with threshold violations, if your test encountered any errors, you will see a message such as “4 errors.” Click this text or the Errors table button to see a summary list of the errors, which includes the error type (such as Total or Exception) and the error's subtype. SubType contains the specific exception type encountered — for example, FileNotFoundException. Also shown are the count of each particular error and the message returned from the last occurrence of that error.
If you configured a database to store the load test results data, you can right-click any entry and choose Errors to display the Load Test Errors window. This table displays each instance of the error, including stack and details (if available), according to the time at which they occurred. Other information (such as the containing test, scenario, and web request) is displayed when available.
Excel Reports
If you have Excel (2007 or newer) installed, you can create a detailed Excel report from a load test run by clicking the Create Excel Report button from the toolbar. This launches a wizard in Excel that enables you to choose from a variety of reports, including reports that compare multiple load test runs against one another. This can be useful when you're examining, for example, performance regressions between one build of your application and another.
Distributed Load Tests
In larger-scale efforts, a single machine may not have enough power to simulate the number of users you need to generate the required stress on your application. Visual Studio 2013 also has a licensing restriction that limits you to simulating at most 250 users from your development environment. Fortunately, Visual Studio enables you to scale load generation across a distributed collection of machines.
There are a number of roles that the machines play in this scenario. Client machines are typically developer machines on which the load tests are created and selected for execution. The controller is the “headquarters” of the distributed load test, coordinating the actions of one or more agent machines. The controller also collects the test results from each associated agent machine. The agent machines actually execute the load tests and provide details to the controller. The controller and agents are collectively referred to as a test rig.
There are no requirements for the location of the application under test. Generally, the application is installed either on one or more machines either outside the rig or locally on the agent machines, but the architecture of distributed testing is flexible.
Installing Controllers and Agents
Before using controllers and agents, you must install the required Windows services on each machine. The Visual Studio 2013 Agents package includes setup utilities for these services. This setup utility enables you to install the test controller and test agent.
Installing the test controller installs a Windows service for the controller, and prompts you to assign a Windows account under which that service runs. Refrain from registering your test controller with a team project collection if you want to run load tests from Visual Studio. Enable the Configure for Load Testing option and select a SQL Server or SQL Server Express instance where you want to store your load test results.
After the controller service has been installed, run the Test Agent setup on each agent machine, specifying a user under whom the service should run and the name of the controller machine.
You can later configure your test controller and test agents using the respective entries on the Start Menu under Programs⇒Microsoft Visual Studio 2013. For additional instructions on configuring test controllers or test agents, consult the product documentation at http://aka.ms/VS13LoadTestRig.
Configuring Controllers
After you have run the installation packages on the controller and agent machine(s), configure the controller by first opening your .testsettings file from within Solution Explorer. Switch to the Roles tab, then change the Test execution method to Remote Execution. Now select Controllers⇒Manage Test Controllers to open the dialog shown in Figure 26.25.
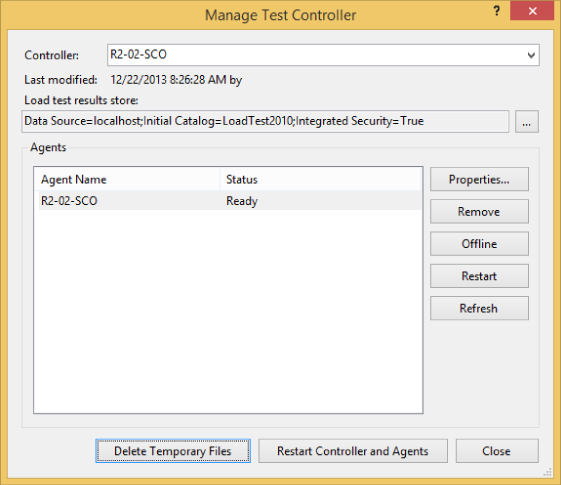
Type the name of a machine in the Controller field and press Enter. Ensure that the machine you specify has had the required controller services installed. The Agents panel then lists any currently configured agents for that controller, along with each agent's status.
Load Test Results Store points to the repository you are using to store load test data. Click the ellipsis (…) button to select and test a connection to your repository.
The Agents panel shows any test agents that have been registered with your test controller. You can temporarily suspend an agent from the rig by clicking the Offline button. Restart the agent services on a target machine with the Restart button.
You also have options for clearing temporary log data and directories, as well as restarting the entire rig.
Configuring Agents
Using the Manage Test Controller dialog just described, select an agent and click the Properties button. You can modify several settings, described in the following sections.
Weighting
When running a distributed load test, the load test being executed by the controller has a specific user load profile. This user load is then distributed to the agent machines according to their individual weightings.
For example, suppose two agents are running under a controller that is executing a load test with ten users. If the agents' weights are each 50, then 5 users are sent to each agent.
IP Switching
This indicates the range of IP addresses to be used for calls from this agent to the target web application.
Attributes
You may assign name-value attributes to each agent in order to later restrict which agent machines are selected to run tests. There are no restrictions on the names and values you can set. You can then use the Roles tab of the Test Settings editor to configure your test runs to use specific agents.
Running a Distributed Load Test
Now that you have installed and configured your rig (a controller and at least one agent machine) and modified your test run configuration to target the controller, you may execute the load test. Execute the test using any one of the options described in the earlier section “Executing Load Tests,” ensuring that the correct test settings have been selected (Test⇒Test Settings).
The controller is then signaled to begin the test. The controller contacts the (qualifying) agent machines and distributes tests and loads to each. As each test completes, the controller collects test run details from each agent. When all agents have completed, the controller finalizes the test and the test run ends, displaying your test results.
Cloud-Based Load Testing with Visual Studio Online
The previous section walked you through how to set up and configure your internal infrastructure to support large-scale load testing. As you can imagine, it can take significant time and investment to create and maintain this environment, from setting up the initial machines to managing the actual environment over time.
Microsoft recognized this as a potential issue, and has introduced a new feature as part of Team Foundation Service, which is the hosted version of Team Foundation Server found at Visual Studio Online (www.visualstudio.com). This new feature is called cloud-based load testing. Think of it as a load-testing service available in the cloud. The service will take care of setting up the agents, deploying your tests, and running your test automatically, so you can focus on what matters most: finding and fixing those performance-related issues with your application.
There are three key features to the cloud-based load-testing service:
- Simple to use—All you need is a Team Foundation Service account and Visual Studio Ultimate.
- On-demand capacity—In order for load testing to be effective, you need to generate different types of load, to simulate the real world. This service is dynamic, and makes it easy to queue and run with both a small or large number of virtual users.
- Test reuse—The tests you have created for on-premises load testing (such as the ones you learned about earlier in this chapter) will also work with cloud-based load testing.
Depending on your account type with Visual Studio Online, you get a certain number of virtual user minutes per month that can be used for load testing. You always have the option to purchase more minutes if required. Refer to your account subscription information for more information on your Visual Studio Online load-testing resources.
Running a Load Test in the Cloud
For this example, you are going to use the LoadTestInTheCloud sample project code for this chapter, which you can download from the Wrox website. This project is a simple test project that contains one web test, called TestALMRocks.webtest, and one load test, called LoadTestALMRocks.loadtest. TestALMRocks.webtest simply navigates to www.almrocks.com, and clicks through a couple of links on the site. The LoadTestALMRocks.loadtest uses the previous web test to test the website, using a step-load pattern. It starts with 10 users, and then adds 10 more users every 30 seconds, until it gets to 50 users. The load test will run for five minutes. All of that should have made sense to you if you've read the previous sections in this chapter.
Configuring your load test to run in the cloud is easy. Double-click the Local.testsettings file in Solution Explorer to open the Test Setting window. On the General tab, at the bottom, is a test run location section with two radio buttons, shown in Figure 26.26.
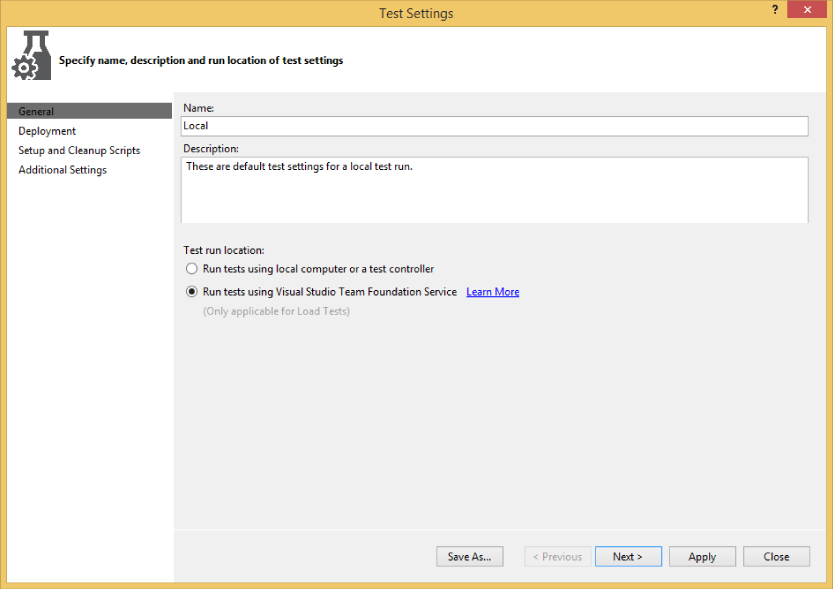
The first radio button, Run Tests Using Local Computer or a Test Controller, is the default value. This is what your test settings file needs to be set to in order to run load tests from your local machine, or using your internal distributed load-testing environment. Selecting the other radio button, Run Tests Using Visual Studio Team Foundation Service, allows you to execute your load test in the cloud. Notice the tabs on the left change depending on whether you are executing your test locally or in the cloud.
The Deployment tab allows you to specify any directories or files that need to be deployed to assist with the tests. The Setup and Cleanup Scripts tab allows you to specify appropriate setup and teardown scripts. Finally, the Additional Settings tab allows you to run the tests in a 32-bit or 64-bit process.
To execute the load test, click the Run Load Test button in the load test toolbar, just like you would a regular load test. Visual Studio will use the existing connection to a Team Foundation Service account to automatically connect and run your tests on the service. The agent is automatically created and the load test executes. A new tab will open in Visual Studio, allowing you to track the progress of the load test while it runs. This is shown in Figure 26.27.
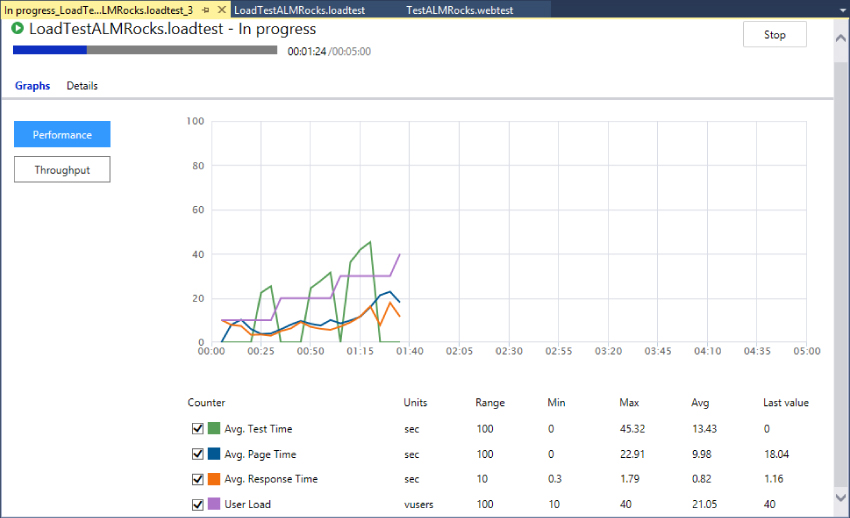
When the load test has finished executing, the title of the tab in Figure 26.27 will change to contain the word “Completed.” You can download the load test report by clicking the Download Report link that now appears on the tab. Once the report has been downloaded, click the View Report link to open it. This provides a load test results report, similar to Figure 26.24.
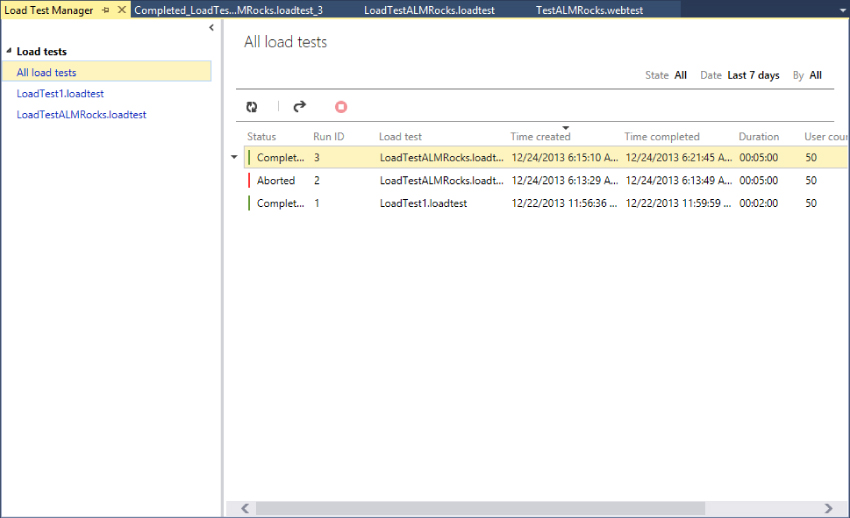
You can also use the Load Test Manager window to view the results of your load test at any time. From the main menu in Visual Studio, select Load Test⇒Load Test Manager to open the Load Test Manager window, shown in Figure 26.28. This window allows you to view the results of any load test runs, started by any member of your team, whether performed on-premises or in the cloud. You can also filter the test runs by state, date, or by user who created the test run.
Summary
This chapter described web performance and load tests in detail. You first learned how to use the Web Test Recorder to easily record a new web performance test. You then learned how to use the Web Test Editor to finely tune the web performance test, adding features such as validation and extraction rules. You also looked at coded web performance tests, which enable you to create very flexible tests.
The next section introduced load tests, which can be composed of any automated testing type, such as web performance and unit tests. You learned how to use the Load Test wizard to create an initial load test. You then used the Load Test Editor to add scenarios, SQL tracing, and other options not available through the wizard.
You then saw the power of the Load Test Monitor, used to graphically view performance counter details as well as errors, transactions, SQL operations, and more.
Finally, you learned how to run load tests in a distributed environment. You now know how to install and configure the controller and agent machines, and how to use the controller to parcel out load to the agent machines, collecting results in the test repository. You also learned about load testing in the cloud, and how Visual Studio Online makes it very easy to perform distributed load testing.
In Chapter 27, you find out how you can use the lab management capabilities of Visual Studio 2013 to help you establish physical and virtual test labs. Test labs are a powerful way of managing multiple environments with which to stage builds of your software, run automated and manual tests, and help developers reproduce and diagnose bugs.