
Chapter 18
Introduction to Software Development
What's in this chapter?
- Learning about application lifecycle management features of most interest to developers in Visual Studio 2013
- Learning how My Work surfaces the most important items
- Managing interruptions using suspend and resume
- Seeking peer feedback on code using new code review capabilities
Visual Studio originally came into popularity in the 1990s by providing individual developers with the tools they needed to build great software. Most applications in that timeframe were created by individuals or relatively small teams working at a common location. However, over the course of many years, organizations developed increasingly larger and more complex code bases. The code is typically edited by a number of developers from all over the world, and teams must embrace rapidly changing requirements in order to keep up with the pace of business opportunities.
Simply having the tools at your disposal to create applications as an individual developer is no longer enough. You need tools to analyze large code bases, and to identify hot spots that might be causing you problems. You need tools that will provide you with the confidence that the application will still work after making your changes and will be more efficient, and the quality of the code will improve as your team matures. This is where Visual Studio 2013 comes in.
Visual Studio 2013 is also very useful for new “green field” development, on the occasion that you are starting a project from scratch. From day one you can use the same tools that help you work with large code bases to ensure that all newly created code maintains the same standards you envisioned during the project kick-off meeting. As the code base grows, and more developers come onto the project, you can ensure that you are not spending time prematurely optimizing code, but rather easily identifying new performance bottlenecks as they occur.
Visual Studio 2013 provides developers of both managed and unmanaged code with a set of advanced tools for identifying inefficient, insecure, or poorly written code. You can specify coding best practices, and ensure that those are checked with every build, as well as ensuring that the code is fully tested every time.
With Visual Studio 2013, Microsoft also recognizes that the transition to Agile planning comes at a price with regard to helping developers stay “in the zone” writing code. A developer who is agile might be frequently changing context from one priority to the next. In this chapter you learn about the new suspend and resume capabilities, which can help developers more efficiently manage their development workspaces during the transitions.
You also learn about how Visual Studio 2013 and Team Foundation Server 2013 introduce code review tooling that facilitates peer review of source code in a transparent, traceable manner.
The chapters in this part of the book dive deeper into the additional functionality provided by Visual Studio 2013 for the developer.
What's New for Developers in Visual Studio 2013
Visual Studio 2013 introduces hundreds of new and improved features for developers. Across Visual Studio you will find improvements to languages, frameworks, project types, usability, performance, extensibility, documentation — the list goes on and on. This book is by no means comprehensive across all of these categories. However, there are several categories of new and improved application lifecycle management capabilities that relate directly to developing complex software in team environments, which are covered in this section, including the following:
- Unit testing experience
- Code analysis, code metrics, and code clone analysis
- CodeLens
- Profiling and performance
- Advanced debugging with IntelliTrace
- Lightweight code commenting
- My Work view, which includes suspending and resuming work and facilitating code reviews
Unit Testing
Unit testing is a popular approach for improving code quality by writing small tests that validate small blocks of code. Unit tests are especially important in complex or evolving code bases, where one small change may have cascading consequences on functionality elsewhere in the code base. By writing and maintaining a suite of unit tests, developers can quickly be alerted that a change they just made affected a piece of functionality that was previously working correctly.
Visual Studio 2013 includes a few new features around unit testing. You can now create and save a list of tests that you want to run or view as a group. This list of tests is called a playlist. When you select a playlist, the tests in the list are displayed in the Test Explorer window. You can add a test to more than one playlist, and all tests in your project are available when you choose the default All Tests playlist. The Test Explorer window also provides enhanced filtering and grouping options to make it easier to organize and execute unit tests.
Also, the new CodeLens feature (discussed in Chapter 20), allows you to find unit tests and their status without leaving the editor. This feature allows you to review and run unit tests for specific code sections, as well as see the change history for a specific unit test definition.
The overall experience for viewing, running, and debugging tests has also been improved. You learn all about the improvements to unit testing with Visual Studio 2013 in Chapter 19.
Code Analysis
Code analysis warnings now appear in their own tool window, the Code Analysis window. This window makes it easy to view, manage, and resolve any code analysis warnings related to your code. Visual Studio 2013 also added categories for the native code analysis rules, and exposes the existing managed code analysis categories in the Code Analysis window. This allows you to group your warnings in a more fine-grained way, and can be helpful when dealing with a large list of warnings. Chapter 20 focuses on code analysis.
CodeLens
CodeLens is a new feature of Visual Studio 2013 that shows you information about your code directly in the code editor. Using CodeLens, you can see references, linked Team Foundation Server Items, and unit test information, all within the context of your code. Chapter 20 gives you a detailed look at the features of CodeLens.
Profiler
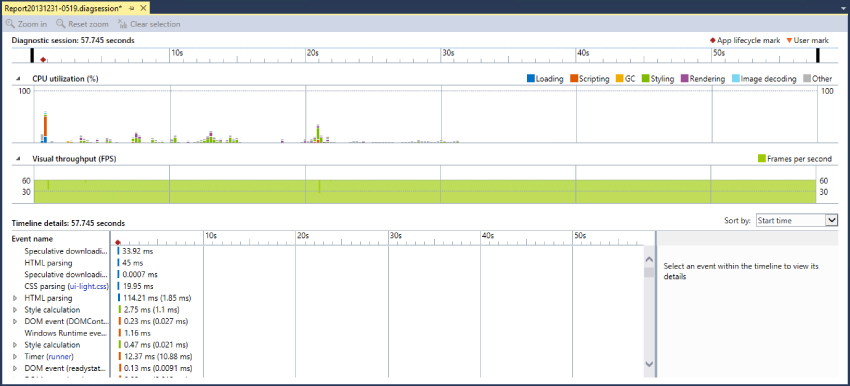
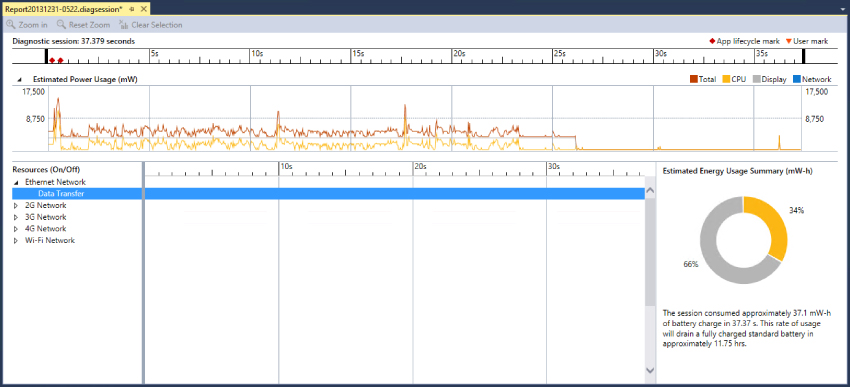
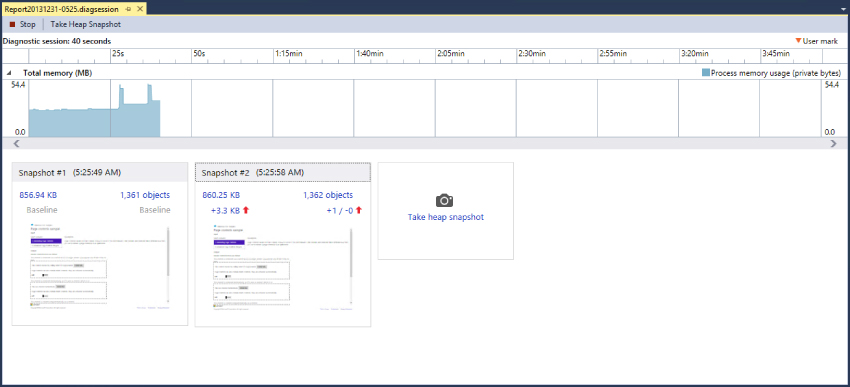
The Visual Studio 2013 profiler enables you to pinpoint possible performance bottlenecks within your application. You can use the profiler while running your application or while running tests. You can even capture performance baselines to help you easily determine if performance is getting better or worse as you check in new code. Visual Studio 2013 introduces the Performance and Diagnostic Hub, which provides a single launch point for all your profiling needs. Chapter 21 covers the use of the Visual Studio 2013 profiler in more detail. In Figure 18.1, Figure 18.2, and Figure 18.3, you can see examples of some of the new profiling reports. Figure 18.1 contains the HTML UI Responsiveness report; Figure 18.2 contains the Energy Consumption report; and Figure 18.3 contains the JavaScript Memory report.
Advanced Debugging with IntelliTrace
IntelliTrace is an advanced debugging capability introduced in Visual Studio 2010 that enables you to capture a full historical stack trace of an application's execution. It's very helpful to “rewind” the debugger and understand the historical state of your application. Developers could use IntelliTrace whenever they debugged a local application, or testers could enable IntelliTrace in test environments so that an IntelliTrace file could be attached to a bug — which further aided the developer to understand exactly what took place when diagnosing the issue.
With Visual Studio 2013, Microsoft has extended the usefulness of IntelliTrace by enabling organizations to capture traces from applications running in production environments. This provides developers with greater insights into bugs coming from production environments and enables teams to again improve the overall health and quality of their code. This functionality is provided through the use of a new tool, the Microsoft Monitoring Agent.
IntelliTrace is covered in depth in Chapter 22.
Lightweight Code Commenting
Lightweight code commenting is a new feature in Team Foundation Server 2013 that allows you to add comments to a specific file in version control, using only a web browser. To get started with lightweight code comments, open a web browser and navigate to the Team Web Access site of your team project. Once there, click the Code tab at the top of the page, then select the Changesets subtab. This allows you to see the different changesets checked into Team Foundation Server. Selecting a changeset displays detailed information about the changeset, including all the files contained in it, and the details of what was changed within each file.
You have the capability to leave a comment for the entire changeset by selecting the changeset, then clicking the Comment button on the toolbar. Users can click a reply link in the comment to respond to it, allowing a chained conversation to begin. It's similar to a message board.
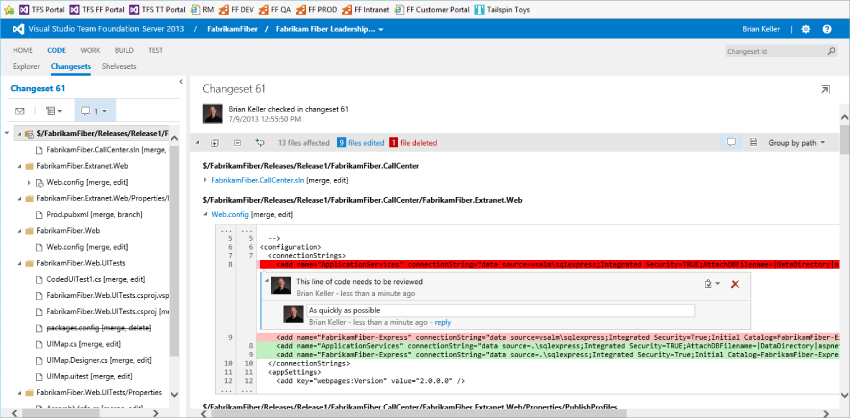
You can also comment on a specific file. To do this, select the file in the changeset. Move your mouse over the line of the file that you want to comment on. You will see a Comment button appear to the left of the line number. Clicking this button opens a new comment, tied to that specific file and line of code. Figure 18.4 shows a screenshot of lightweight code comments.
My Work
In previous chapters you worked with Team Explorer, which is the interface within Visual Studio that provides developers with access to Team Foundation Server (source control, work items, builds, reports, and so on). You may have noticed an area of Team Explorer titled My Work. My Work provides developers with a personalized view into the work that matters most to them.
To open My Work, open Visual Studio ⇒ Team Explorer. If Team Explorer is not visible, click View ⇒ Team Explorer. Click the Home icon if you are not already at the Team Explorer home page. Click My Work to see a view similar to that shown in Figure 18.5.
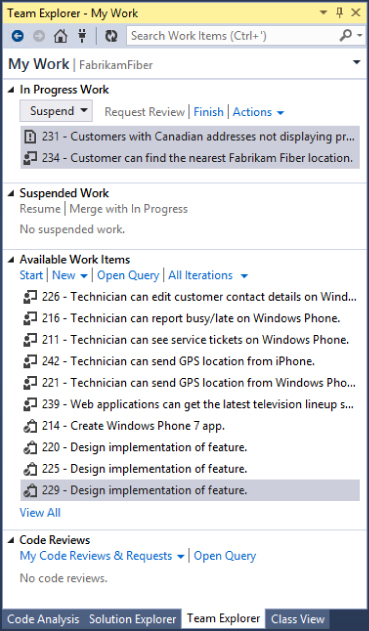
My Work shows a personalized view for each developer. Using My Work, a developer can:
- See work in progress, including pending changes
- Suspend and resume work (more on this later in this chapter)
- View any work items that are currently assigned to him
- Request code reviews and respond to code review requests from others (more on this later in this chapter)
Suspend and Resume
With Visual Studio 2013, Microsoft provides an easy way for developers to suspend their in-progress work if they get interrupted. An interruption might be an important bug fix that a developer needs to make, or it could simply be that the developer is shutting down her machine for the evening.
Interruptions have historically been very costly for developers. Team Foundation Server has always made it easy to quickly shelve file edits for later, but for a developer to be productive it often means setting breakpoints, declaring watch variables, and opening several specialized tool windows from within Visual Studio. Thankfully, the new suspend and resume capabilities are designed to help developers preserve all of this state information and then quickly get back in the zone when they are ready to resume this work.
Refer to the top of the My Work pane in Figure 18.5; note that there are two work items in progress. If this developer gets interrupted, he can quickly press Suspend & Shelve to back up all the pending changes as a shelveset on Team Foundation Server 2013 and take note of the Visual Studio 2013 environment. The suspended work appears in the Suspended & Shelved Work section of the My Work page. When the developer is ready to work on this again, he can simply click Resume. Visual Studio unshelves the pending file edits, resets any breakpoints, and opens all the same files and tool windows (even across multiple monitors). This can be a very valuable tool for developers to quickly switch context with minimal overhead.
Code Review
Most seasoned developers have grown to appreciate the value of peer reviews of source code. Code reviews are quite simply a process whereby developers inspect each other's changes to look for possible bugs or missed optimizations prior to committing those changes to the repository. Code reviews are also a great way to teach junior developers, and it provides a way to educate more people on your team about sections of your code base that they may not otherwise be exposed to.
Code reviews have now been built into Visual Studio 2013 and Team Foundation Server 2013 to facilitate this process. One advantage of using these tools to facilitate code reviews is that they become traceable and reportable — a team can audit a code change later on to discover whether it was properly reviewed before being committed. By managing code reviews with Team Foundation Server, it also means that team members who are geographically distributed can easily participate in code reviews without the need to meet in person or on a teleconference.
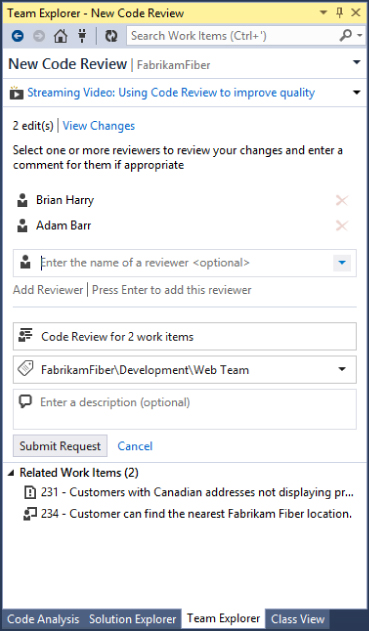
To initiate a code review, click Request Review within the My Work pane of Team Explorer. You are presented with a dialog similar to what's shown in Figure 18.6. You can specify one or more team members who should be asked to review this code, along with a title and description for the code review. Any related work items that were in progress from your My Work view are automatically associated with this code review request as well, which can provide additional context for the reviewers into the intended edits. Click Submit Request when you are finished. You return to the My Work view, and a new Code Review Request work item appears in your Code Review & Requests category of this view. You can monitor this Code Review Request work item to see its status.
Likewise, your team members see your Code Review Request work item in their My Work view. When they open this code review request, they see a dialog similar to Figure 18.7.
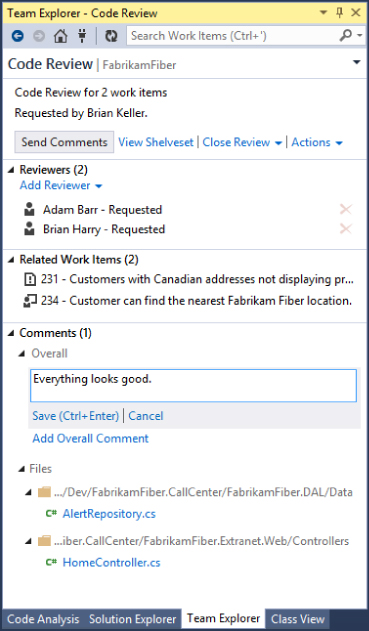
This dialog includes several pieces of functionality:
- Send Comments enables you to save your in-progress comments for this code review. This is primarily intended to be used when you want to have a dialogue with the person who submitted the code review request, such as to ask clarifying questions before you continue your review.
- The Accept and Decline links enable you to indicate to others whether you will work on this request. For quick code reviews, there is no need to formally click Accept for a code review, but doing so is helpful to signal to others that you are working on a longer code review or you plan to work on it later.
- Send & Finish submits your code review and removes it from your list of pending code reviews. Use this when you are finished with your code review.
- Add Reviewer enables you to add other people from the team to this request. Use this when you are unable to complete a code review request or when you know that another team member has expertise for a specific type of code change.
- There are three levels of comments that you can leave as part of a code review. Overall comments are meant to capture impressions of the overall set of changes being reviewed. You can leave file-level comments by right-clicking any given file and clicking Add File Comments. You can also open any file, select some text, right-click the text, and select Add Comment to leave line-level comments. These three levels of comments enable you as a reviewer to be very specific with the type of feedback you are giving to the originator. The check boxes next to each file also provide you with an easy way to ensure that you have reviewed each file in the Code Review Request.
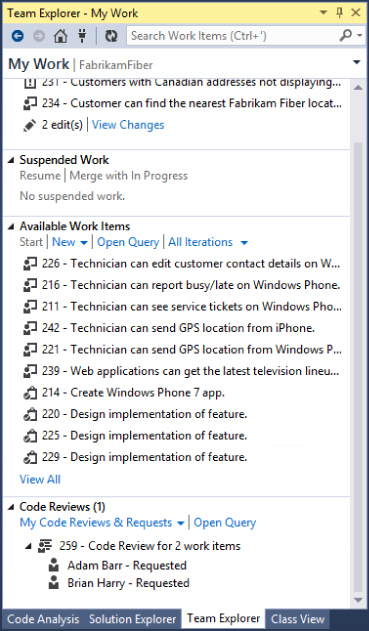
After you have submitted your response, the originator sees the response in his My Work pane. Figure 18.8 shows the result of this response. The originator can choose to reply to any specific comments, which is useful if this code review is audited later on. He can also continue to add or remove reviewers until he is satisfied that the code has received an adequate level of review. Finally, clicking Close Review closes the Code Review Request work item. When these changes are checked in, the Code Review Request work item is automatically included in the changeset, along with any linked code review responses.
Summary
This chapter provided a quick look at the areas of Visual Studio 2013 that will be of most interest to developers and provided a preview of what to look forward to in this next section of the book.
Chapter 19 focuses in detail on the unit testing, including why you should care about it as a developer, and what tools Visual Studio provides to help you create and run unit tests.