The last two chapters have presented the Cell SDK’s tools for building, debugging, and simulating applications. In each case, the usage examples involve the command line: statements, flags, and scripts. This chapter covers much of the same territory, but with a single graphical tool: the Cell SDK’s integrated development environment, or the Cell IDE.
At the time of this writing, the Cell IDE runs only on Linux. It’s possible to run the IDE on a Cell system, but the IDE is Java based and resource hungry. The Cell’s PPU isn’t up to the task of rendering the GUI, so I recommend running the IDE on a general-purpose processor. Further, the operating system must have a suitable Java Runtime Environment (JRE) installed. The GNU port for Java, GCJ, isn’t sufficient.
The Cell IDE is provided as one of the packages in IBM’s SDK. It’s not a separate application, but consists of plug-ins that augment an Eclipse installation. These plug-ins make it possible to create Cell-specific projects that can be built, debugged, and simulated with the SDK’s tools. This discussion covers each of these tools and how to execute them through the Cell IDE. But first, you need to install Eclipse and the C/C++ Development Tooling (CDT). This chapter begins by explaining how this is done.
Note
The Cell IDE is one of the most frequently changing tools in the SDK, and has probably transformed drastically by the time you read this. However, the basic operations of Eclipse/CDT/Cell SDK have remained consistent, so a good part of this presentation should retain its value.
Before you can run the Cell IDE, you have to acquire and install Eclipse and the C/C++ Development Tooling (CDT). Eclipse is one of the most popular open source IDEs available, and the CDT makes it possible to build C/C++ applications with Eclipse. This section explains what these tools are and how to get them running.
Eclipse was originally conceived as an IDE for Java alone, but its language support has extended to C/C++, PHP, Python, Fortran, Cobol, and even Ada. Eclipse consists of a small executable that draws its capabilities from code modules called plug-ins. The Cell IDE plug-ins customize Eclipse to build applications specifically for the Cell processor.
To download Eclipse, go to www.eclipse.org/downloads. This page presents the most recent version of Eclipse, but this might not be the version required by the Cell IDE. To be sure, check the IDE documentation that comes with the SDK. If the Cell IDE accepts the latest version, download the Eclipse offering called Eclipse for C/C++ Developers. This comes with the CDT already installed.
If the IDE requires an older version than the one listed, go to archive.eclipse.org/eclipse/downloads/index.php. Scroll down to find the required version and download it to your computer. In this case, you’ll have to install CDT separately.
Decompress the Eclipse archive and you’ll find a folder containing the Eclipse executable. The path to this folder will be referred to as $ECLIPSE. Launch the executable, select a workspace directory to hold your projects, and close the intro screen. The Eclipse main window will appear, as shown in Figure 5.1.

The CDT is a set of plug-ins that provides Eclipse with capabilities related to C/C++ development. These capabilities include C/C++ project management, source editing, and a graphical debugger interface. The CDT doesn’t compile or debug by itself, but provides point-and-click access to existing GCC-based tools.
If you downloaded Eclipse for C/C++ Developers, the CDT should already be available. To check, go to Help, About Eclipse Platform, Feature Details and search for the CDT feature (a feature is a set of united plug-ins). If the CDT feature isn’t installed, you can acquire it by taking advantage of Eclipse’s automatic update capability. This is provided through the Eclipse Help menu.
Go to Help, Software Updates, Find and Install and select the option Search for new features to install. Click Next, and the dialog will list possible update sites. If you find any site named after a moon of Jupiter or any other celestial body, select that site and click Finish. Choose the main site or a mirror and click OK.
The next dialog presents the features available for installation. Select any features that interest you, but make sure the C/C++ option is selected. This is shown in Figure 5.2.

Click Next, accept the license terms, and click Finish. When the Verification dialog appears, click Install All. Restart Eclipse and the CDT plug-ins will be inserted into your installation.
Just as the CDT enables Eclipse to build and debug C/C++ files, the Cell IDE plugs into the CDT and provides capabilities specifically for building applications for the Cell. The IDE is provided as an optional package, so if the Extras ISO file is in the /tmp/cellsdkiso directory, make sure to mount it with the following command:
/opt/cell/cellsdk —iso /tmp/cellsdkiso mount
Then install the IDE package with this command:
yum install cellide
This creates a directory called ide in the /opt/cell directory. Inside this directory is a folder called com.ibm.celldt.update. This is the update site for the Cell SDK IDE feature, and works like the update site that provided the CDT.
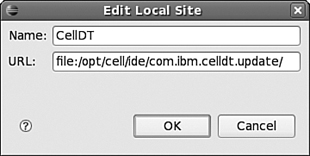
In Eclipse, go to Help, Software Updates, Find and Install and select Search for new features to install. Click Next and click the New Local Site button on the right of the dialog. Navigate to the /opt/cell/ide/com.ibm.celldt.update directory and click OK. In the dialog box that appears, change the name of the site to CellDT but leave the URL alone, as shown in Figure 5.3.
Click OK, then Finish. Select the CellDT feature to install and click Next. Accept the license, click Next, and then click Finish. Click Install All, and then restart Eclipse. At this point, you’ve fully installed CDT and the Cell SDK IDE.
In Eclipse, a project is a directory containing source code and related files that can be compiled into one or more executables. Generally speaking, each top-level makefile gets its own project. This section describes Eclipse/CDT project management in detail, from building and configuring a project to adding code and compiling. This presentation is tutorial based, so if you haven’t already, open Eclipse.
Figure 5.1 isn’t very exciting, so let’s create a project that builds an executable to run on a Cell SPU. This process takes five simple steps:
Go to the main menu at the top of the IDE and select File, New, Project.
In the New Project dialog, open the tab labeled C, select C Project (or Managed Make C Project if available), and click Next.
Enter
spu_sieveas the project name and click Next again.Open the combo box labeled Project Type and select Cell SPU Executable. Leave the other defaults selected and click Finish.
A dialog box will ask whether the project should be associated with the C/C++ perspective. Select Remember My Decision and click Yes.
In Eclipse, a perspective is a set of windows that combine to serve a purpose. The windows in the C/C++ perspective make it possible to compile, configure, and examine the content of C/C++ projects. To see the C/C++ perspective in its full glory, however, you need to create and edit a source file.
The Chapter5/sieve folder contains the same source file and makefile as in the Chapter 4 sieve project. To add these two files to your project, follow these four steps:
On the left side of the IDE, you’ll see a folder called spu_sieve. This is the project you created. Right-click the project name and choose Import.
In the Import dialog, enlarge the General tab, choose File System, and click Next.
Click Browse and select the sieve directory in the Chapter5 directory.
In the left side of the Import dialog, select the check box for the folder called sieve. On the right side, the Makefile and spu_sieve.c files should be selected. Click Finish.
In Eclipse, expand the spu_sieve project to see the added files, spu_sieve.c and Makefile. Double-click spu_sieve.c, and the C/C++ editor will open. The full C/C++ perspective is displayed and labeled in Figure 5.4.

This editor provides all the bells and whistles that one expects from a modern source editor. The syntax coloring is the most obvious feature, but there are many more:
Error checking—Delete the
tin theint main()function declaration. Save the editor content with Ctrl-S, and the code will automatically compile. Red squiggly lines will show where the error occurred; and if you hover your cursor over the red lines, you’ll see the error message produced by the compiler.Line numbering—Go to Window, Preferences. In the Preferences dialog, select the Editors, Text Editors option on the left. Click the Show line numbers check box on the right and click OK. In the C/C++ editor, line numbers will now appear on the left of the text. To go to a particular line, press Ctrl-l (lower-case L) and enter the line number.
Open declaration—Select the entire word
num_arrayon line 21. Press F3 and the editor will immediately focus on its declaration on line 7. This is very helpful for tracing variables in large source files.Refactoring—Select the
ivariable anywhere in the code. Enter Alt-Shift-R, renameitok, and click OK. This changes every occurrence ofiin the source tok.Block comments—Select the source code from lines 20 to 24. Enter Ctrl-/ and every line will be commented with C++-style comments. Undo this with Ctrl-Z.
Outline view—On the right of the editor, the Outline view keeps track of top-level objects in the source code. In this example, it displays the include file stdio.h, the macro N, and the function
main. If you close one of the views, you can restore it by going to Window, Show View and finding the appropriate view to display.
There are many other Eclipse editor tricks, including code formatting, shifting, and content assist. I recommend that you visit Window, Preferences to see all the ways you can tailor the editor’s operation to meet your requirements.
Eclipse makes it simple to modify the parameters of a project. To see how this is done, right-click the spu_sieve project and choose the Properties option. A window called Properties for spu_sieve will appear, and on the left, you’ll see all the different types of parameters that can be configured. The most important is C/C++ Build, so click this option. Figure 5.5 shows what the C/C++ Build Properties dialog looks like.

At the top center, the Configuration combo box lets you to choose between the debug and release versions of your SPU executable. Underneath, a tab folder allows you to configure other aspects of the project’s build: the tool parameters, parsers, environment variables, and macro definitions.
Figure 5.5 shows what the Tool Settings tab looks like. It lists all the executables involved in the project’s build process and allows you to customize the operation of each. For example, if you click the SPU GNU C Linker entry, you can add flags specifically for the linker. If you click Libraries, you can define the libraries that will be incorporated into the link step and the search path where the libraries can be found. These parameters work just like the corresponding spu-gcc flags. Similarly, Optimization lets you set the optimization level, and Warnings lets you pick which types of warnings want spu-gcc to display.
The other tabs provide similar configuration capabilities, and they are listed as follows:
Build Settings—Specifies the name of the output and controls the make process
Build Steps—Identifies commands to be run before and after the build
Error Parsers—Specifies which parsers should be used to examine errors
Binary Parser—Chooses a parser to examine binary files
Environment—Sets environment variables to be used during the build
Macros—Creates user macros and system macros to be used during the build
It’s a good idea to investigate these configuration tabs yourself, along with the other types of project properties. Many strange errors can be fixed by configuring the right property in your project’s settings.
By default, the environment automatically compiles C/C++ projects when they’re saved. To change this setting, select the Project menu item in Eclipse and uncheck Build Automatically. In this case, you can build the project in one of two ways: by right-clicking the project and choosing Build Project; or by selecting the project, choosing the Project menu item, and clicking Build Project.
To see the output of the build, click the Console view toward the bottom of the perspective. This gives you the same output as if you’d run spu-gcc from the command line. When the build finishes, you’ll see a folder called Binaries under the project folder in the C/C++ Projects view. This contains the spu_sieve executable.
spu_sieve was compiled for the Cell, and therefore needs a Cell processor to run on. You have two options: connect to a Cell system or start an instance of the Cell simulator. The next section explains both choices.
Toward the bottom of the C/C++ perspective, you’ll see a view called Cell Environments. This makes it possible to run Cell applications from inside the IDE. Figure 5.6 shows what the Cell Environments view looks like.

As shown, there are four different types of Cell environments. Three involve accessing a Cell simulator (Attached Cell Simulator, Local Cell Simulator, and Remote Cell Simulator), and one involves accessing a hardware Cell system (Cell Box). The easiest environment to work with is the hardware Cell system. This will be discussed first.
To tell the IDE that you intend to run your executable on a Cell system, right-click the Cell Box option in the Cell Environments view. Choose Create in the context menu and the Target Environment Configuration dialog will appear, as shown in Figure 5.7.

Enter a name for the target system in the text box marked Target Name and enter its hostname/IP address in the text box marked Host. Type your login name and password in the appropriate boxes and choose a directory on the remote Cell system where you’d like to run the executable. By default, Cell applications are executed in /tmp/IBM/CellIDE.
Click Finish, and a plus box will appear to the left of the Cell Box option in the Cell Environments View. Expand this box and you’ll see an option representing your Cell system. Its current status is Stopped.
To connect to the remote system, click the green triangle in the upper-right portion of the Cell Environments view. This connection makes the Cell environment available for running executables. After you’ve clicked this button, the status should change from Stopped to Running.
On the left side of the window, open the Binaries folder in the spu_sieve project. Right-click the spu_sieve executable. Go to Run As, Run. The Run dialog presents a number of configurations for running Eclipse executables. One configuration on the left should read C/C++ Cell Target Application. Right-click this and click New. It should create an spu_sieve element under the run configuration, and the dialog should look similar to the one in Figure 5.8.

If you receive an error about the debugger, click the Debugger tab in the right pane and choose Cell SPU gdbserver gdb/mi. You may also need to change the target in the Target tab. When the errors are gone, click Run and you should see the spu_sieve output displayed in the Eclipse console.
The Run dialog contains many other tabs to configure the running of an executable. If you click the Launch tab, you’ll see text boxes that accept command-line arguments and allow you to run Bash commands before and after the executable. The Environment tab allows you to define environment variables to be used during execution.
After you’ve created a run configuration for an executable, you don’t have to open the Run dialog again. Just click the Run button in the toolbar (green circle with white triangle), and Eclipse will automatically launch your executable with the settings you specified.
Accessing SystemSim as an execution platform is similar to accessing a remote Cell system. This discussion assumes you have the simulator installed on your local machine. Going back to the Cell Environments view in Figure 5.6, right-click Local Cell Simulator and select Create. The Target Environment Configuration dialog that appears is quite different from the one shown in Figure 5.7, and contains four tabs:
The Hardware tab allows you to configure the Cell device and choose the kernel and file system to run on it.
The Simulator tab allows you to select which windows will be present as the simulator runs.
The Connectivity tab defines network parameters for simulator communication.
The Launch tab identifies which directory on the simulated Cell will receive files from the host (/tmp/IBM/CellIDE by default).
Enter a target name in the Target name text box. Then, I recommend that you leave all the default options checked/unchecked except one: In the Simulator tab, select Show TCL console. This provides a command window similar to the one discussed in Chapter 4, “Debugging and Simulating Applications.” Then click Finish.
In the Cell Environments view, you can see a plus box to the left of the Local Cell Simulator. Expand this box, and your target is listed with a status of Stopped. Select this target and click the green triangle in the upper-right side of the view. This launches the simulator and creates the SystemSim graphical panel. It takes time for Linux to install on the simulated Cell, but when it’s finished, the status of your target will change from Stopped to Paused.
At this point, the simulator is ready to run your application. Right-click the spu_sieve executable in the Binaries folder and go to Run As, Run. Figure 5.8 shows what the dialog looks like. If a run configuration called spu_sieve already exists under C/C++ Cell Target Application, delete it. Right-click C/C++ Cell Target Application and create a new configuration.
Click the Target tab in the right pane and make sure that Local Cell Simulator is chosen. If you receive an error about the debugger, click the Debugger tab and choose Cell SPU gdbserver gdb/mi. Click Run.
At the bottom of the window, the Console view now receives output from two sources: the simulator’s command window and the simulated Cell processor. To select which data should be displayed, open the Console view. In the upper-right of the view, a monitor icon is displayed next to a downward-pointing arrow. Click the arrow and choose the option for Remote process. This will display the result of the spu_sieve application running on the simulated Cell. When the application finishes, the simulator target will return to its Paused state and will be ready to run further applications.
The Cell IDE makes it easy to access the ppu-gdb/spu-gdb debuggers described in Chapter 4. This discussion focuses on debugging executables on a remote Cell system, but the process is similar for simulated executables.
The first step is to set a breakpoint. In the code editor, find line 8 in spu_sieve.c and right-click the gray space directly to the left of the line. Click Toggle Breakpoint in the context menu. This creates a green dot to the left of the line and tells spu-gdb to halt processing when it reaches this instruction.
In the spu_sieve project, open the Binaries folder and right-click the spu_sieve executable. Go to Debug As, Debug. The Debug dialog looks and functions like the Run dialog in Figure 5.8. If you already created an spu_sieve entry under C/C++ Cell Target Application, you shouldn’t need to provide more information. Just click the Debug button in the lower right. If you haven’t created the entry, go back to the preceding discussion and follow the steps listed for running an executable.
When you click Debug, the Eclipse windows will rearrange themselves to form the Debug perspective, as shown in Figure 5.9.

The Debug view is shown in the upper left. This gives you the big picture: which debugger is running and which thread and function are being debugged. This information is particularly important when you’re debugging multithreaded applications. The Debug view also contains the toolbar whose actions control the debugger:
Restart ends the debug session and starts a new one.
Resume continues processing until the next breakpoint/watchpoint or until the application ends.
Terminate ends the debug session.
Step Into executes the current instruction, steps into function calls.
Step Over executes the current instruction, steps over function calls.
Instruction Stepping Mode opens a disassembly window and allows you to step through the assembly code corresponding to the application.
Another important command is Run to Line, but there is no corresponding toolbar entry. When you select a succeeding line in the text editor and press Ctrl-R, the debugger automatically processes all the instructions up to the selected line.
Below the Debug view, the text editor shows which line of code will be processed next. In this case, line 8 is shaded green, which means the debugger has started the application and processed each line up to line 8. If you click Step Into, the debugger will process line 8 and skip to the next line of code.
The views in the upper right display the debugger’s output. The Variables view shows the current value of each variable in scope, and if you open the num_array entry, you’ll see that num_array[0] and num_array[1] have been initialized to 1. The rest of the array elements remain set to zero. As their names imply, the Breakpoints view and Registers view display the current breakpoints and the content of the SPU’s many registers. The Modules view lists the names of the source files that were accessed to form the spu_sieve executable.
The Outline view in the lower right lists all the functions in the debugged source code and the objects of preprocessor commands. The only function in spu_sieve is main, and if you click this entry, the main() declaration will be selected in the editor.
I recommend that you step through spu_sieve.c and become familiar with the graphical debugger display. Experiment with the Step Into, Step Over, and Run to Line commands, and be sure to watch the values change in the Variables and Registers views. When you’ve finished, click the red square to terminate the debug session. Then, if you can find the >> button in the upper right of the window, you can choose the C/C++ perspective and return to the usual editing environment.
Many Linux users prefer command lines, but as graphical user interfaces go, the Eclipse/CDT environment is as good as they come. It’s particularly helpful for managing large projects: The project navigator organizes all the files in the build, including headers, makefiles, and the debug/release versions of executables. It takes time to configure a project’s properties and build configuration, but when you’re finished, you can build and run the project with a single click.
I find the Eclipse/CDT graphical debugger to be the most useful aspect of the Cell SDK IDE. The Variables view and Registers view make it simple to determine what’s happening in the processor, and I don’t have to remember all the strange gdb commands. But even more important, I don’t have to keep track of line numbers. I can double-click to create a breakpoint and click to step to succeeding lines. And with each step, I can examine the processor state without entering more commands. Eclipse can be unwieldy and resource hungry at times, but in my opinion, these debugging features more than justify its existence.